Blog

  • Analyzing the Relative Riskiness of Rice Yields

    Analyzing the Relative Riskiness of Rice Yields

    Two of the primary risks faced by any producer at any point in time are production and price risk. In agricultural crop production, farmers must deal with the risk of crop yield losses due to several causes of loss such as excess rainfall, drought, and pest pressure via parasitic insects or weed populations. While all crops grown in the U.S. are exposed to these risks, the effect that these risks have on crop yield is not the same for all crops. Understanding the differences in the production of each crop and the risks faced by each crop is important for risk management as this information informs which tools a producer will need to select to minimize losses and stabilize their farm income year-to-year. In this article, we evaluate the relative riskiness of rice to other principal crops grown in the midsouth region to better inform a producer’s risk management strategy and provide implications for policymakers evaluating risk protection programs in the upcoming farm bill.

    We compare the relative yield risk of rice production to corn, soybean, and cotton production by considering the state-specific coefficient of variation (CV) for the yield of each crop as a measure of relative yield risk. Put simply, the CV is a measure of how much yield across a given state varies relative to the average yield of that state. The CV allows us to make comparisons between different crops and counties to assess if one crop is more or less risky to grow than another crop in a specific state. We used state-level data[1] from 2007-2022 (USDA-NASS, 2023) and removed a linear time trend from each crop yield in each state to account for changes in technology and production practices in each state over time.

    Figure 1 gives the state-specific ratio of the CV for corn relative to the CV for rice. This ratio of two CVs tells us how much more, or less, risky corn yield is relative to rice yield. For example, in Arkansas the ratio of 1.62 implies that it is about twice as risky to grow corn relative to rice in that state.  Figure 2 gives the state-specific ratio of the CV for soybeans relative to the CV for rice. Using Mississippi as an example, the ratio of 4.92 implies it is nearly 5 times riskier to grow soybeans than rice in that state. Finally, Figure 3 gives the ratio comparing CVs for upland cotton to CVs for rice with ratios ranging from nearly 2 to a little over 5 indicating it is nearly 2-5 times more risky to grow cotton than it is rice in the states considered.  

    There are several other levels of relative riskiness across rice-producing counties in the midsouth, but the same message generally holds: rice yield risk is relatively lower than the yield risk of its competing crops in the midsouth. This becomes important when deciding between risk management strategies that focus on production risk or price risk. Due to the lower rice yield risk, programs such as the Price Loss Coverage (PLC) may be more advantageous to rice producers than programs like the Agriculture Risk Coverage (ARC) program, which also helps explain why rice producers have overwhelmingly favored PLC. 

    Figure 1. Ratio[1] of the CV for Corn Yield to the CV for Rice Yield (2007-2022)

    [1] The Coefficient of Variation (CV) is the ratio of the Standard Deviation to the Mean of each state and crop yield distribution. The plots in Figures 1-3 gives the ratio of two CVs. The state-specific values plotted are not CVs. 

    Figure 2. Ratio of the CV for Soybean Yield to the CV for Rice Yield (2007-2022)

    Figure 3. Ratio of the CV for Upland Cotton Yield to the CV for Rice Yield (2007-2022)

    [1] We note that while we are unable to distinguish between irrigated and nonirrigated yields across time, USDA-NASS provides a breakdown of the shares of irrigated and nonirrgated acres in Table 34 of the 2017 Agricultural Census. The portions of acres irrigated in Arkansas for corn, soybeans, and cotton is 93%, 85%, and 93%, respectively. The same irrigated portions in Mississippi are 81%, 74%, 74%. The irrigated portions for Louisiana are 78%, 68%, 60%. The irrigated portions for Texas are 84%, 83%, and 52%.

    References

    USDA-NASS. (2023, May 10). USDA-NASS 2017 Agricultural Census. Retrieved from https://www.nass.usda.gov/Publications/AgCensus/2017/Full_Report/Volume_1,_Chapter_1_State_Level/

    USDA-NASS. (2023, April 20). USDA-NASS QuickStats. Retrieved from https://quickstats.nass.usda.gov/


    Biram, Hunter, and Brian E. Mills. “Analyzing the Relative Riskiness of Rice Yields.Southern Ag Today 3(19.4). May 11, 2023. Permalink

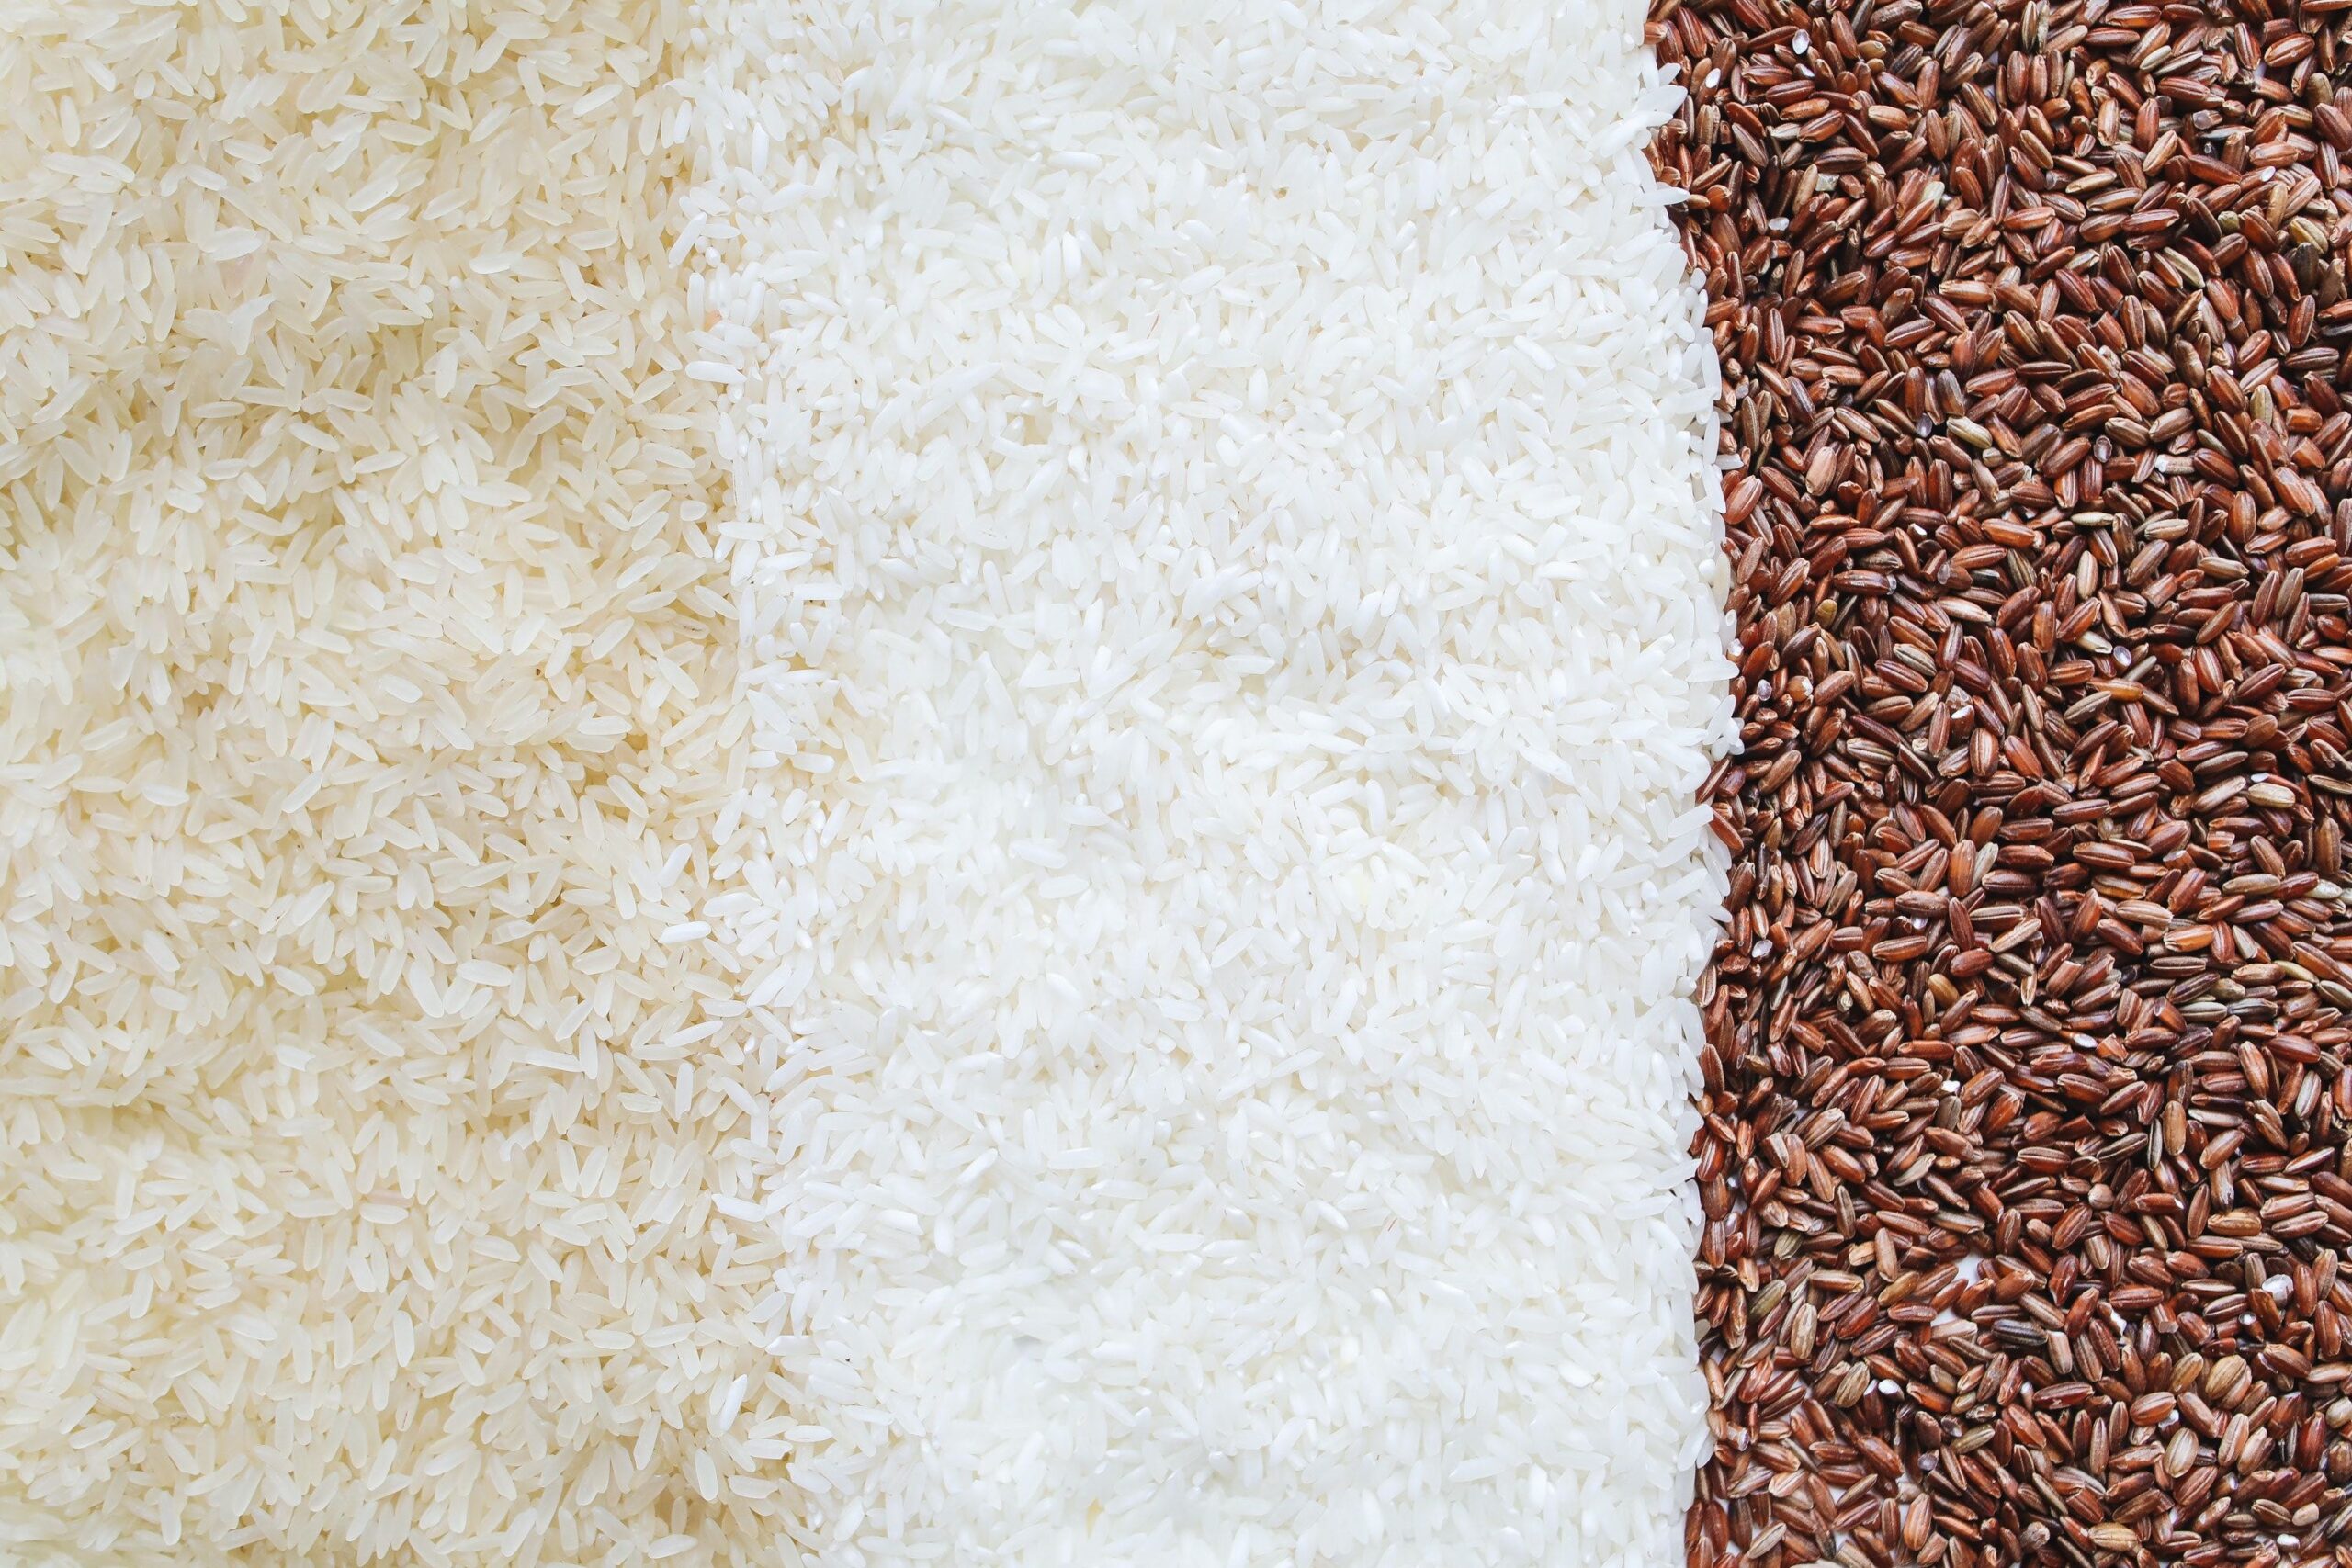
    Photo by Polina Tankilevitch: https://www.pexels.com/photo/close-up-photo-of-assorted-rice-4110255/

  • Economic Uncertainty and Ways to Prepare for the Worst

    Economic Uncertainty and Ways to Prepare for the Worst

    The overall farm financial health remained resilient and strong in the past few quarters. The agricultural loan default rates for both production and farmland loans have decreased in 2022. Observation from the Farm Credit Administration (FCA) also shows that the percentage of nonperforming loans is at 0.47%, a very low number compared to previous years. The total number of farm bankruptcy cases (Chapter 12 bankruptcies) was 169 in 2022, the lowest number since 2004. However, the outlook appears less positive.

    Source: USDA ERS

    We just began the first quarter of 2023 with great uncertainty. On April 28th, it was reported that the GDP growth rate in the U.S. slowed considerably. The annualized rate of growth was only 1.1%, half of what was forecasted. March inflation rate was higher than the expectation and reached 4.2%. There are signs of recession, including the yield curve inversion observed in the U.S. treasury. There have been massive layoffs in the tech sector, reduced corporate investments, and major bank failures on the West and the East coasts. 

    The agricultural sector is expected to be affected by these uncertainties. USDA’s forecast made earlier this year shows net farm income is predicted to drop significantly in 2023, by more than 13%. If we do enter a recession and consumers tighten their budgets, there is a possibility that the impact will be even more severe and extend beyond 2023.

    What can we do in the face of all these economic uncertainties? If the farm business is expected to be under financial stress in the worst-case scenarios, taking certain actions can lessen the impact. These actions fall into three strategies to improve the financial situation of the farm business.

    Managing Cash Flow

    Control costs. Reducing costs is an ongoing challenge for agricultural producers. Evaluate all procedures and purchases and seek ways to improve cost efficiency. 

    Reduce or postpone capital purchases and family withdrawals. Critically evaluate purchases and consider repairing for another year rather than replacing.

    Other income sources. Consider ways to leverage any excess capital and labor. For example, do you have the equipment/labor/time to provide custom work for other producers?  

    Marketing.  Sharpen your marketing plan, and be ready to act on opportunities to lock in profitable prices. 

    Renegotiate leases. Approach the landlord with a proposal to reduce the lease payment or shift from a cash lease to a shared lease agreement.

    Managing Liabilities

    Renegotiate loan terms. Extending loan terms will ease cash flow pressures by lowering loan payments. Refinancing carryover debt or paying interest only for a short term could be negotiated. 

    Reduce debt. Reducing debt will certainly relieve some financial stress, but be careful about sacrificing valuable working capital. Although not easy to find, outside equity investment may be a viable source of capital and/or debt reduction.

    Refinance. Carefully weigh the advantages of extended loan terms vs. today’s higher interest rates.  Refinancing may not save as much as expected.  If the broader economy moves into recession, watch for declining interest rates and future refinancing opportunities.

    Managing Assets

    Liquidate cash and investments. If the farm business has maintained a financial reserve of cash or investments, this may be the time to use it to reduce or avoid debt.

    Sell inventory and capital assets. If the farm business is holding inventory and waiting for higher prices, consider selling that inventory to reduce debt. If you can do it without affecting operations, selling land or equipment that is seldom used may be a good strategy to generate funds.


    Kim, Kevin, and Brian E. Mills. “Economic Uncertainty and Ways to Prepare for the Worst.Southern Ag Today 3(19.3). May 10, 2023. Permalink

    Photo by Mikhail Nilov: https://www.pexels.com/photo/a-person-typing-on-laptop-7731373/

  • National Feeder and Stocker Cattle Receipts Higher to Start 2023

    National Feeder and Stocker Cattle Receipts Higher to Start 2023

    The number of feeder and stocker cattle sold during the first four months of 2023 was about four percent higher than during the same period in 2022 according to data from the USDA-AMS National Feeder and Stocker Cattle Summary.  Strong prices, persistent drought in some regions, and the timing of wheat pasture cattle movement likely contributed to these higher totals despite the smaller calf crop in 2022. 

    Shown in the chart above, receipts have generally followed the seasonal pattern of declining sales through the first four months. This dataset includes auction, direct, and video/internet sales that are reported to USDA. It does not capture all feeder and stocker cattle transactions and the report notes that “receipts vary depending on the number of auctions reported” – but comparisons over time can be informative when considering current market dynamics to previous years.  

    On the surface, the stronger receipts totals are at odds with the 2 percent smaller calf crop in 2022 than in 2021. However, the data are most likely indicating market timing differences instead of changes in total cattle inventory. Cattle prices have been significantly stronger this year as compared to a year ago and drought continues to be a key issue in Texas, Oklahoma, Kansas, Nebraska and other areas which is limiting grazing opportunities. These factors have likely led to more cattle moving into feedlots or grow yards earlier than normal. Compared to the 5-year average from 2017-2021, receipts are one percent lower so far in 2023.

    The report also gives information about the mix of steers and heifers and weight ranges and suggests slightly fewer heifers and lighter cattle have been sold this year.  Heifers represented 40.9 percent of the stocker and feeder cattle sold during the first 4 months of 2023. This is about one percentage point lower than in 2022. The percent of cattle sold weighing above 600 pounds is also lower at 72.6 percent compared to 73.9 percent a year ago.

    Looking ahead, auction receipts will increase seasonally as summer arrives. However, overall supplies this year are expected to be smaller. The estimate of the expected calf crop for 2023 will be released on July 21st as part of the mid-year USDA Cattle Inventory report.


    Maples, Josh. “National Feeder and Stocker Cattle Receipts Higher to Start 2023.” Southern Ag Today 3(19.2). May 9, 2023. Permalink

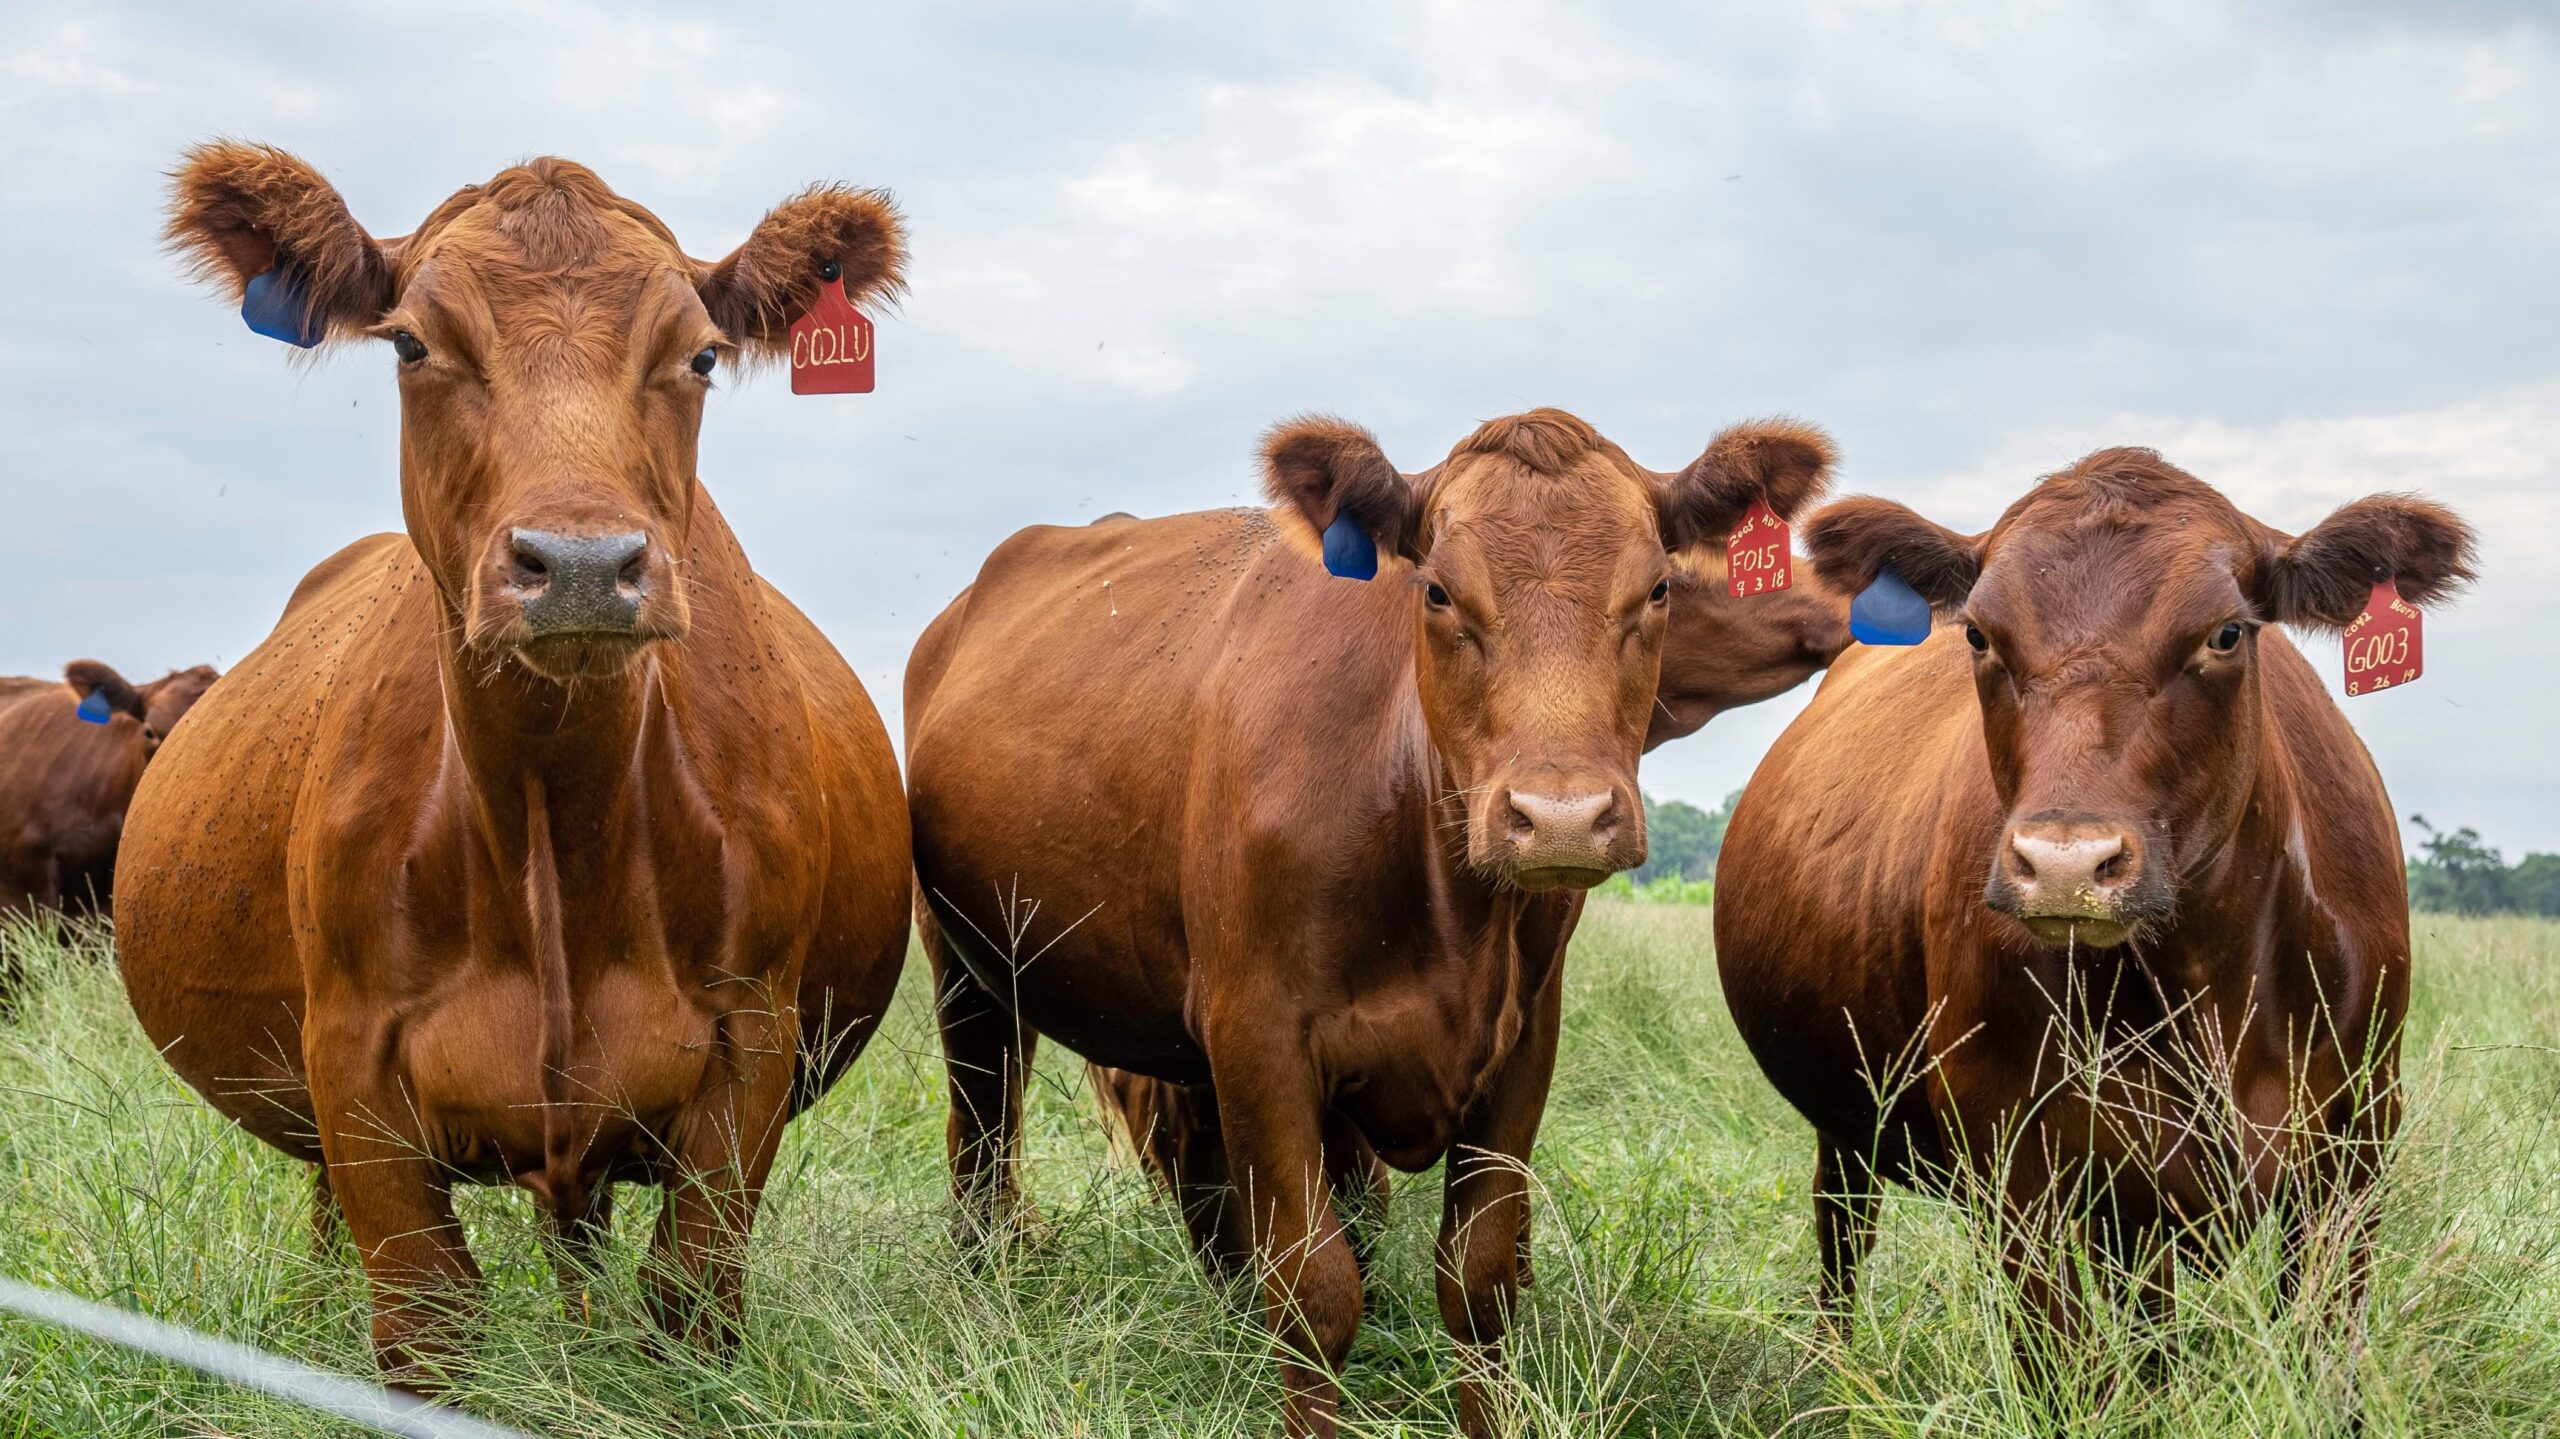
    Photo by Mark Stebnicki: https://www.pexels.com/photo/brown-cattle-2253553/

  • The Importance of Corn Production in the South to the U.S. Corn Supply

    The Importance of Corn Production in the South to the U.S. Corn Supply

    USDA’s Prospective Plantings report on March 31 showed U.S. farmers intend to increase corn acres from 88.6 million in 2022 to 92.0 million in 2023. Of the 3.4-million-acre national increase, 865,000 acres or about 25%, are in the South: Alabama, Arkansas, Georgia, Florida, Kentucky, Louisiana, Mississippi, North Carolina, Oklahoma, South Carolina, Tennessee, Texas, and Virginia.   Of these 13 states, 10 show increases of 10 percent or more (Figure 1). Only Texas and Florida show a decrease in corn acres year to year.  One influence for an increase in corn across the South in 2023 was that the harvest futures price of corn this winter and early spring was high relative to the harvest futures price of cotton. The 10 states with an increase in corn acres decreased cotton acres by 789,000.  Texas farmers indicated they intend to plant 100,000 fewer acres of corn, 1.650 million fewer acres of cotton but 1.4 million more acres of wheat and increase hay harvested area by 610,000 acres.  

    The South planted 9.370 million acres of corn in 2022. The prospective plantings survey showed intentions to plant 10.235 million in 2023.

    Figure 1. 2023 Corn Planted Acreage, “Prospective Plantings”

    (USDA, NASS, 2023a)

    In 2000, the average corn yield in the South was 120.8 bushels per acre compared to 136.9 bushels per acre nationally. Since that time, corn yield increases in the South have kept pace with the rate of corn yield increases nationally, both about 1.8 bushels per year (Figure 2). Notable is the greater degree in yield variability in the South compared to the national average.  In the 23 years since 2000, corn yields in the South have been above or below the trendline yield by more than 10% seven times: -14%, 2002; +11 %, 2004; -15%, 2011; -12%, 2012; +13%, 2013; +11%, 2014; -11%, 2022. The national corn yield has only been above or below trend by 10% or more twice in that same period of time: +11% in 2004; -22% in 2012.

    Figure 2. Corn Yields: South and U.S. with trendlines and projections to 2023 (bushels r acre)

    USDA, NASS, 2023c

    Trendline yield growth in 11 southern states has exceeded the national average, three below average – NC, OK, and TX (Figure 3). Texas, the state with the largest corn acreage in this region, has essentially had  no change in average yields since 2000. 

    Figure 3. Trendline Yield Increase, 2000 to 2022 (bushels per acre)

    USDA, NASS, 2023c

    Based on the prospective plantings survey, 10-year average percent harvested calculations, and the trendline yield projection, corn production in the South would increase by 308 million bushels in 2023 compared to 2022.  

    Table 1. 2022 Corn Production in the South with Projections for 2023

    *projected

    Since 2000, corn production in the South has averaged 8.9 percent of total U.S. corn production, with a low of 7.5 percent in 2006 to a high of 11.0 percent in 2013 (USDA, NASS, 2023c) (Figure 4). As a share of total U.S. production, corn in the South increases from 8.3 percent in 2022 to 9.7 percent projected for 2023.  This percentage is consistent with the increasing importance of southern corn production to the U.S. corn supply. However, the broad range of growing conditions across the South means yield variability in that supply is more likely year to year.

    Figure 4. South’s Share of U.S. Corn Production

    USDA, NASS, 2023c

    References

    USDA, NASS (a), “Grain Stocks, “Prospective Plantings, Rice Stocks Agricultural Statistics Board Briefing”, March 31, 2023, https://www.nass.usda.gov/Newsroom/Executive_Briefings/2023/03-31-2023.pdf

    USDA, NASS (b), “Prospective Plantings”, March 31, 2023, https://downloads.usda.library.cornell.edu/usda-esmis/files/x633f100h/rv044597v/gx41nz573/pspl0323.pdf

    USDA, NASS (c), Quick Stats, accessed April 18, 2023,  https://quickstats.nass.usda.gov/.


    Welch, Mark. “The Importance of Corn Production in the South to the U.S. Corn Supply. Southern Ag Today 3(19.1). May 8, 2023. Permalink

    Photo by David Dibert: https://www.pexels.com/photo/corn-plantation-during-daytime-5001990/

  • Riding off into the Sunset: State Policies and Contract Provisions That Impact Decommissioning a Solar Facility

    Riding off into the Sunset: State Policies and Contract Provisions That Impact Decommissioning a Solar Facility

    Disclaimer: This article is provided for purely educational purposes, and the reader should check to see if state policy has changed since its posting.  

                The question often asked by landowners considering leasing a portion of their property for solar development is, what happens at the end of the lease?  The answer to this question often depends on current state policy and the decommissioning clause negotiated in the lease.  While this is a rapidly developing topic, we provide a current synopsis of both in the paragraphs that follow. 

    Based on a cursory review of state law – and as summarized in Table 1 – there is a considerable amount of variability across the South.  For example, 6 states require some form of decommissioning plan, with 4 of those also requiring assurance that funds will be available to decommission the solar project at the end of its life.  Another 3 states have legislative action pending and/or have developed a model ordinance for local government (e.g. Georgia).  Finally, 4 states have no statewide decommissioning regulations.  

    With respect to decommissioning clauses negotiated into leases, lease terms often state that the facility will be removed and potentially include a bonding requirement.  Landowners should often consider negotiating a decommissioning clause that considers current state policy plus how to restore the land in the future once the solar facility is removed.

                When presented with a lease for a solar energy facility, landowners should have a clause that deals with decommissioning and cleanup of the site.  Depending on the state, these clauses can either enhance the existing decommissioning policy or dictate how the cleanup process will occur.  The typical lease should require the company to remove all its Solar Facility, including the panels, posts, and concrete pads, and typically remove wiring down to plow depth.  Some leases may go beyond this clause and require the solar company to put up a bond to cover the necessary cleanup costs.  Landowners often request a bond to assist with potential cleanup costs if the solar company defaults on the required cleanup of the facility.  Many state policies related to solar decommissioning also require putting up bonds to cover necessary cleanup costs.  

                As a landowner presented with a solar lease, what should you consider as it relates to decommissioning a solar facility? First, take a moment to consider the location of the facility.  What features exist on that piece of property that need to be restored?  How do you want to see the site restored? Next, negotiate how the site should be restored to allow the land to return to productive agricultural use.  Take photos to demonstrate the current conditions and to give future parties an understanding of what the site initially looked like.  Taking the time to document the land’s condition and negotiate a decommissioning clause that considers state policies at the time will allow for the site to be decommissioned in a way that reduces potential conflicts in the future.

    Table 1.  Summary of State Decommissioning Regulations in the South

    StateDecommissioning RegulationsState Code/Legislative CitationDate Enacted
    AlabamaNo state-wide decommissioning regulations  
    ArkansasNo state-wide decommissioning regulations  
    FloridaNo state-wide decommissioning regulations  
    GeorgiaA model ordinance was developed for local governments  
    KentuckyDecommissioning plan required with financial assurance.Ky. H.B. 4 – 2023 Reg. Sess.30-Mar-23
    LouisianaDecommissioning plan required with financial assurance.La. Rev. Stat. § 30:11542-Aug-22
    MarylandDecommissioning plan required with financial assurance.Md. Code Regs. 27.01.14.048-Mar-21
    MississippiNo state-wide decommissioning regulations  
    North CarolinaLegislative action pending.  
    OklahomaDecommissioning plan required.60 Okla. Stat. § 820.113-Apr-11
    South CarolinaLegislative action pending.  
    TennesseeDecommissioning plan required with financial assurance.Tenn. Code § 66-9-2071-Jun-22
    TexasDecommissioning plan required with financial assurance.Tex. Util. Code § 302.00041-Sep-21
    VirginiaA locality must require a lessee to have a decommissioning planVa. Code Ann. § 15.2-2241.221-Mar-19

    Goeringer’s work is supported by the Agriculture and Food Research Initiative (AFRI) program, grant no. 2020-68006-31182/project accession no. 1022637, from the U.S. Department of Agriculture, National Institute of Food and Agriculture.  Any opinions, findings, conclusions, or recommendations expressed in this publication are those of the author. They should not be construed to represent any official USDA or U.S. Government determination or policy.


    Goeringer, Paul, and Bart L. Fischer. “Riding off into the Sunset: State Policies and Contract Provisions That Impact Decommissioning a Solar Facility.Southern Ag Today 3(18.5). May 5, 2023. Permalink

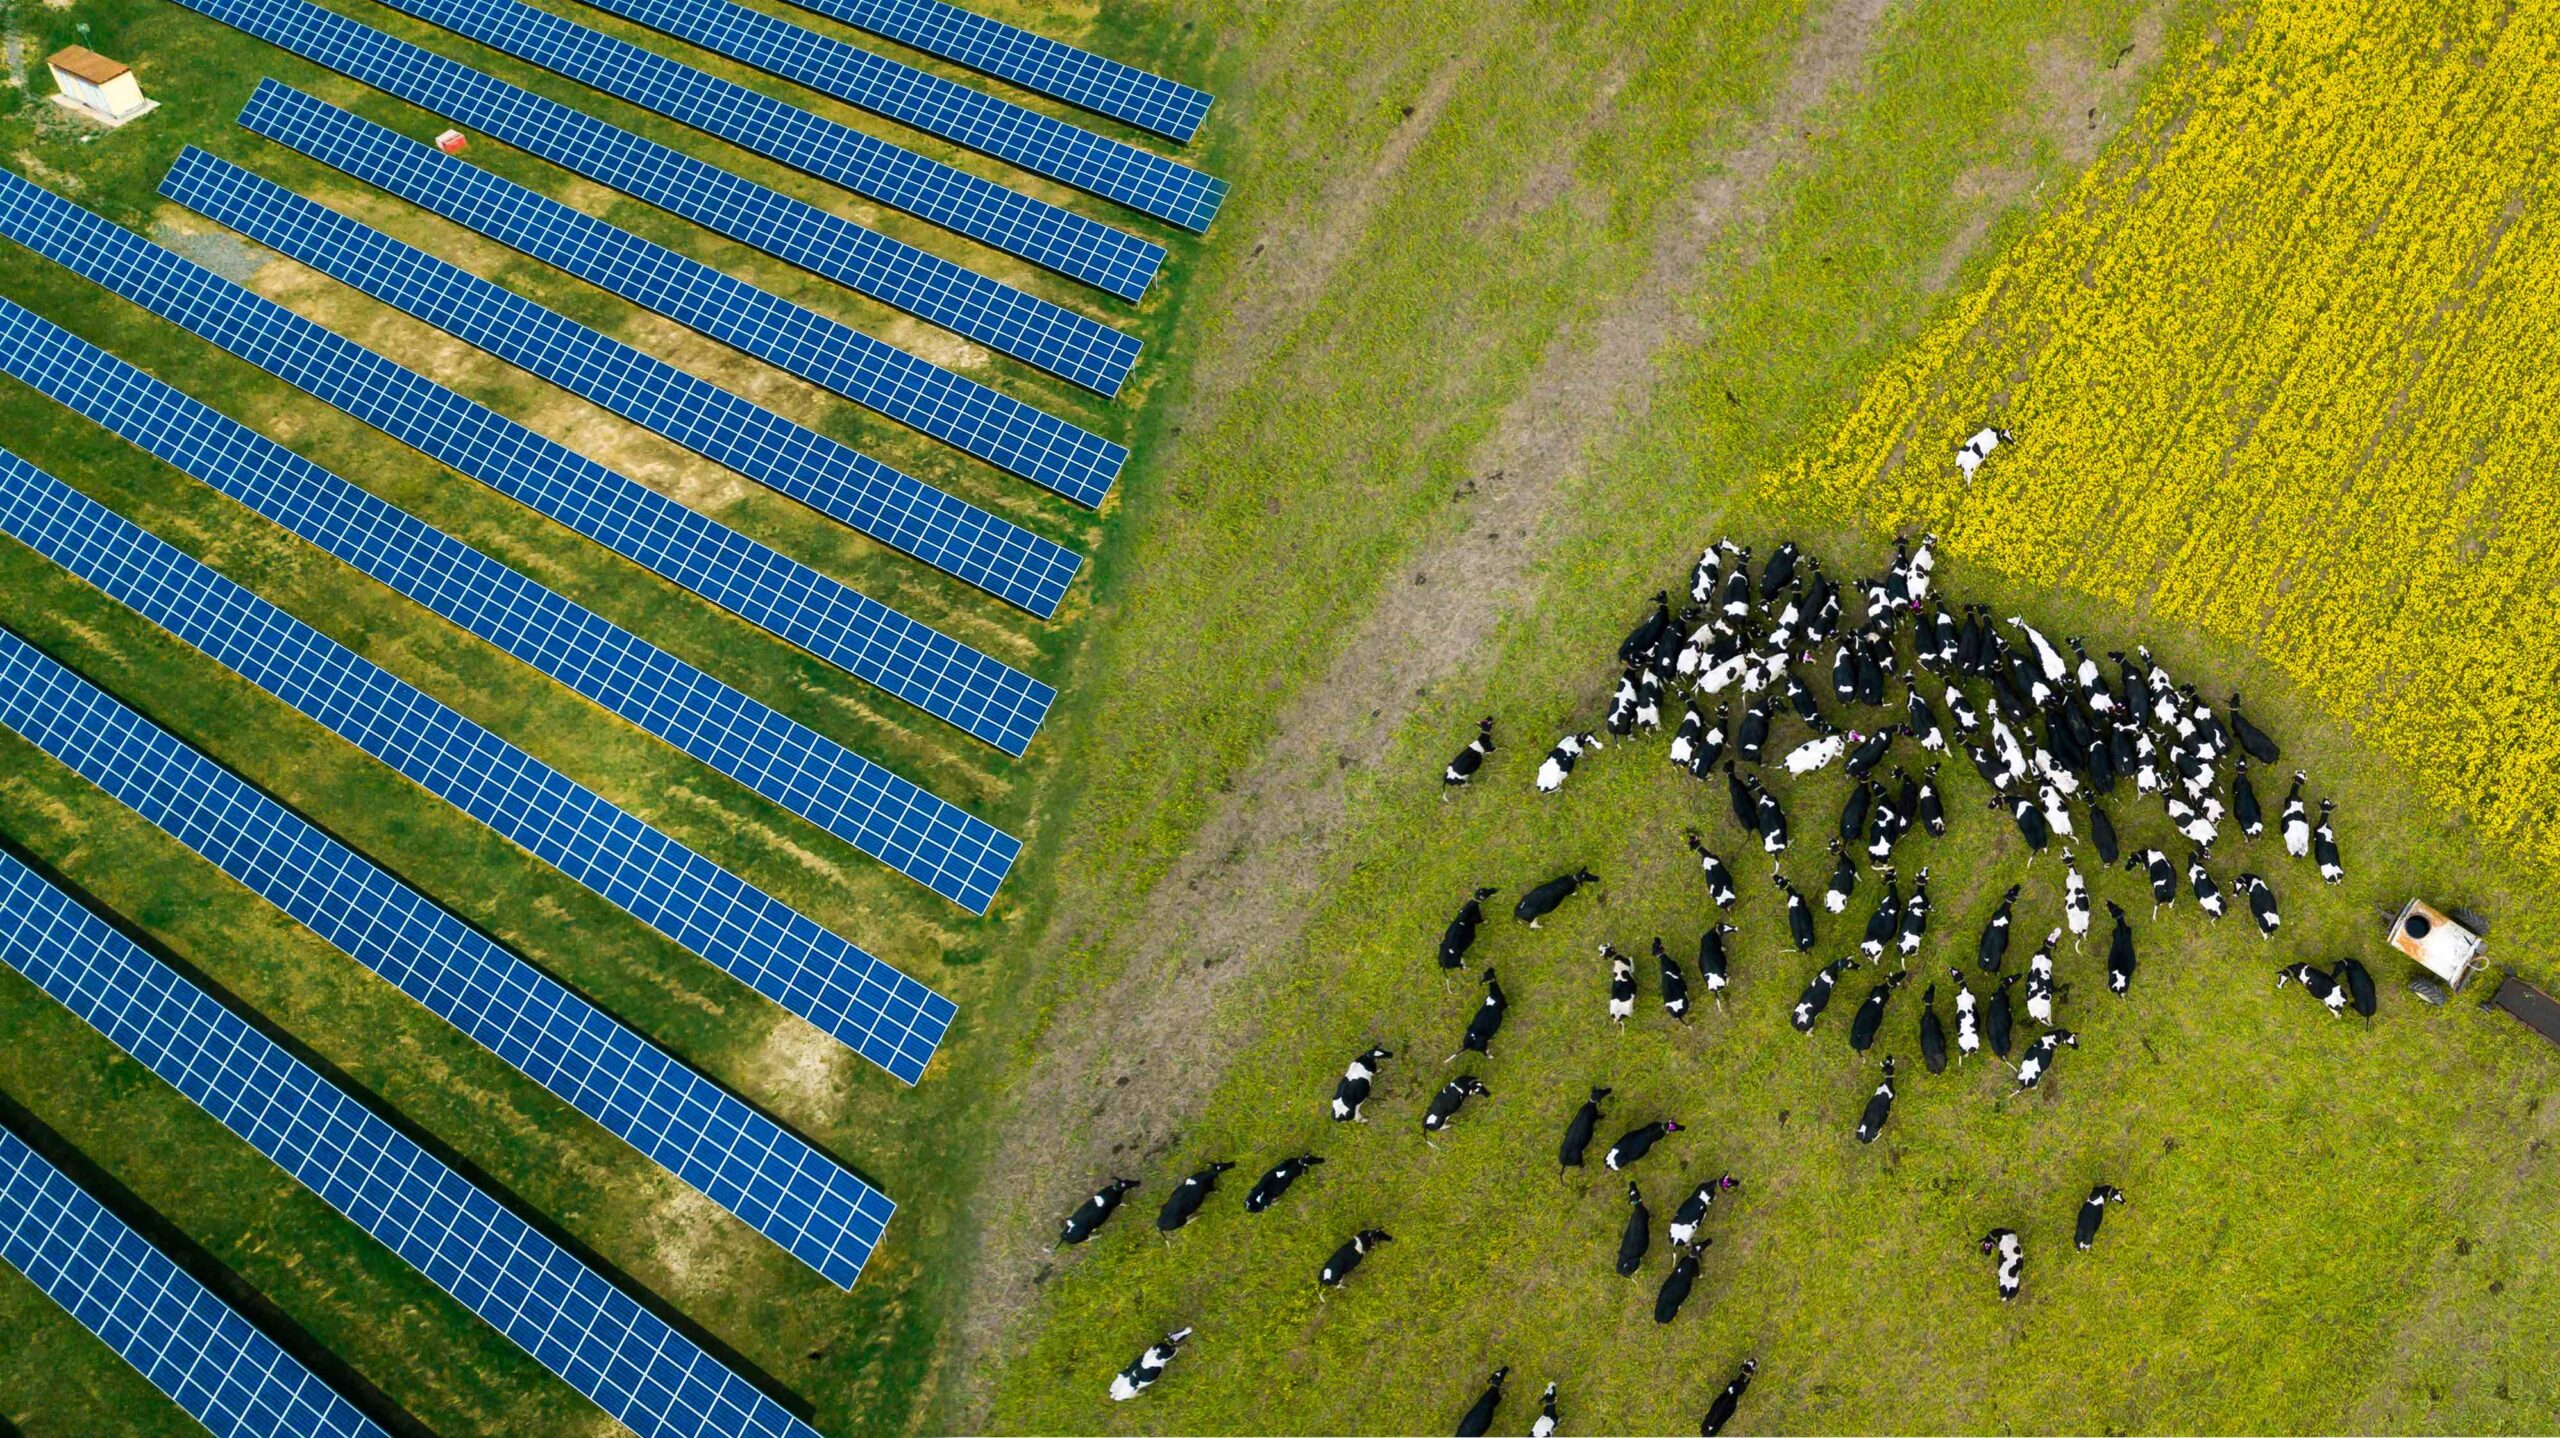
    Image Credit: A herd of cattle grazing near a solar panels by Dzmitry Palubiatka