Blog

  • Texas v. New Mexico

    Texas v. New Mexico

    On June 21, 2024, the United States Supreme Court issued an opinion in the long-running dispute between Texas and New Mexico over the 1938 Rio Grande Compact. The Court, in a 5-4 decision, held that the federal government could block an agreement between Texas and New Mexico to resolve their dispute. Although the compact relates to the river, the dispute centers on groundwater pumping. 

    Texas filed suit against New Mexico in 2013, alleging that excessive groundwater pumping in New Mexico deprived Texas of its fair share of Rio Grande water under the compact.  Note that lawsuits between states originate in the United States Supreme Court. The Court appoints a Special Master to hold hearings and make recommendations to the Court, which ultimately decides the issues.

    Unlike most compacts, the Rio Grande Compact requires New Mexico to deliver water not to the New Mexico/Texas border, but to Elephant Butte Reservoir, a federal project about 100 miles north of the border. Texas alleged that groundwater pumping along the river between the Elephant Butte Reservoir and the state line took water from the river that rightfully belonged to Texas.  

    The federal government filed a motion to intervene in the litigation in 2014, alleging that its interest in the federal project at Elephant Butte allowed intervention to protect the government’s rights and obligations. The federal government, through Downstream Contracts, was required to deliver water to an irrigation district in New Mexico, and one in Texas. The Court allowed the federal government to intervene, a relatively rare occurrence, because of the unique circumstances of the case and the fact that its interests aligned with those of Texas.

    Texas’ lawsuit focused on increased groundwater pumping between the Elephant Butte Reservoir and the state line. While the federal government had operated the reservoir based on data from 1951 to 1978 (“D2 data”), a time period where groundwater pumping increased significantly in New Mexico, Texas asked for allocations to be based on 1938 data, when there was much less groundwater pumping in New Mexico. The United States, which had operated based on the later for decades, did not request a change.

    After 10 years of hearings and litigation, Texas and New Mexico agreed on a consent decree, settling the issues between the states. The agreement continued water allocations based on the D2 period, which favors New Mexico, but measured the water delivery at El Paso, which favors Texas. Complex accounting measures in the agreement ensured that Texas would receive the state’s fair share of water. 

    However, the federal government objected to the agreement, claiming that its interests in administering the water project were threatened. In addition, for the first time, the federal government claimed that the water allocation should be based on 1938 levels of groundwater withdrawals. New Mexico estimates that a forced reduction in groundwater withdrawals to 1938 levels would mean a loss of 50,000 jobs and 10% of the state’s gross domestic product.

    Justice Jackson, joined by Chief Justice Roberts and Justices Sotomayor, Kagan, and Kavanaugh wrote the majority opinion. The majority found that the federal government had independent claims that would be resolved by the agreement. Given that the government was now a party, the agreement could not resolve the government’s interests without its consent. Since the government’s interests were aligned with those of Texas, and Texas had requested a 1938 baseline, the government was deemed to make a similar request. Given the close connection between the compact, the federal project and the irrigation contracts, the government must agree to any resolution of the case.

    Justice Gorsuch, who also authored the Court’s 2018 unanimous opinion allowing the United States to intervene, wrote the dissenting opinion, and was joined by Justices Thomas, Alito, and Barrett. The dissenters summarized their position as follows:

    The Court’s decision … defies 100 years of this Court’s water law jurisprudence. And it represents a serious assault on the power of States to govern, as they always have, the water rights of users in their jurisdictions. The Special Master issued a detailed 115-page report laying all this out. His views were wise, his recommendations sound, and, respectfully, we should have done as he suggested.

    The dissenters opine that the Court denied the entry of the consent decree “[b]ecause the federal government demands as much.” In addition, the federal government could not assert these claims alone in the Court but would have to file a lawsuit in the lower court.

    Given the number of federal water projects in the United States, and increasing disputes between surface water and groundwater users, this decision could allow the federal government to take control of groundwater allocations in a large number of situations. Groundwater users generally lose these disputes because groundwater withdrawals generally began after surface water withdrawals. Since the surface water users have seniority, surface water withdrawals receive priority. The decision may cause large cuts in groundwater withdrawals in New Mexico, as well as put groundwater users in jeopardy wherever federal water projects exist. As in this case, the competing uses will likely include large agricultural users. New Mexico and Texas will now have to start back at square one.

  • Will We See a New Farm Bill This Year?

    Will We See a New Farm Bill This Year?

    The U.S. House of Representatives departed Washington, DC, for the August recess last week, and the Senate is currently wrapping up its business. When Congress returns in September, most of the legislative agenda prior to the Presidential election will be focused on funding the government past September 30, 2024. This naturally raises the question: will we see a new farm bill this year?

    We can look to the past 10 farm bills (over the course of the last 50 years) for guidance. As noted in Table 1, only 2 of the last 10 farm bills were enacted during presidential election years (1996 and 2008 Farm Bills), and both of those were signed into law before Congress left town for the August recess. The remaining 8 farm bills were enacted in the Congress following the Presidential election, with 2 of those (1990 and 2018 Farm Bills) coming in the lame duck session following the midterm elections.

    Table 1. Enactment of the Past 10 Farm Bills

    Enacted during a…Farm Bill (Month Enacted)
    Year Following Presidential Election:1996 Farm Bill (April)
    2008 Farm Bill (June)
    Year Following Presidential Election:1973 Farm Bill (August)
    1977 Farm Bill (September)
    1981 Farm Bill (December)
    1985 Farm Bill (December)
    Midterm Election Year:1990 Farm Bill (November*)
    2002 Farm Bill (May)
    2014 Farm Bill (February)
    2018 Farm Bill (December*)
    Year Following Midterm Election:None
    *Enacted during a lame duck session of Congress.

    While history does not bode well for wrapping up a farm bill this year (i.e., none of the last 10 farm bills were completed immediately prior to or following a presidential election), it’s not out of the realm of possibility. So, what would it take to get it wrapped up? Following are the key issues holding up completion: 

    • Improving the farm safety net. As we’ve said for the last two years – and there seems to be growing agreement on this point – there is no point in doing a farm bill absent improvements to the farm safety net, namely improving the Reference Prices in the Price Loss Coverage (PLC) program and the loss thresholds in the Agriculture Risk Coverage (ARC) program. With that said, there is still disagreement on the extent of the improvements and how to pay for them.
    • Commodity Credit Corporation (CCC). Discretionary use of the CCC has long been a sticking point for lawmakers, but that concern has grown dramatically over the course of the last two Administrations, where the CCC has been used to deliver tens of billions in aid to agricultural producers and, more recently, climate-smart programming. Many in Congress would like to restrict the Secretary’s use of the CCC, returning decisions about funding to Congress. Doing so would save money that could be used to offset improvements to the farm safety net. While we discussed CCC funding in detail last Fall, the Congressional Budget Office (CBO) will officially weigh in on this topic tomorrow when they release the cost estimate for the House Agriculture Committee-passed farm bill. 
    • Inflation Reduction Act (IRA). While there seems to be growing consensus over bringing the IRA conservation funding inside of the farm bill, there are ongoing disagreements about whether that funding should continue to be restricted to climate-smart practices. Some lawmakers would like to put those decisions – like most other conservation decisions – in the hands of local decisionmakers.
    • Thrifty Food Plan (TFP). There is still considerable frustration among most Republican lawmakers over the Biden Administration’s roughly $250 billion unilateral increase to the Supplemental Nutrition Assistance Program (SNAP) via adjustments to the TFP in 2021. Similar to the discussion on the CCC, many lawmakers would like to return decisions about future increases in SNAP spending to Congress.

    While there are certainly disagreements, in our view, the list above is by no means insurmountable. While there is very little legislative runway prior to the election, we do think it’s possible to wrap up the farm bill during the lame duck session, perhaps as part of a supplemental. Why?

    A recent hearing before the House Agriculture Committee highlighted the mounting concerns about financial conditions in the countryside. With sustained high input costs and prices that continue to collapse, growers are facing a precarious situation as they plan for the 2025 crop year. That dynamic – coupled with natural disasters like the wildfires in the Texas panhandle – are triggering alarm bells and resulting in calls for additional disaster assistance.

    Congress has a lot on its plate going into a new Congress. For example, the debt limit – which dominated much of the conversation in the first half of the current Congress – is currently suspended through January 1, 2025. In addition, several major provisions from the Tax Cuts and Jobs Act of 2017 – including several that are important to the agricultural community – are set to expire at the end of next year. Rather than punting the farm bill into the new Congress and relying on another year of disaster assistance, Congress could choose to reauthorize the farm bill in the lame duck session – improving the farm safety net and side-stepping the need for disaster assistance – all the while keeping the farm bill out of what will already be a very crowded legislative calendar in 2025.


    Fischer, Bart L., and Joe Outlaw. “Will We See a New Farm Bill This Year?Southern Ag Today 4(31.4). August 1, 2024. Permalink

  • Digging into Dirt: Southern States Adoption of No-Till and Reduced Tillage Practices 

    Digging into Dirt: Southern States Adoption of No-Till and Reduced Tillage Practices 

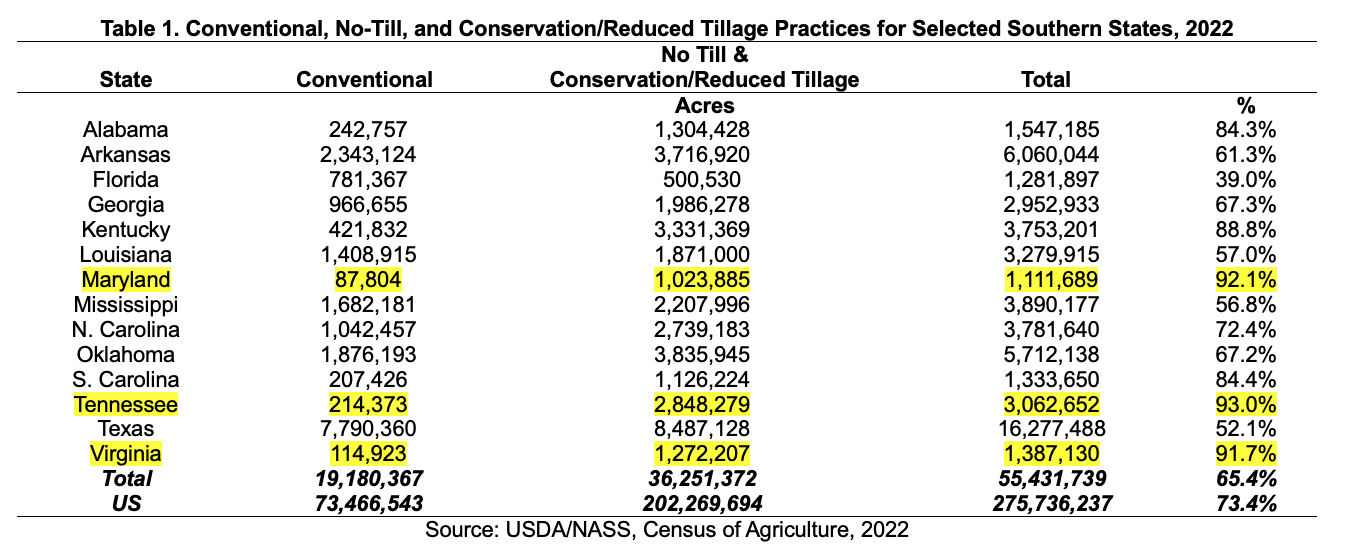
    Based on the USDA’s most recent Census of Agriculture 2022 data for tillage practices, no-till, and conservation/reduced tillage acres comprise 65.4% of the tillage practices for selected southern states (Table 1). For the US, the no-till and conservation/reduced tillage rate is 73.4%. No-till is defined as leaving 50% or more of the soil surface undisturbed from harvest to planting. Whereas conservation and reduced tillage is defined as leaving 30% or more surface undisturbed and may involve chisel plows or light disking (Rust and Williams, 2010). As of 2022, three southern states have the highest rate of no-till and conservation/reduced tillage in the U.S.: Tennessee (93%), Maryland (92.1%), and Virginia (91.7%). The three southern states with the smallest adoption of no-till and conservation/ reduced tillage practices compared to all tillage practices were Florida (39%), Texas (52.1%), and Mississippi (56.8%).

    Of interest would be the comparison of southern state’s adoption of these tillage practices over time, which are indicated in Figure 1. The figure displays the percentage change in no-till and conservation/reduced tillage acres at the county level from 2017 to 2022. Green shades indicate percentage decreases in these tillage practices whereas blue shades indicate an increase percentage wise.

    Figure 1. 2017 to 2022 Percentage Change in No-Till and Reduced/Conservation Tillage Acres

    Source: USDA/NASS Census of Agriculture, 2022

    The five southern states with the highest increase in acreage of cropland using no-till plus conservation/reduced tillage practices from 2017 to 2022 are Arkansas (17.6%), followed by Florida (15.3%), Texas (15.1%), Georgia (10.8%), and Alabama (10.7%). The states with the largest average increase in these tillage practices for the three census periods (2012, 2017, and 2022) were Florida (29.3%), Mississippi (20.6%), Arkansas (20.2%), Texas (17.1%), and Louisiana (16.4%).

    This information helps us understand which regions within the South are adopting reduced and no-till practices and is also relevant as carbon markets expand.  These practices can improve soil health by preserving soil structure, increasing water retention and organic matter. Additionally, they reduce soil erosion and lower greenhouse gas emissions by minimizing soil disturbance. However, given the cropping system, adopting no-till or reduced till may not make sense (e.g., peanut and rice production). Most importantly, the impact and profitability of no-till and reduced-till practices varies depending on the regions and crops involved, influencing adoption rates.

    Reference

    Rust, B. & J. Williams. 2010. USDA/ARS. “How Tillage Affects Soil Erosion and Runoff.” USDA/ARS Available at https://www.ars.usda.gov/ARSUserFiles/20740000/PublicResources/How%20Tillage% 20Affects%20Soil%20Erosion%20and%20Runoff.pdf.


    Menard, R. Jamey, and Hence Duncan. “Digging into Dirt: Southern States Adoption of No-Till and Reduced Tillage Practices.Southern Ag Today 4(31.3). July 31, 2024. Permalink

  • Cattle and Drought in the South and Southeast 

    Cattle and Drought in the South and Southeast 

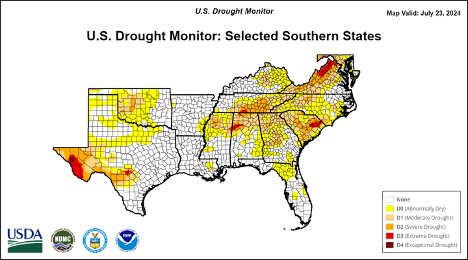
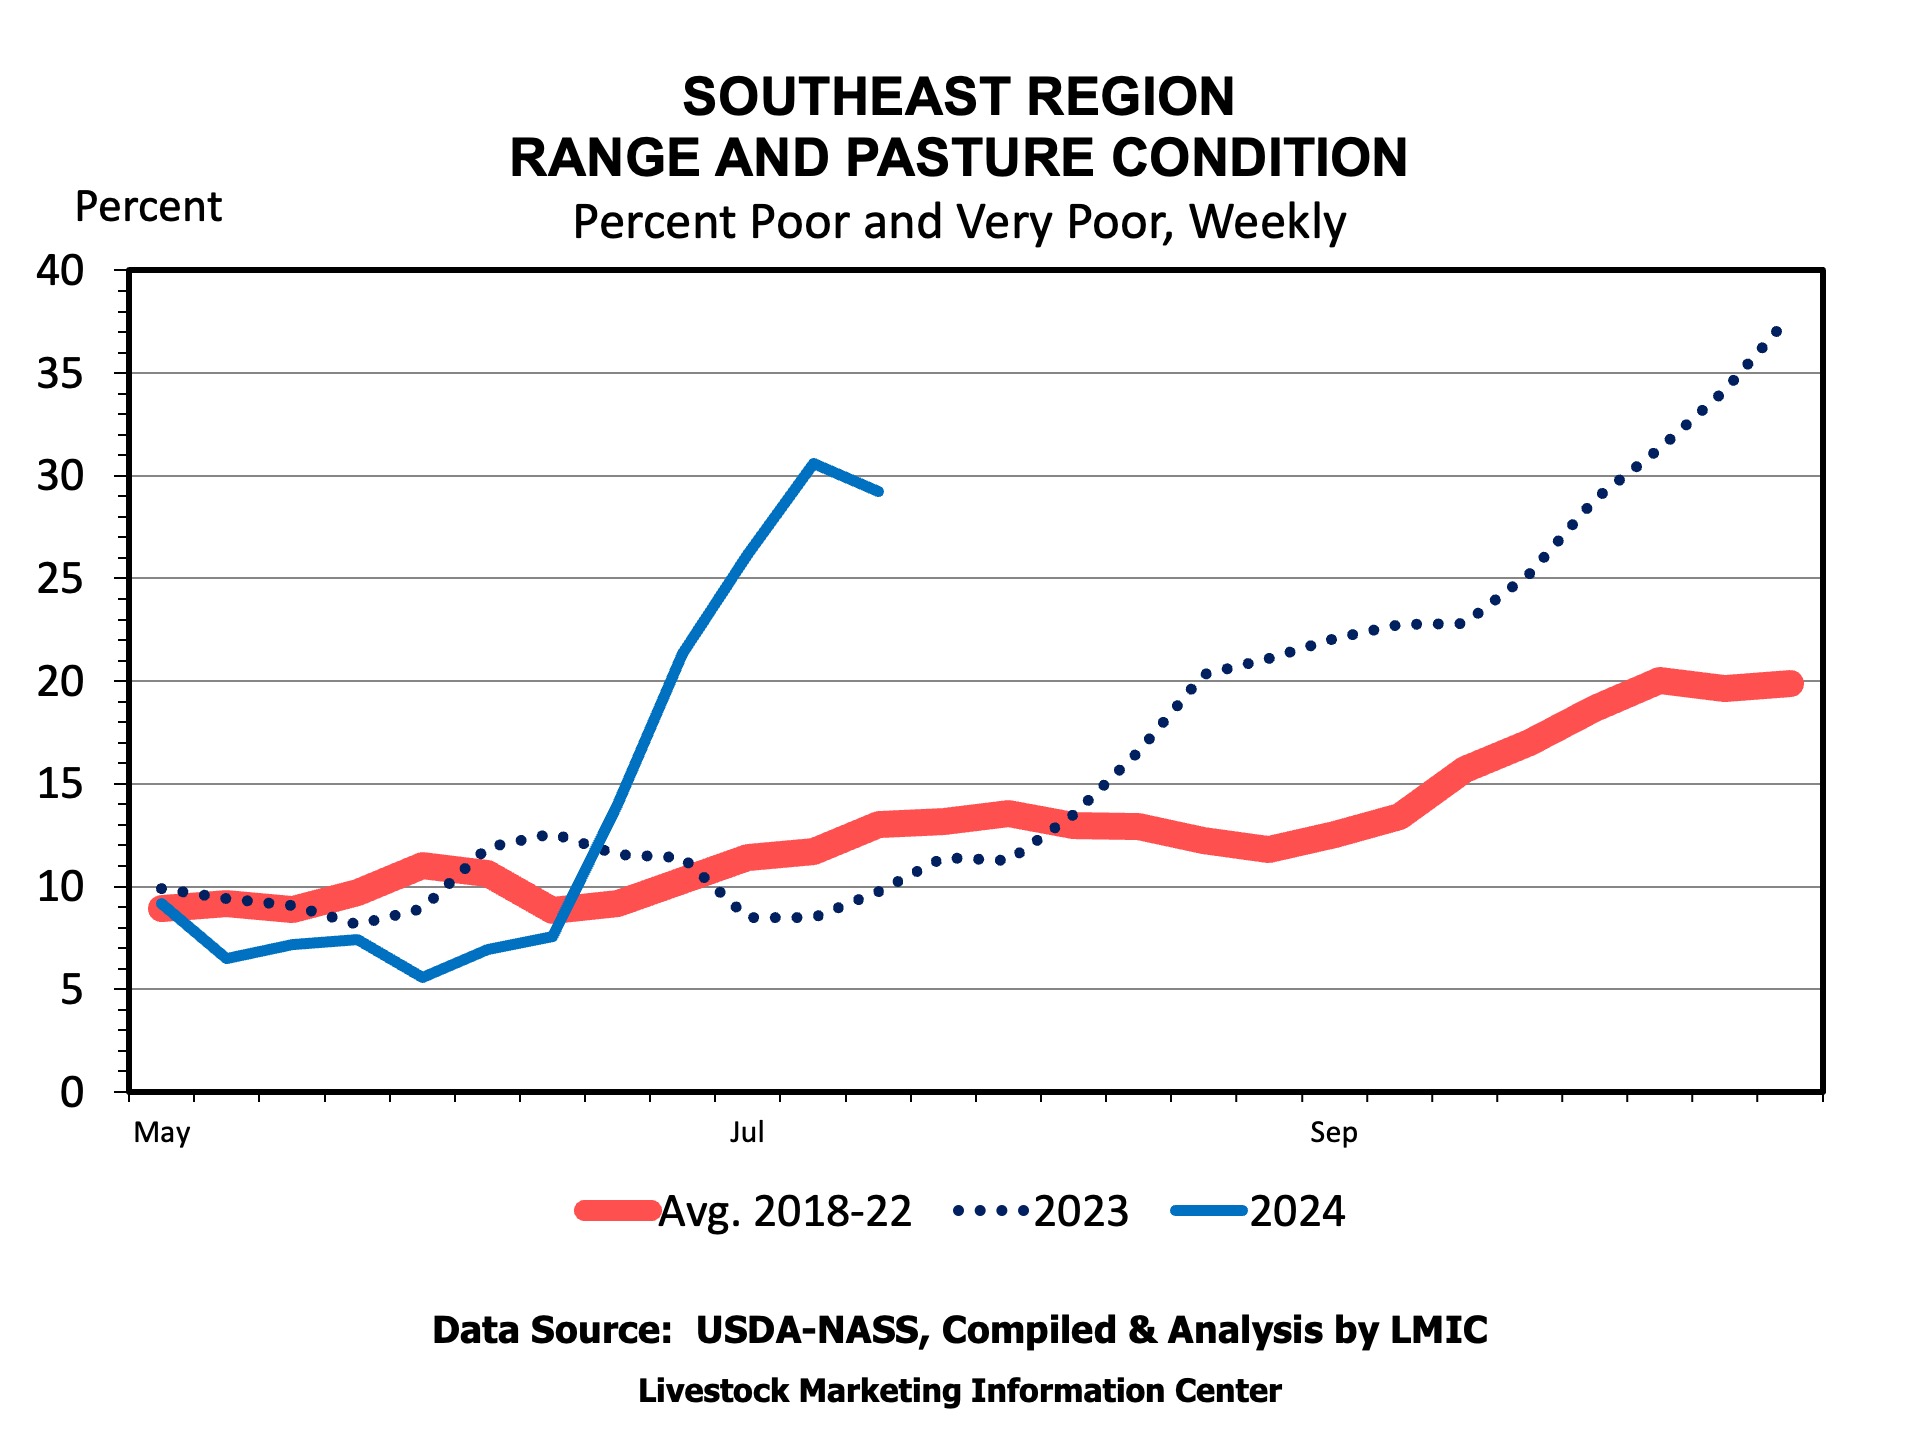
    Drought gripped the Southeast U.S. starting in June and has continued into July. More than 60 percent of the Southeast (AL, FL, GA, NC, SC, and VA) is experiencing drought. These drought conditions have hurt pasture and rangeland conditions in the Southeast. According to the USDA in mid-July, about 30 percent of the pasture in the Southeast (AL, AR, FL, GA, KY, LA, MS, NC, SC, TN, VA, WV) are in poor or very poor condition. Some drought conditions persist in other areas of the South, as well, including approximately half of Texas, 60 percent of Oklahoma, and 70 percent of Tennessee.

    Figure 1: Drought Conditions in the South

    Source: UNL Drought Monitor

    Should these drought conditions persist, producers will have several decisions to make related to feeding alternatives, forage management, marketing, and other areas. These decisions have implications for a host of different producer outcomes. Economics calls on producers to assess each decision along the following lines: How do revenues and costs change with each decision? This is the essence of a partial budget. A partial budget assesses the change in revenue and the change in costs associated with a change in practice. If changing practices increases net returns, you should change your practice. If not, continue with your baseline practice.Drought creates some uncertainty to the price outlook for this fall. If drought incentivizes producers to bring more calves to market compared to normal, while still remaining high compared to recent history, calf prices may see a more pronounced seasonal dip this fall. 

    Drought creates some uncertainty to the price outlook for this fall. If drought incentivizes producers to bring more calves to market compared to normal, while still remaining high compared to recent history, calf prices may see a more pronounced seasonal dip this fall. Timing may play a role, too. If calves are sold early, the fall low may be more spread out over time and not as deep. Lastly, if the weather improves, any expectations of more cattle this fall may evaporate pushing prices higher than expected. The next several weeks will be important in assessing where cattle markets will be in the months ahead.


    Secor, William. “Cattle and Drought in the South and Southeast.Southern Ag Today 4(31.2). July 30, 2024. Permalink

  • Review of 2023 STAX Payments and Implications for Price Risk Management in Cotton

    Review of 2023 STAX Payments and Implications for Price Risk Management in Cotton

    The USDA Risk Management Agency (RMA) published final 2023 county yields for upland cotton on July 3, 2024.  Upland cotton producers who purchased 2023 crop year Stacked Income Protection Plan (STAX) policies are now receiving final indemnity payments, thus contributing to current cash flow.  Based on RMA’s Summary of Business reporting as of July 15, total STAX indemnities across all states for 2023 will slightly exceed $352.7 million dollars.

    STAX is a crop insurance product for upland cotton that provides coverage for a portion of the expected revenue in an area. Most often, the “area” will be a specific county, but may include other counties or production practices as necessary to obtain a credible amount of data to establish an expected yield and premium rate. STAX coverage is available in all counties where crop insurance for upland cotton is currently offered.

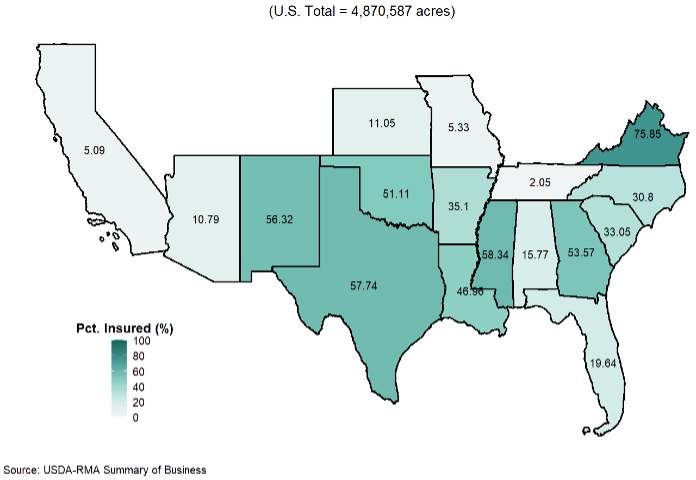
    According to USDA-RMA data, 4.87 million acres of upland cotton were insured under STAX in 2023 (Figure 1).  This was 48 percent of nearly 10.1 million planted acres.  In the majority of cotton producing states, STAX participation is much lower than 48 percent.  The high concentration of U.S. cotton acreage in Texas inflates the level of total participation in the STAX program.  On a regional basis, the Southwest (Kansas, Oklahoma, and Texas) accounted for 70 percent of the total acres enrolled in STAX last year.  This region also has the largest concentration of upland cotton acreage in the U.S at almost 6.1 million acres.  Texas alone planted over one-half or 5.55 million acres of the U.S. upland cotton total in 2023. Furthermore, Texas accounted for 66 percent, or 3.2 million of the 4.87 million total acres insured under STAX. 

    Figure 1. State-Level Percentage of Upland Cotton Planted Acres Enrolled in STAX (2023)

    STAX pays a loss on an area-wide basis, and an indemnity is triggered when there is an area loss in gross revenue. Gross revenue is a function of both yield and price.  Common to many crop insurance products, STAX utilizes a futures price (i.e. December cotton futures) to determine the Projected and Harvest prices used to calculate indemnity payments.  For most states in 2023, revenue losses resulted solely from below-average yields, which means that Projected and Harvest prices in those states were either the same or Harvest prices were higher than Projected prices.  

    The state level price discovery periods and the 2023 Projected and Harvest prices for cotton are summarized in Table 1.  Only Kansas, New Mexico and Oklahoma had a lower Harvest Price that may have contributed to revenue losses. Thus, for fourteen (14) of the seventeen (17) cotton producing states, any STAX payments were the result of actual yields being at least 10 percent less than the expected county/area yield (assuming the 90 percent area loss trigger was selected).

    Table 1. State Level Crop Insurance Price Discovery Periods for Cotton.

    State(s)Projected Price Discovery PeriodHarvest Price Discovery Period2023 Projected Price/lb2023 Harvest Price/lb
    Southern TX12/15 – 1/149/1 – 9/31$0.81$0.87
    AL, AZ, AR, CA, FL, GA, LA, MS, NC, SC, central TX1/15 – 2/1410/1 – 10/31$0.85$0.85
    MO, northern TX, TN, VA2/1 – 2/2810/1 – 10/31$0.84$0.85
    KS, NM, OK2/1 – 2/2811/1 – 11/30$0.84$0.78
    Source: USDA, Risk Management Agency

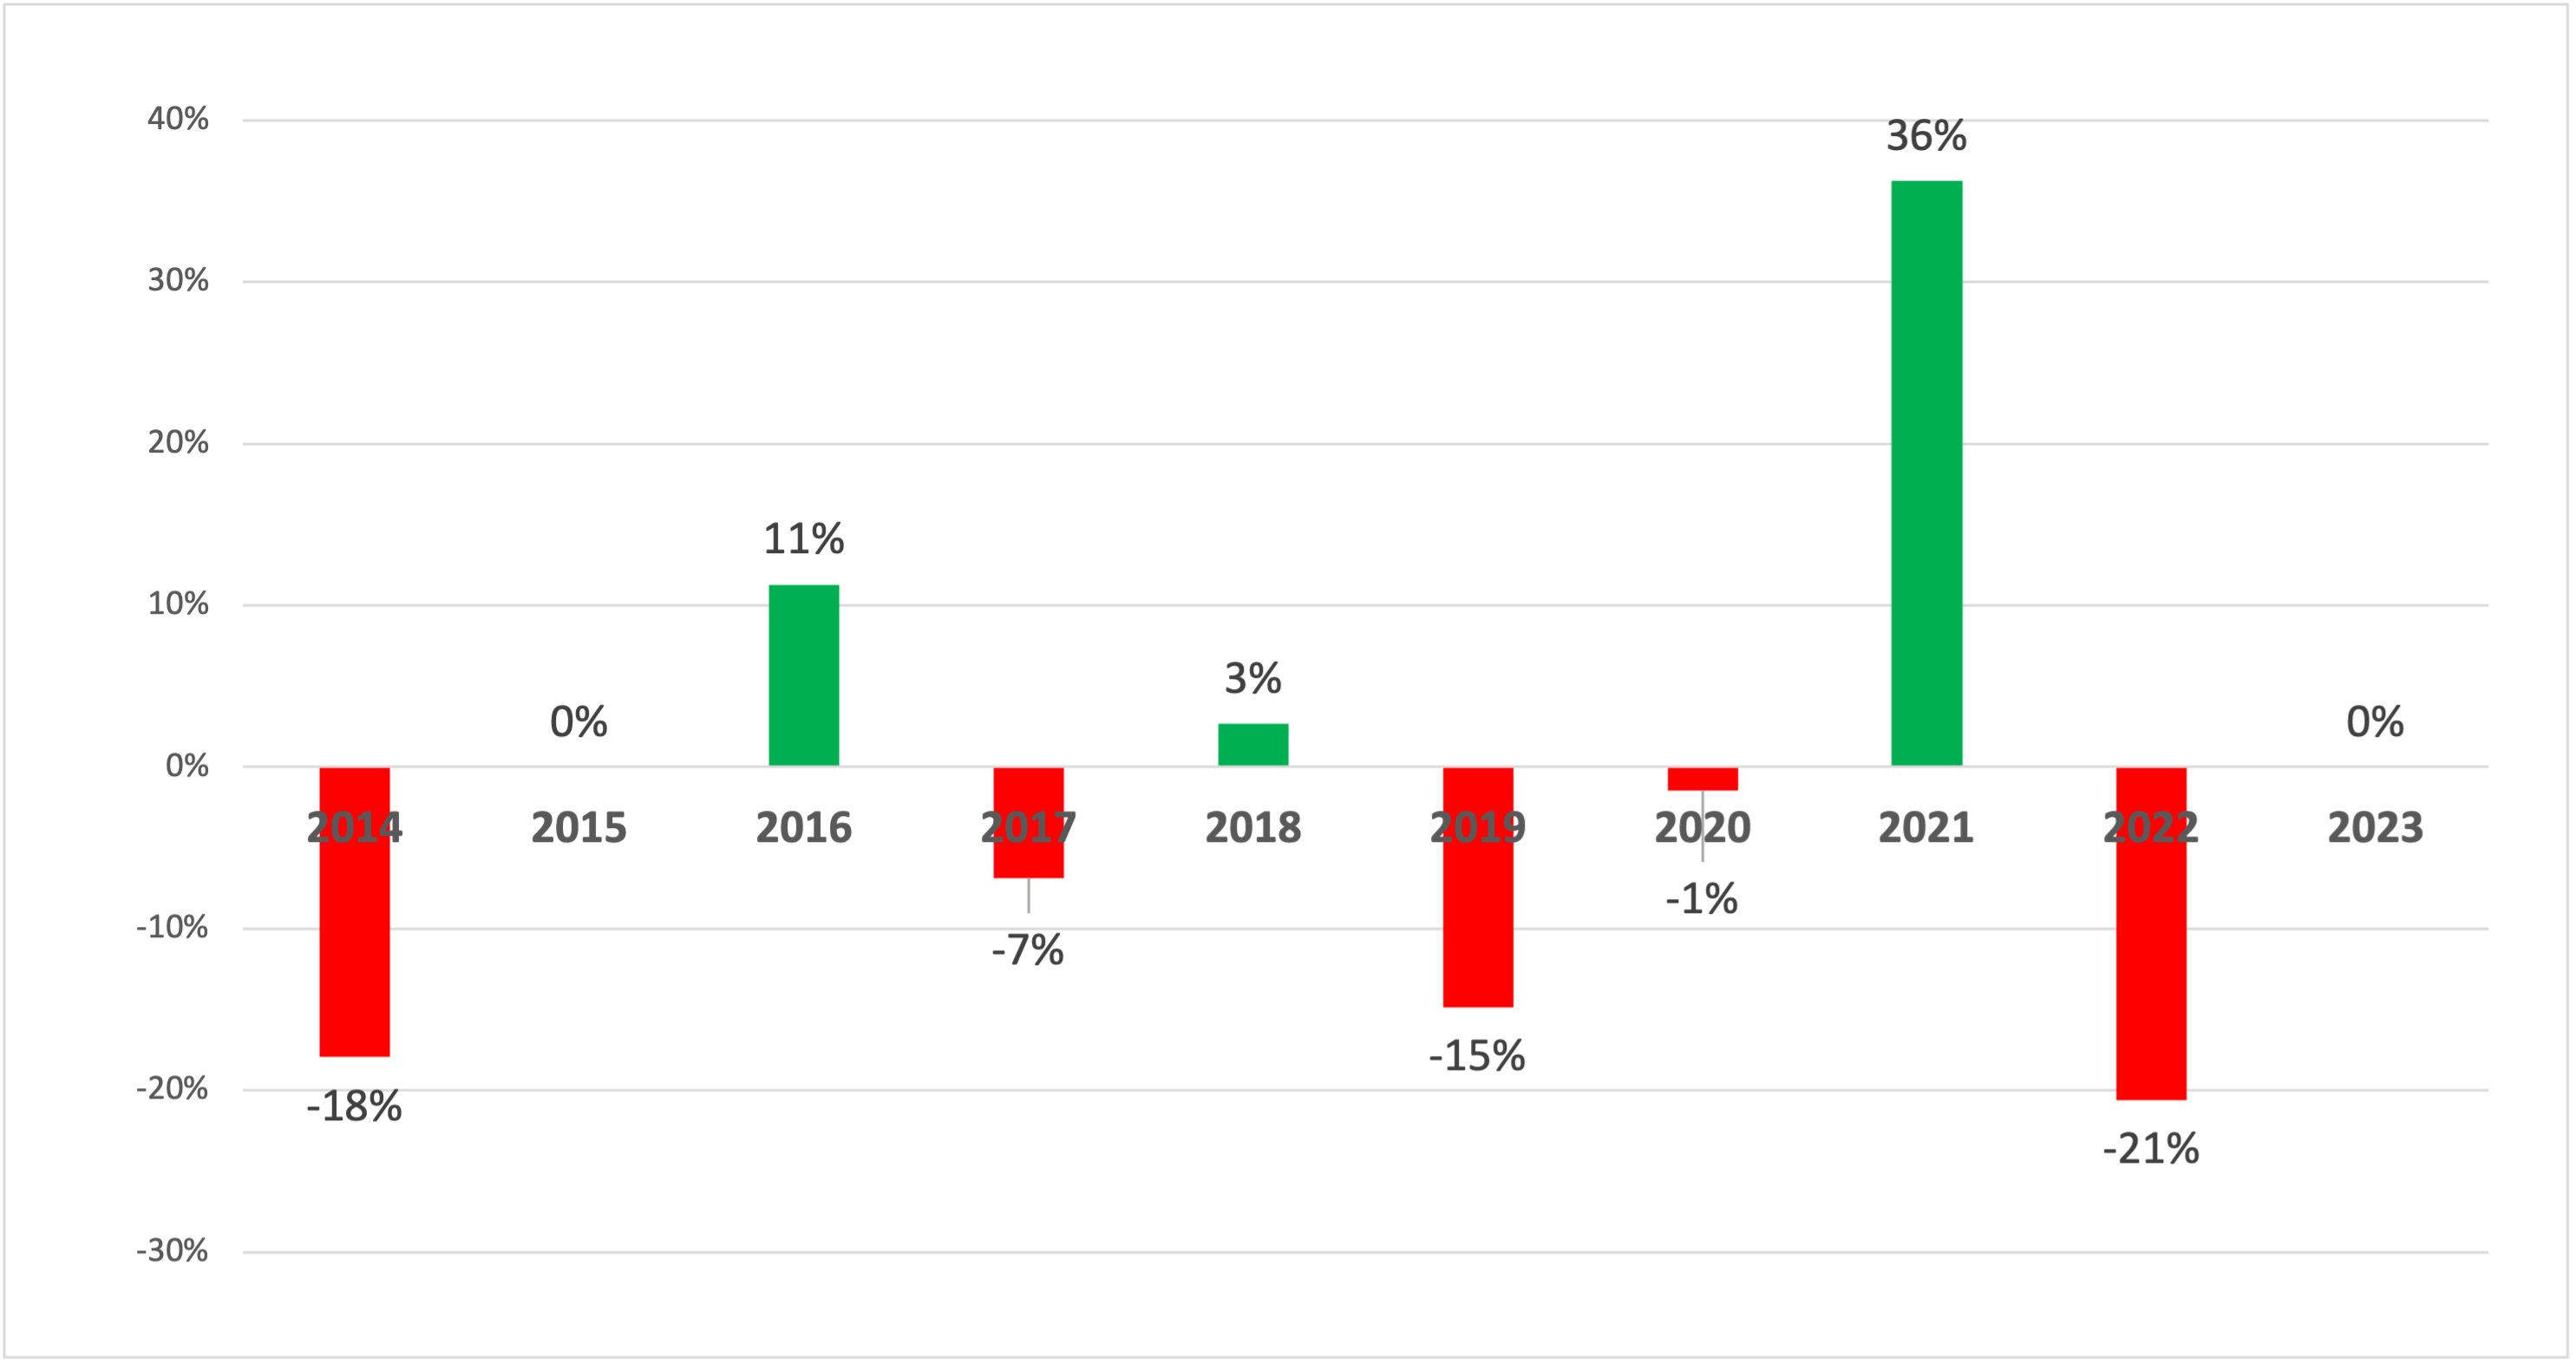
    Since the inception of the STAX program ten years ago, in response to the provisions in the 2014 Farm Bill, some consideration can be given to how effective the product is as a price risk management tool.  Although coverage levels can vary, the majority of STAX policies in the U.S. would see indemnities begin when area revenue falls below 90% of its expected level.  In selecting a crop insurance product, growers may consider the likelihood of a STAX revenue loss being generated solely by declining prices.  Figure 2 illustrates that over the past decade Harvest Prices relative to Projected Prices have experienced a 10 percent or greater decline in three crop years in the period 2014 to 2023, with an average change of -1.2%. Thus, similar to 2023, STAX most often protects against either only yield effects or a combined yield and price effect.  

    Figure 2. Percent Price Change from Projected to Harvest Price*, December Cotton Futures (2014 – 2023)

    Source: USDA, Risk Management Agency.
    *Price discovery periods for: AL, AZ, AR, CA, FL, GA, LA, MS, NC, SC, central TX.

    References

    USDA-RMA (2024, July). USDA Risk Management Agency Summary of Business. 

    URL: https://www.rma.usda.gov/SummaryOfBusiness.

    USDA-RMA (2024, July). USDA National Agricultural Statistics Service QuickStats. 

    URL: https://quickstats.nass.usda.gov/.


    Stiles, H. Scott, and Hunter D.Biram. “Review of 2023 STAX Payments and Implications for Price Risk Management in Cotton.Southern Ag Today 4(31.1). July 29, 2024. Permalink