Blog

  • The Chicken or The Egg…. Productivity in 2026  

    The Chicken or The Egg…. Productivity in 2026  

    This is not a question of which came first, we all know the answer to that. But, as was discussed in an earlier SAT for cattle, hogs and lambs, this is a question of productivity for the chicken and egg segments of the U.S. poultry market this coming year. (A turkey outlook previously discussed here)  

    Chicken

    Broiler production increased by 846 million pounds in 2024 over 2023, a 1.4 percent increase (Fig. 1).  Increased production came from two sources: more birds and more pounds per bird. On the bird side, 93 million more broilers were produced, a 1 percent increase. As has happened in 5 of the last 6 years, increased chicken production also came from producing a heavier bird, on average, 6.55 lbs. in 2024 vs. 6.52 lbs. in 2023. 

    Production increases have been supported by profitable prices and falling feed costs. Broiler demand has likely benefited from increasing prices for beef and pork. So far in 2025, the increased productivity trend continues with the weekly average production maintaining about a 30-million-pound lead on historical weekly production back to 2019 and staying slightly above 2024 production. Though chick livability declined again in 2024, the lost birds were offset by placing more chicks overall (Fig. 2). 

    One important question for broiler productivity is if the chicken industry can continue to boost the supply of additional chicks for broilers. This problem goes all the way back to the supply of broiler type pullets. These are the pullets that become laying hens that supply broiler chicks. The broiler hatchery supply flock had seen a steady increase since 2012. But, beginning in 2023, the supply flock began decreasing steadily, with only a slight reprieve being projected (Fig. 3). Just like fewer cows equals fewer feeder calves, fewer breeder hens equal fewer broiler chicks. This supply crunch may start hitting broiler production as early as Q1 2026.

    Eggs

    The same old scourge the industry has been fighting since February 2022 continues to haunt table egg supply – Highly Pathogenic Avian Influenza (HPAI). Since this outbreak began in 2022, 127 million laying hens have been lost. As outbreaks continue, new hens entering production must make up for lost birds and normal turnover.  While HPAI has sharply reduced the number of table egg layers since 2022, a longer term look at supplies reveals that the number of table eggs produced has been falling since 2019 (Fig. 4). Egg prices hit all-time highs in late 2022 and again in early 2025. But, during the interim period, prices were relatively stable. Price volatility seems to be mostly due to short-term supply challenges.  

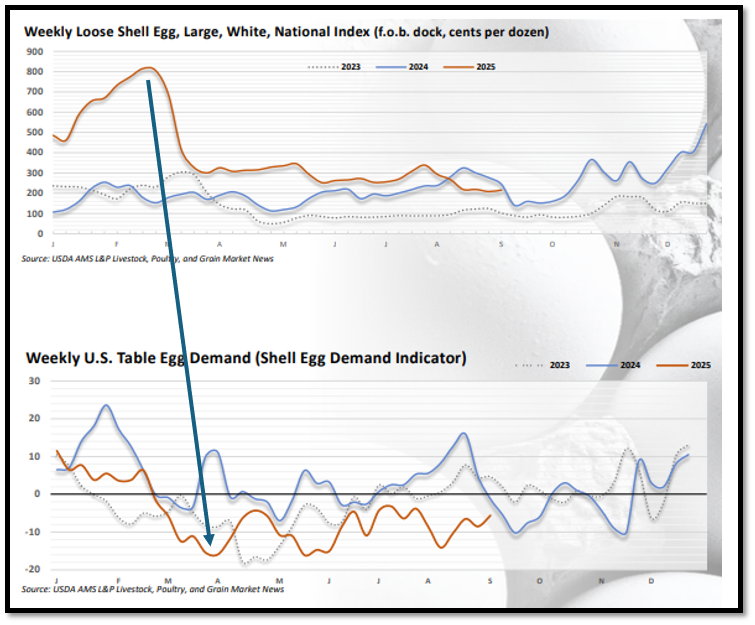
    Total per capita egg consumption is down from 286 eggs in 2020 to 271 in 2024 (egg-news.com sourced). While consumption tends to equal production (e.g., we eat all we produce), the question remains whether people are eating fewer eggs in general, or if consumption is down because of price and supply dynamics?  The sharp price spike in 2025 was followed by a marked decrease in egg demand (Fig. 5), which suggests price as a primary driver. But since then, prices have moderated, and demand hasn’t seemed to have rebounded much, which suggests this is more than just a price story. Interest in production and productivity is likely to remain important as HPAI occurrences are ramping up as Fall begins and wild bird migrations resume their normal patterns.

    Fig. 1: Broiler production (chicken) in the us has been on a slower year over year increase in pounds for many years. Over the last 6 years, pounds of chicken produced have increased 5%. 1.4% in ’23 to ’24 alone, with 2025 projected to be another slight increase.
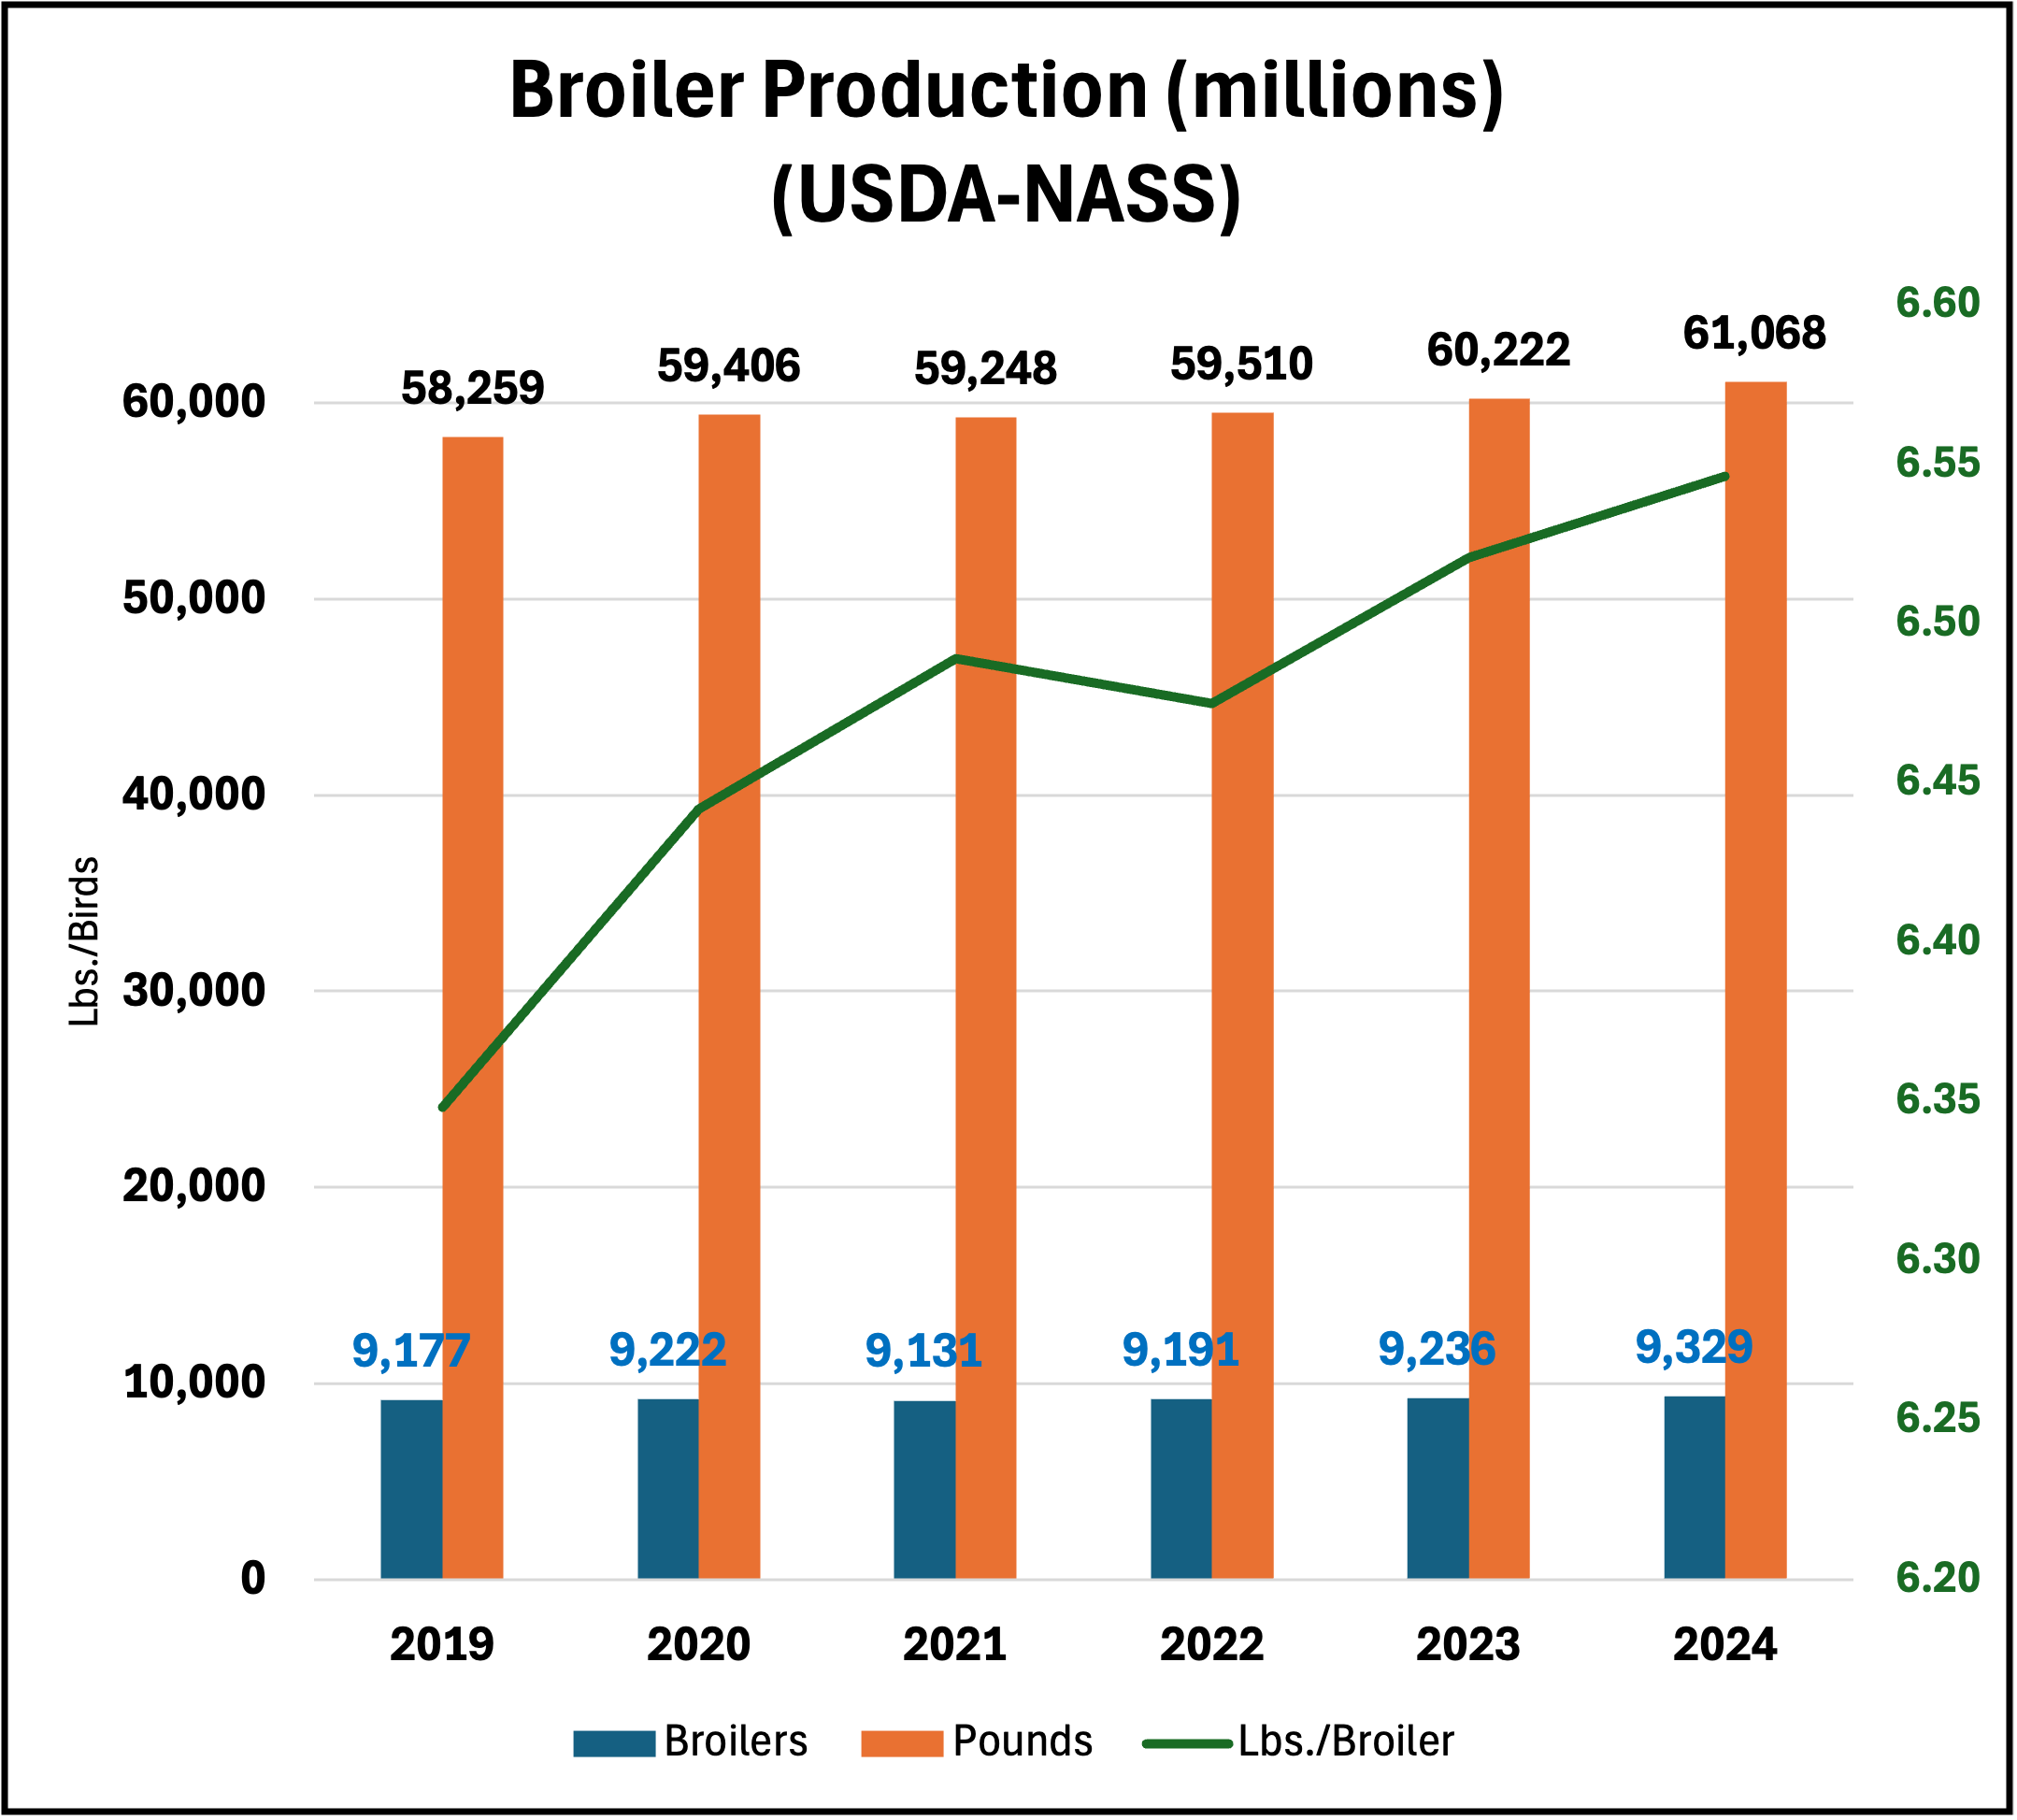
    Fig. 2: Increased placements of broiler chicks has overcome an increase in mortality to maintain increasing production of chicken meat. 
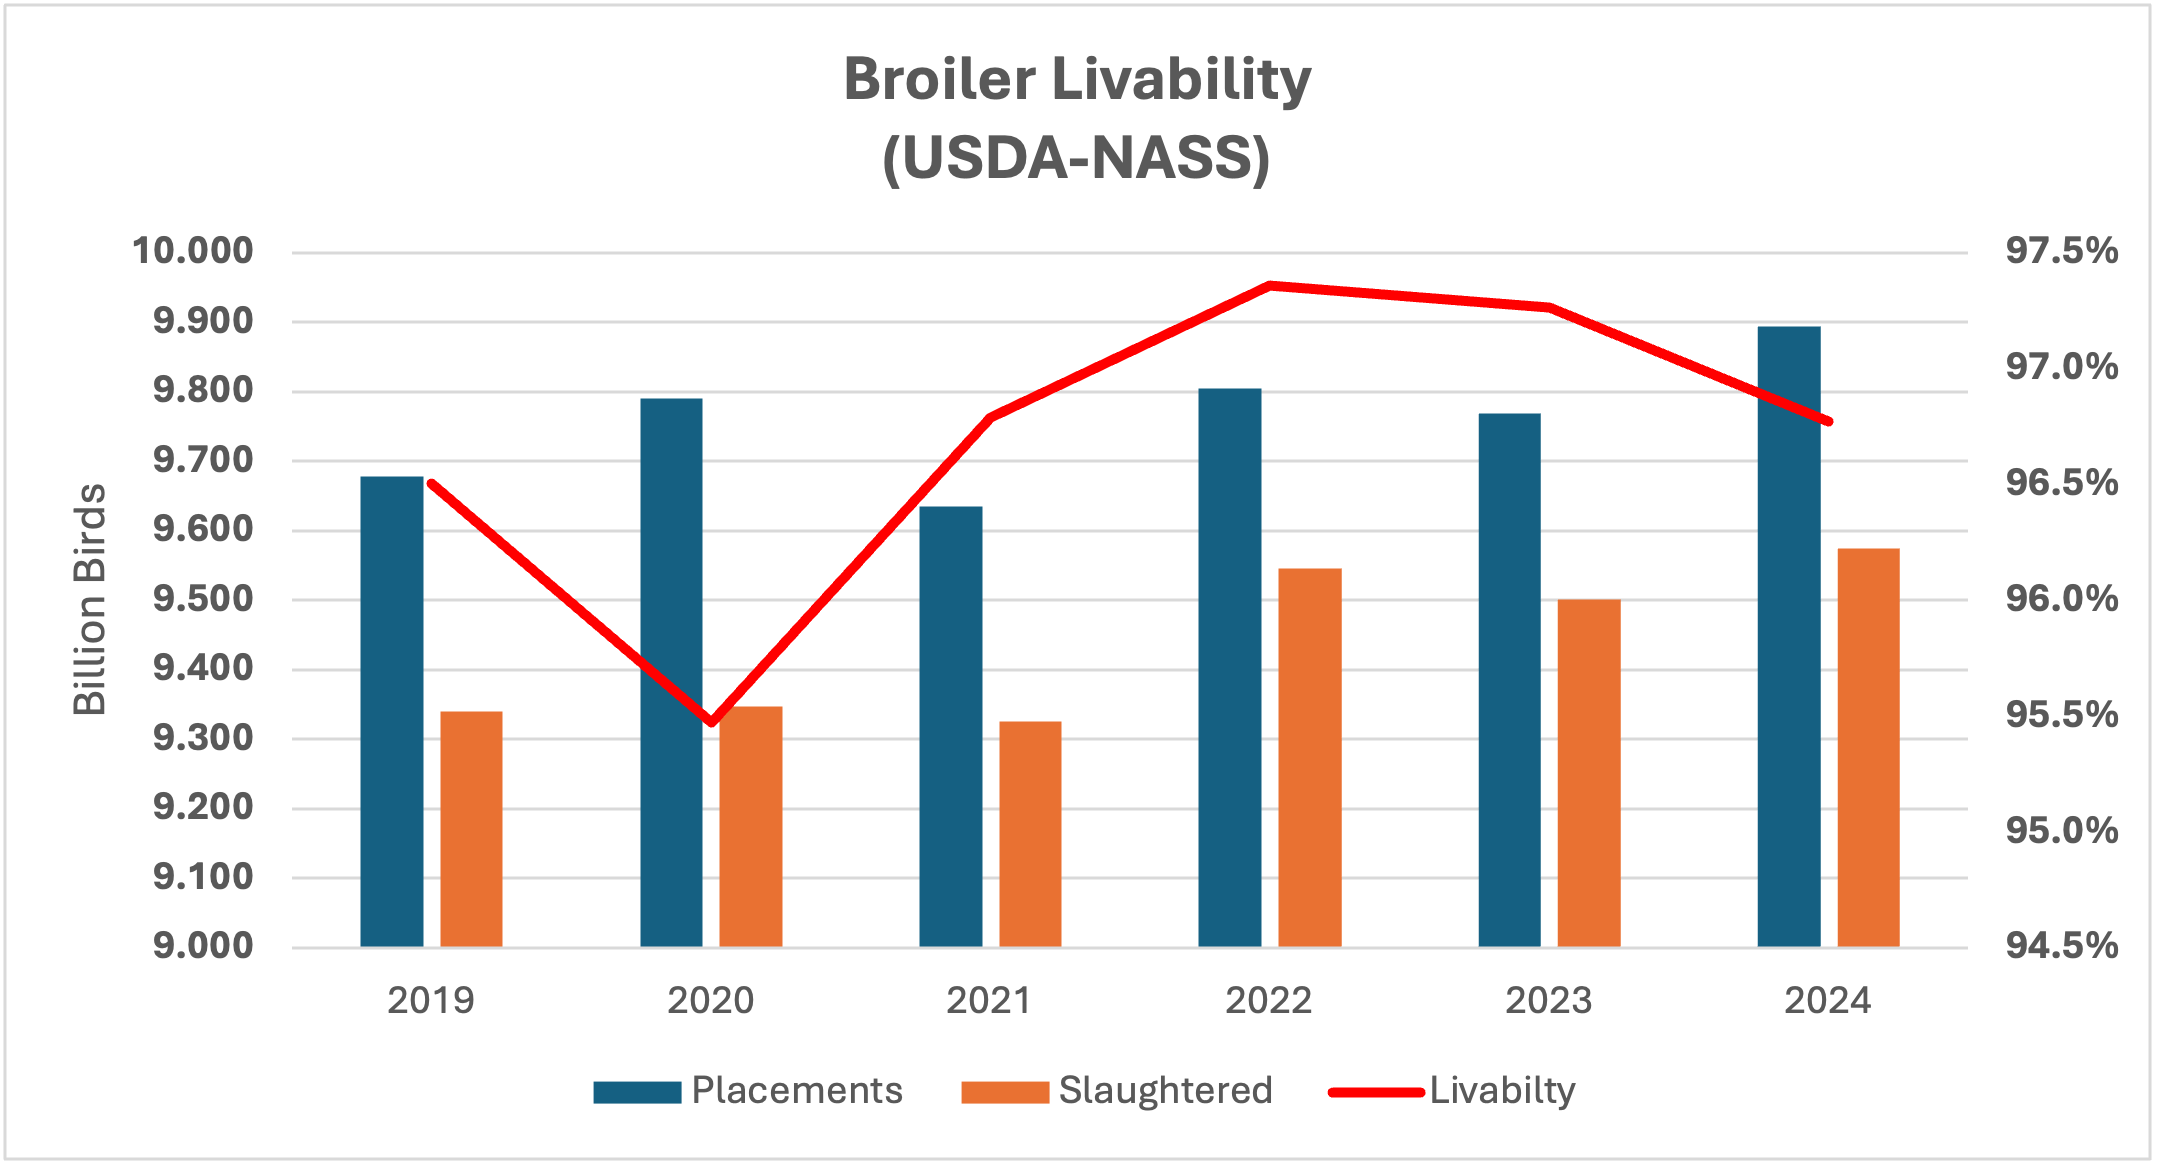
    Fig. 3: Broiler laying hen supply has been decreasing the past several years, possibly stressing the future supply chain broiler chicks. 
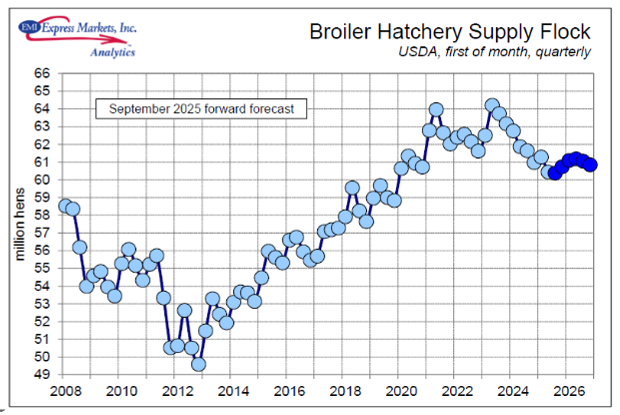
    Fig. 4: Total Table Eggs being produced has been decreasing since 2019, as well as the number of eggs consumed per person annually. (USDA-NASS)
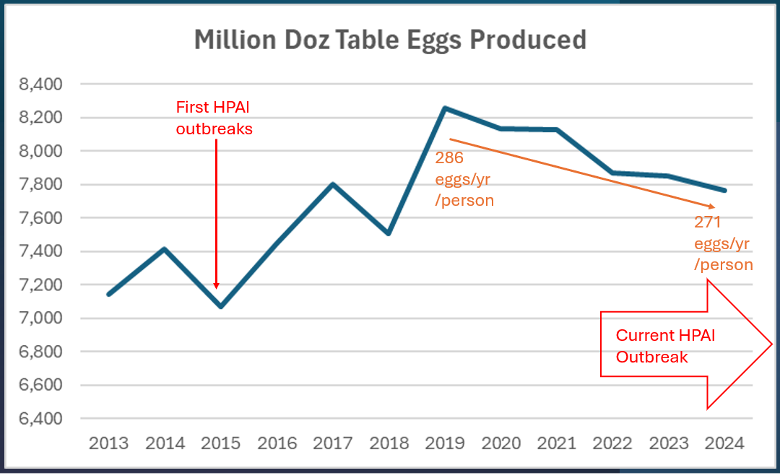
    Fig. 5: Egg prices can cause noticeable reactions to egg demand, especially when those prices are extremely high, as in early 2025.

    Brothers, Dennis. “The Chicken or The Egg…. Productivity in 2026.” Southern Ag Today 5(40.2). September 30, 2025. Permalink

  • The H-2B Visa Program and the Food Sector

    The H-2B Visa Program and the Food Sector

    Declining labor availability has been affecting the agricultural sector for many decades. Limited interest in physically demanding jobs by domestic workers, as well as a reduction in the supply of undocumented farmworkers, have been some of the major reasons behind this pattern (Gutierrez-Li, 2025). As a result, demand for foreign workers coming under H-2A visas to perform manual tasks in agriculture has risen steadily for more than a decade (Gutierrez-Li, 2021 and 2024), making the program very popular among growers of labor-intensive crops. A lesser-known non-immigrant visa program, the H-2B, has been a lifeline for many employers associated with food production in the United States.

    The H-2B program originates from the Immigration and Nationality Act of 1952, when the H-2 visa category for manual labor foreign workers was created (Gutierrez-Li, 2024). In 1986, the Immigration Reform and Control Act divided the program into two subcategories: H-2A for agricultural workers and H-2B for non-agricultural work. Both allow workers from a list of countries to come for a season (of less than one year), but with the possibility of holding the same visa for up to three years in a row. The H-2B program covers a variety of industries, including resort and hospitality services, retail sales, landscaping, groundskeeping, food processing, and construction. Employers interested in hiring either type of worker need to convince the government that they cannot find enough American laborers able, willing, qualified, and available to do the temporary tasks they need. Furthermore, both programs require employers to cover transportation from and to the country of origin of workers, but only the H-2A program mandates employers to pay for housing costs.

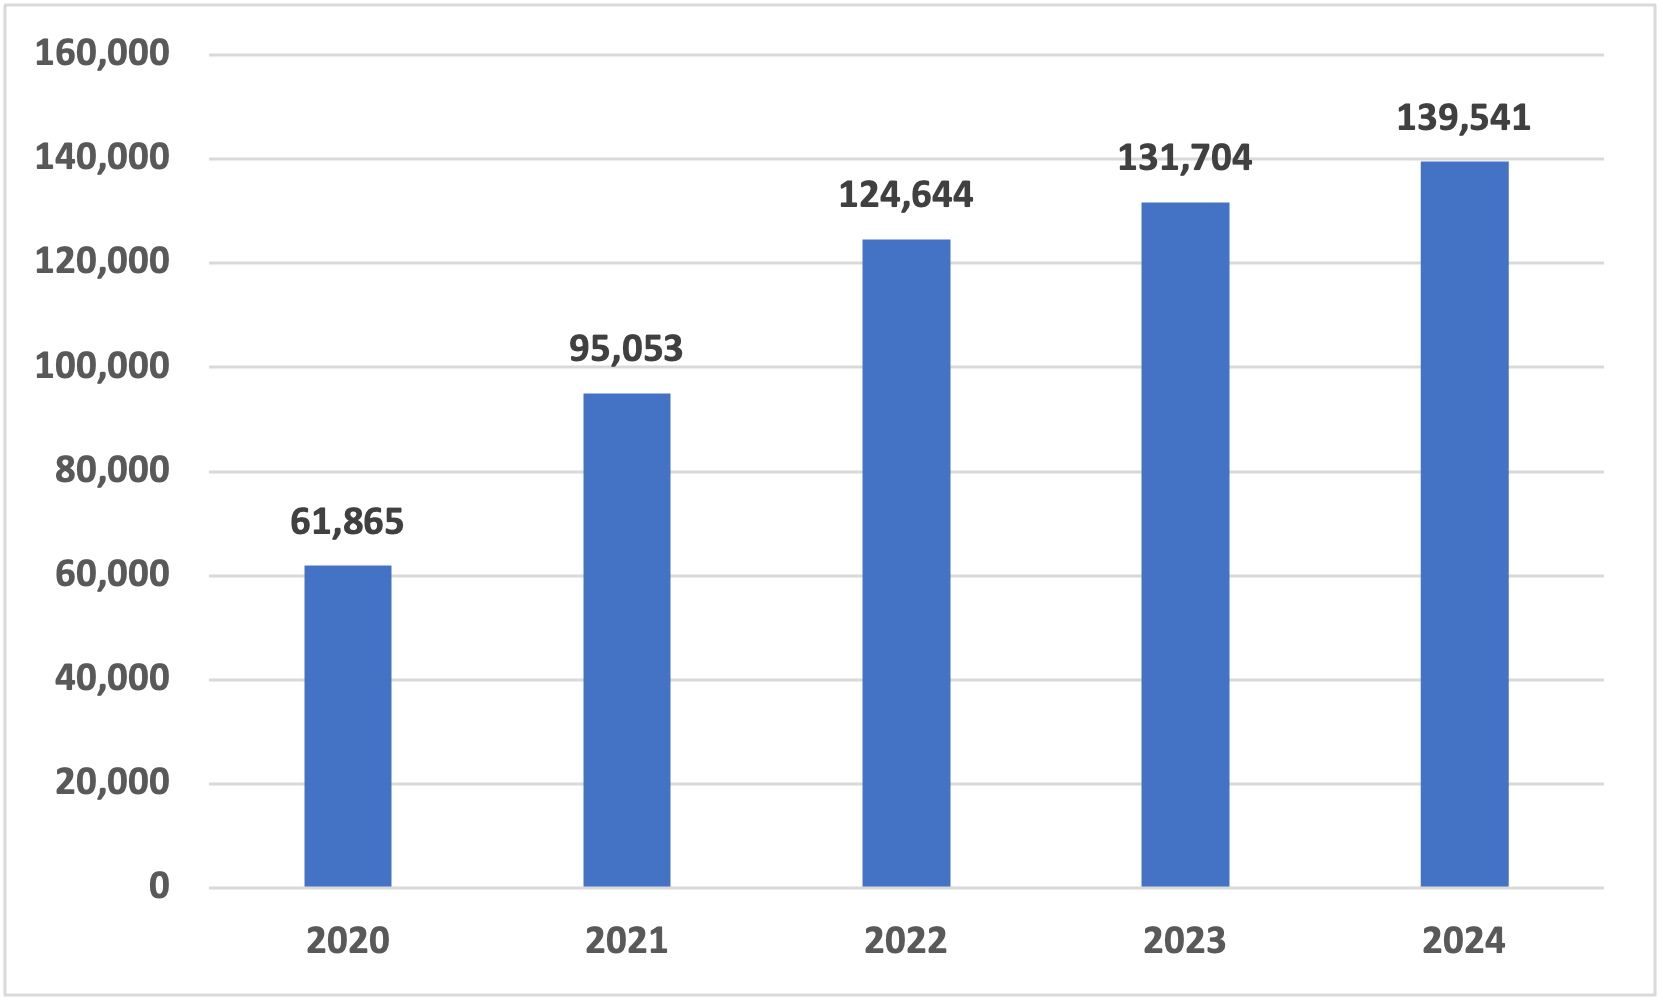
    The determination of yearly wages is not the same for H-2A and H-2B workers. In the case of the former, employers generally pay the adverse effect wage rate. In the case of H-2B workers, they must be paid the prevailing wage rate, defined as “the average wage paid to similarly employed workers in a specific occupation in the area of intended employment” (Department of Labor, 2025). Another important difference between the H-2A and the H-2B programs is that the latter has an annual cap on the number of visas set by Congress, currently at 66,000. The cap is split into two halves. The first 33,000 visas are made available from October 1 to March 31. The second batch runs from April 1 to September 30. However, as shown in Figure 1, the number of H-2B visas issued by the government has increased substantially in the last five years, despite the existing annual cap. This increase is explained by two factors. First, fish roe processors or technicians, their supervisors, and workers in the Commonwealth of the Northern Mariana Islands or Guam are exempted from the cap until December 31, 2029. Second, the Executive branch, through the Department of Homeland Security, has the authority to issue more visas beyond the annual cap just for that year, both for returning and new workers.

    Figure 1. H-2B Visas Issued in Figure 1. H-2B Visas Issued During Period 2020-2024

    Source: United States Department of State

    Among the top employers of H-2B workers in 2024 were companies related to tree services (like pruning) or nurseries, landscaping, construction work, and seafood production (Table 1). H-2B workers were found performing tasks directly related to the food sector, like cutting meat, poultry, and fish, working as waiters and waitresses in restaurants, and even as cooks. Individuals working in landscaping and groundskeeping tasks could indirectly be contributing to the agricultural sector if their employers produce fresh produce or other food-related commodities.

    Table 1. Top 10 Employers of H-2B Workers in 2024

    Employer Workers Approved
    ABC PROFESSIONAL TREE SERVICES INC1,934
    PHC CORPORATION1,772
    PROGRESSIVE SOLUTIONS LLC1,703
    ROTOLO CONSULTANTS INC1,382
    BRIGHTVIEW LANDSCAPE SERVICES INC1,293
    THE BRICKMAN GROUP LTD LLC1,207
    CORE TECH CONSTRUCTION CORPORATION1,111
    STRONGWOOD FORESTRY INC1,022
    ALPHA SERVICES LLC951
    WESTWARD SEAFOODS INC922
    Source: United States Citizenship and Immigration Services

    Agricultural operations are becoming more complex as rising production costs have led to an increase in the relative number of medium-to-large-sized operators and a reduction in the number of small farms. To stay afloat, larger producers have diversified their businesses to multiple crops and invested in value-added commodities. This trend has resulted in a growing number of companies hiring both H-2A workers (for tasks like harvesting) and H-2B workers for packing, expanding/constructing new facilities, and groundskeeping. Likewise, an increase in demand for housing and eating out has led to the need for more H-2B workers. As such, interest in the program is likely to continue growing. Streamlining the application process, as well as raising (or eliminating) the yearly cap on the number of workers allowed in might be necessary to ensure that the needs of producers are met. Otherwise, given that the H-2B program covers a variety of industries, real estate developers, restaurant owners, and farmers will continue to compete for a limited number of workers, potentially leading to inflationary pressures.


    References

    Gutierrez-Li, A. (2021). The H-2A visa program: Addressing Farm Labor Scarcity in North

    Carolina. NC State Economist. North Carolina State University.

    Gutiérrez-Li, A. 2024. Feeding America: How Immigrants Sustain US Agriculture. Baker

    Institute for Public Policy at Rice University. Center for the U.S. and Mexico.

    Gutiérrez-Li, A. 2025. The Unseen Workforce: How Immigration Enforcement Could Shake the U.S. Economy. Choices 40(3).

    United States Department of Labor (2025). Prevailing Wage Information and Resources. Accessed online in September 2025 at https://www.dol.gov/agencies/eta/foreign-labor/wages

    United States Department of State. (2025). Nonimmigrant Visa Statistics. Accessed online in September 2025 at https://travel.state.gov/content/travel/en/legal/visa-law0/visa-statistics/nonimmigrant-visa-statistics.html

    United States Citizenship and Immigration Services. (2025). H-2B Employer Data Hub. Accessed online in September 2025 at https://www.uscis.gov/tools/reports-and-studies/h-2b-employer-data-hub


    Gutierrez-Li, Alejandro. “The H-2B Visa Program and the Food Sector.” Southern Ag Today 5(40.1). September 29, 2025. Permalink

  • Latest Proposed Dicamba Labels Move to Temperature-Based Cutoffs

    Latest Proposed Dicamba Labels Move to Temperature-Based Cutoffs

    On July 23, 2025, the EPA opened the public comment period for the proposed registrations of three over-the-top (OTT, i.e., post-emergent) dicamba herbicides to be used with dicamba-tolerant cotton and dicamba-tolerant soybeans.  This announcement was accompanied by several updates to the labels originally proposed by the applicants (i.e., pesticide companies submitting proposed labels based on their own data).  While those updates by the EPA include a litany of factors ranging from runoff and irrigation mitigation to personal protective equipment (PPE) for applicators, the most interesting change in the label can be found in the new mechanism for application cutoffs.

    Under the labels submitted by the pesticide manufacturers, there was either an application cutoff date or a complete prohibition on OTT applications.  For example, per Bayer’s submitted application for registration, the XtendiMax label would have prohibited any OTT applications on soybeans but allowed OTT applications on cotton through July 30th.  These application cutoff dates were originally set in place by state agricultural agencies in 2018, in the immediate aftermath of dicamba drift issues.  However, the EPA in 2020 restricted the powers of those state agencies by scrutinizing FIFRA Section 24(c) registrations that state agricultural agencies had used to create application cutoff dates.  The EPA still maintains the position that state agricultural agencies cannot use FIFRA Section 24(c) to enact additional restrictions on a pesticide’s use.  As such, any application cutoff dates for OTT dicamba since that date have been applicable nationwide (e.g., a June 12th application cutoff date would be put in place for farmers from Georgia to North Dakota).   

    Under the EPA’s latest proposed OTT dicamba labels, the date-based cutoffs have been replaced in favor of temperature-based restrictions on applications.  Under the latest proposal, an applicator will have to know both the highest forecasted temperature for the day of the application as well as the highest forecasted temperature of the day following the application.  Temperature forecasts are required to be conducted by the National Weather Service (NWS) or the National Oceanic and Atmospheric Administration (NOAA).  If both of those temperatures are forecasted below 75 degrees Fahrenheit, the applicator can apply up to the maximum application rate of OTT dicamba, which is 0.5 pounds per acre with 20 fluid ounces of a volatility reducing agent (VRA). 

    When the highest relevant temperature of the day of the application and the following day is between 75 degrees Fahrenheit and 85 degrees Fahrenheit, the applicator can still apply up to 0.5 pounds per acre but must increase the VRA to 40 fluid ounces.  When the highest temperature of the two relevant days is between 85 degrees Fahrenheit and 95 degrees Fahrenheit, the applicator must abide by the prior restriction but now must choose between reducing the area treated by 40% or eliminating tank mix partners (the VRA must still be included).  When the highest forecasted temperature of the day of the application or the day following the application is 95 degrees Fahrenheit or higher, any application of OTT dicamba herbicides is prohibited.     

    Per the EPA, these temperature-based restrictions are intended to simplify the application process for farmers, ideally alleviating the oft-made complaint that the dicamba labels – which could reach 40 pages in length – were too complicated for farmers to effectively abide by.  Still, at least one state regulator has stated that a lack of specificity on dates and times in which farmers can spray OTT dicamba will be problematic for farmers who are preoccupied with every other matter that inevitably arises when crops are in the ground.

    The timing of this announcement by the EPA indicates that OTT dicamba herbicides may be available for the 2026 growing season, though environmental groups have promised to fight such registrations just as those groups have successfully done with the prior two registrations of OTT dicamba.  


    Brown, Nicholas. “Latest Proposed Dicamba Labels Move to Temperature-Based Cutoffs.” Southern Ag Today 5(39.5). September 26, 2025. Permalink

  • Threat Looms and Urgency Grows as New World Screwworm Inches Closer to the Texas-Mexico Border

    Threat Looms and Urgency Grows as New World Screwworm Inches Closer to the Texas-Mexico Border

    Along with most Southern cattle producers, Southern Ag Today has been tracking the movement of the New World Screwworm (NWS).  An article last November (linked here) provided a history of NWS and discussed implications of import restrictions on feeder cattle from Mexico.  A second article (linked here) continued the discussion as the U.S. closed and re-opened the border to Mexican cattle throughout the spring and summer. 

    Earlier this week, an NWS case was detected 70 miles south of the Texas border in Nuevo Leon, Mexico, approximately 370 miles closer than the previous northernmost case detected in Veracruz, Mexico in July.  As the threat of NWS reaching the U.S. grows, the need for eradication efforts and producer preparedness grow more urgent.  Last year, the USDA estimated an NWS outbreak would result in a $732.6 million loss to Texas producers and a $1.8 billion loss to the Texas economy (APHIS, 2024).  Losses for producers would come from animal deaths, decreased production, additional labor and vehicle costs for animal inspection and treatment, and additional medication and insecticide costs.  Additionally, an NWS outbreak may prompt producers to make production practice changes to minimize NWS infestations.  Recall, NWS cause harm by burrowing into open wounds of live animals.  To minimize open wounds, producers may need to skip standard practices like dehorning, castrating, branding, and ear-tagging.  They may also alter calving season to avoid calving during warm months when the NWS is more prevalent.  The effects on marketing calves under these conditions is unknown. 

    The best and highly supported path forward is eradication. To that end, in June USDA laid out a 5-pronged plan to address NWS (USDA, 2025a).  In summary, the plan included:

    1. Prevention of NWS spreading in Mexico through enhancements to sterile fly production in Mexico; improvements of Mexico’s NWS surveillance; an audit of Mexico’s animal health controls; and limitations on movement of animals. 
    2. Protecting the U.S. border by collaborating with border personnel to gather strays, intercept illegally introduced livestock, and monitor wildlife; preparing laboratories to test for NWS; and continuing live animal inspections at ports of entry. 
    3. Preparing for an outbreak through emergency management plans; training of federal and state responders; and stockpiles of treatment supplies. 
    4. Moving eradication efforts forward by:
      • Building an $8.5 million sterile insect dispersal facility at Moore Air Base in South Texas – to be completed by the end of 2025. 
      • Exploring the possibility of a domestic sterile fly production facility.
      • Investing $21 million in the renovation of Mexico’s sterile insect facility – to be completed in 18 months. 
    5. Planning for the future by exploring new treatments and preventatives; improving sterile insect production and technology; and strengthening partnerships with states and land grant universities.  

    In August, Secretary Rollins announced that USDA would be building on the 5-prong plan, in part, by investing $100 million to identify new innovations for tackling NWS and that USDA will construct a sterile fly production facility in Edinburg, TX, at Moore Air Force Base (USDA, 2025b).


    Animal and Plant Health Inspection Service (APHIS). 2024. New World Screwworm, Ready Reference Guide – Historical Economic Impact. https://www.aphis.usda.gov/sites/default/files/nws-historical-economic-impact.pdf

    USDA. 2025a. New World Screwworm Domestic Readiness and Response Policy Initiative. https://www.usda.gov/sites/default/files/documents/nws-visit-policy-brief.pdf

    USDA. 2025b. USDA Announces Sweeping Plans to Protect the United States from New World Screwworm.https://www.usda.gov/about-usda/news/press-releases/2025/08/15/usda-announces-sweeping-plans-protect-united-states-new-world-screwworm


    Graff, Natalie. “Threat Looms and Urgency Grows as New World Screwworm Inches Closer to the Texas-Mexico Border.” Southern Ag Today 5(39.4). September 25, 2025. Permalink

  • China’s Pivotal Role in the Global Cotton Market

    China’s Pivotal Role in the Global Cotton Market

    As a leading importer of cotton, China plays a pivotal role in shaping the international cotton market (Figure 1). China’s cotton imports are highly regulated by government policy, with centralized guidance through a tariff-rate quota (TRQ) system. The TRQ allows a specified amount of cotton (quota, currently at 894,000 tons) to be imported at a lower tariff rate (1%). Imports exceeding the quota are subject to a significantly higher tariff rate (currently at 40%). China adjusts these quotas annually in accordance with World Trade Organization (WTO) rules. Through this mechanism, the government can set cotton import policies in coordination with its reserve programs.

    In 2017, just prior to the first round of the U.S.–China trade war, China produced 27 million bales of cotton. This made China the second-largest cotton producer after India, which produced 29 million bales. Despite this high level of domestic production, China still ranked as the world’s third-largest importer in 2017, after Bangladesh and Vietnam. Since 2017, China’s share of global cotton imports has ranged from 12% to 34%, largely due to its cotton reserve programs and the import quota system.

    In 2023, the above-noted China policies prompted a high volume of cotton imports, which significantly influenced global cotton markets. This import surge was driven by favorable (low) cotton prices and anticipation of trade uncertainties in the 2024 marketing year following the U.S. election. As a result of the large imports in 2023, China’s need for cotton imports in 2024 declined substantially, while domestic cotton production was boosted to a high level. A similar period of disruption occurred in 2012–2014, when China responded to the 2011 price spike by building up massive reserve stocks. For the next three years, those reserves were drawn down in place of imports, sharply reducing China’s buying from the world market. This shift put heavy pressure on global demand, and U.S. cotton prices eventually slid from the 80–90 cent range per pound back down to more typical long-run levels. In the 2025 crop year, China is projected to produce 31.5 million bales of cotton, the highest among all producing countries. Nevertheless, it also imported 5.3 million bales, ranking just behind Bangladesh (8.1 million), Vietnam (8.0 million), and Pakistan (5.9 million). 

    China’s role in the global cotton market has important implications for U.S. growers. Even as the world’s largest cotton producer, China continues to import significant volumes of cotton, and these purchases can swing sharply from year to year depending on government policies, reserve levels, and trade dynamics. These swings in demand can create added risk and unexpected price volatility, even during the fall season, when U.S. growers typically anticipate harvest-time pressures. For U.S. growers, keeping an eye on China’s policy changes and trade relations is critical, as these factors directly affect global cotton prices and export opportunities. Ultimately, China’s decisions will remain a key driver of market conditions that shape the fortunes of cotton producers worldwide.

    Figure 1. Top Five Global Cotton Importers by Country and Year

    Data from the U.S. Department of Agriculture, Foreign Agricultural Service, Production, Supply and Distribution Database. 

    Liu, Yanguan, Gopinath Munisamy, and John Robinson. “China’s Pivotal Role in the Global Cotton Market.” Southern Ag Today 5(39.3). September 24, 2025. Permalink