The USDA’s World Agricultural Supply and Demand Estimates (WASDE) report is one of the most influential monthly publications in agriculture. It summarizes and updates projections on global crop production, trade, and consumption—information that agricultural markets rely on to set prices. However, the October WASDE report will not be released due to the ongoing government shutdown. Without this update, the effects ripple across the supply chain, impacting farmers, merchandisers, and financial markets that depend on timely market intelligence to guide decisions.
Previous government shutdowns have interrupted the release of WASDE reports, and research has shown this has introduced heightened uncertainty into the markets during the short term (Adjemian et al. 2017; Goyal and Adjemian, 2021). Without the monthly WASDE, buyers and sellers lose a crucial reference point on where the market stands. While we can only speculate about what the October report would have shown, its absence means missed opportunities. The numbers could have shifted prices positively or negatively, creating advantages for either sellers or buyers of agricultural commodities.
The disruption is especially significant during harvest. This is the time when actual yields are measured, contracts are delivered, and elevators manage a surge of grain. Typically, the October and November WASDE reports capture updated harvest conditions, painting a near real-time picture of the national balance sheet. Without those updates, elevators are left to alternative sources of information to estimate supply levels—possibly causing basis moves that may be too high or low. Similarly, demand projections lack clarity, which can swing futures prices in either direction.
In the short term, private forecasts will likely gain influence, but these estimates often vary widely by source, adding to market volatility. In the longer term, multiple months of projections may be bundled into a single release once USDA reporting resumes, creating larger adjustments in supply or demand estimates that markets must digest all at once.
In sum, whether the October WASDE would have been bullish or bearish for producers would have depended largely on changes to yield estimates. But the absence of a report is significant in itself. The lack of transparent, standardized market information increases the risk of mispriced grain and market inefficiencies, leaving producers and elevators to make large-scale marketing and storage decisions under heightened uncertainty.
References
Adjemian, M. K., Johansson, R., McKenzie, A., & Thomsen, M. (2018). Was the missing 2013 WASDE missed?. Applied Economic Perspectives and Policy, 40(4), 653-671.
Goyal, R., & Adjemian, M. K. (2021). The 2019 government shutdown increased uncertainty in major agricultural commodity markets. Food Policy, 102, 102064.
The current government shutdown has caused many weekly and monthly reports to not be published. However, USDA-AMS is still generating their daily and weekly reports. The beef industry knows that tight supplies have led to increased price movements over the last couple of years, but beef demand has become a hot topic as of late due to retail beef prices continuing to set all-time highs every month. These market movements have led to a common question, “could demand be decreasing and that’s why the cutout has been decreasing?” One data series that offers valuable insight into the intersection of beef supply and demand is the cutout value.
Figure 1 shows the weekly choice cutout value for this year, last year, and the previous 5-year average. In mid-September, the choice cutout peaked at $413.60/cwt, has steadily decreased each week, and finished last week at $365.25/cwt. This decline is somewhat expected due to seasonality trends. However, last week’s price was $56.82/cwt (18.4%) and $113.57/cwt (45.12%) higher than last year and the previous 5-year average for the same week. Even though the market has experienced peaks and recent declines in the choice cutout value, year-over-year demand indices suggest historically strong demand as consumers pay higher prices for the smaller amounts of beef available.
Consumers make choices not only between cuts of beef but also grades of beef. Figure 2 shows the monthly cutout values by grade for the last 12 months. Since March of this year, each cutout grade has trended upward through September. Interestingly, the last two months have also had increasing spreads between prime and all other grades. To the question posed in the introduction paragraph, there is little data to suggest weakening demand. Tight beef supplies are driving prices higher and consumer demand is holding strong. Consumers will eat less beef overall in 2025 due to less availability, but the higher prices will allocate the various grades and cuts of beef to consumers.
Figure 1. Weekly Choice Cutout Value
Figure 2. Monthly Graded Cutout Values for the previous 12 months
As harvest progresses and crop prices stay at historical lows, it is difficult to consider risk management for 2026. The federal crop insurance program offers a tool that can currently provide a form of county-level revenue protection. Margin Protection (MP) crop insurance was made available for a variety of crops across the southeast region in 2024. MP is an area-level (i.e., county-level) crop insurance product designed to provide risk protection against the risk of thin margins using a combination of county yields, futures prices, and region-specific input usage. Coverage levels range from 70% to 95% and may be purchased with any individual insurance, such as Yield Protection (YP) or Revenue Protection (RP). It may not be purchased with Supplemental Coverage Option (SCO) or Enhanced Coverage Option (ECO) (see Biram and Connor, 2023). Additionally, there is a new product offering similar to ECO and MP called Margin Coverage Option (MCO), which I will provide more details on below.
For certain crops/regions the sales closing date (SCD) for MP coverage is similar to other traditional products, However, in some cases there is an early SCD and price discovery window. This early window offers the opportunity to lock in prices sooner if you think that might be an advantage to the normal spring price discovery. Check here for MP SCD’s and price discovery windows. The earlier price discovery window offered by MP (August 15, 2025, to September 14, 2025), provides corn and soybean producers with the option to buy MP and lock in futures prices, if they think that might be an advantage over the normal price discovery window (January 15, 2026, through February 14, 2026). For example, the current USDA, Risk Management Agency (RMA) projected price for MP purchased for corn is $4.55/bushel, which implies a price guarantee of $4.32/bushel assuming county yields and costs remain constant. The risk of cost of production portion of MP provides protection from price volatility for Urea, Diammonium Phosphate (DAP), Diesel, and the Interest Rate on a farmer’s production loan. These prices also face projected price discovery periods similar to crop futures prices but have different windows of harvest price discovery (see Chattha and Biram, 2024).
Another decision variable in the MP coverage decision is the Protection Factor (PF). The PF ranges from 80% to 120% and offers higher (lower) protection at a higher (lower) premium cost and largely functions as a farm-level production adjustment. That is, if a farmer perceives their yield to be higher than the county average, they may select a PF higher than 100% at an additional premium cost. Alternatively, if a farmer perceives their yield to be lower than the county average, they may select a PF less than 100% and pay a lower premium.
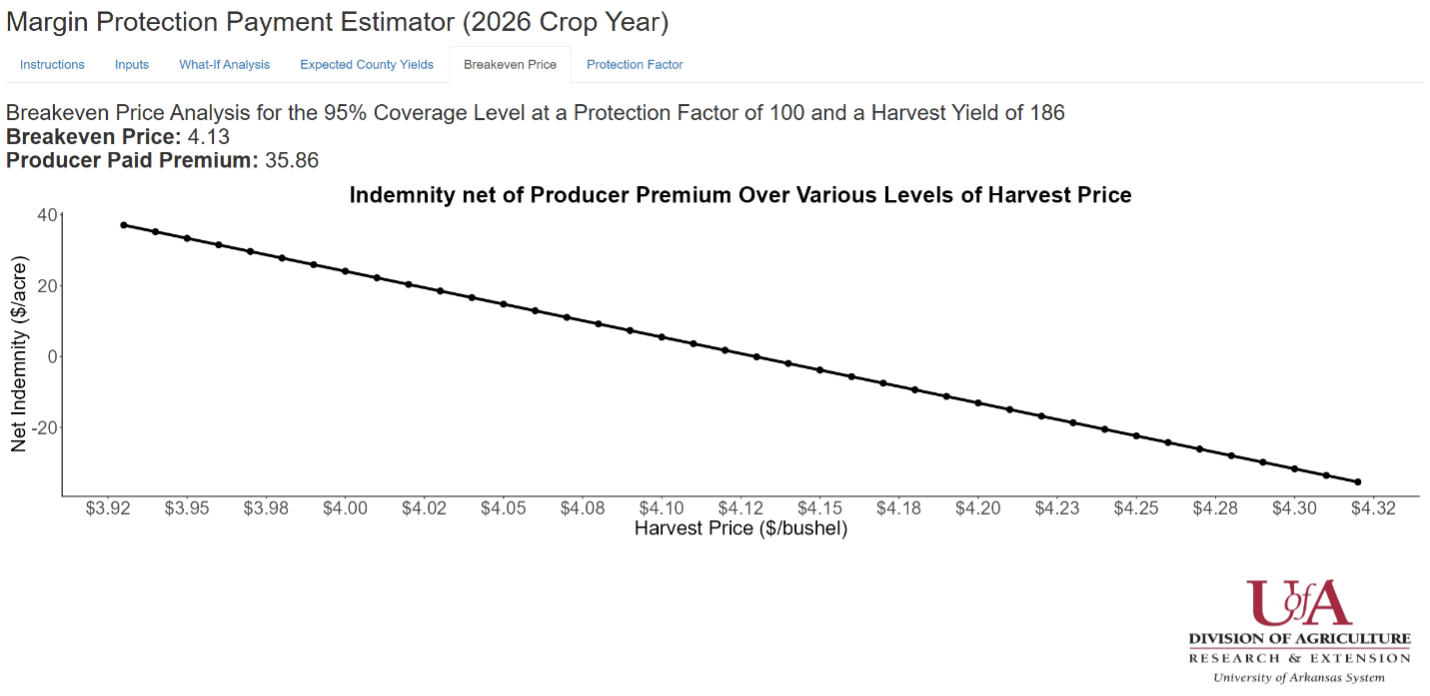
The University of Arkansas, Cooperative Extension Service offers a fully web-based Margin Protection decision aid. The decision aid allows the user to input information such as state, county, crop, and irrigation practice to determine Margin Losses (i.e., indemnities) net of producer paid premiums across all coverage levels. Additionally, the tool offers a feature that calculates a breakeven price, which is a harvest time crop futures price that results in a Zero Net Indemnity, or a Margin Loss equal to the producer paid premium. Breakeven prices vary by coverage level and harvest county yields input by the user.
An example output showing net indemnities across different harvest crop futures prices, including a breakeven price of $4.13/bushel at the 95% coverage level, is provided in Figure 1 below. This figure suggests that Margin Losses at or above the producer paid premium are experienced if the 2026 December corn futures price has a 30-day average below $4.13/bushel at harvest (i.e., from August 15, 2026, through September 14, 2026). You may access the Margin Protection Payment Estimator (2026 Crop Year) at this link. Fact sheets which provide all of the details of MP, including counties eligible for enrollment, may be found at the following links: Margin Protection Crop Insurance and Determining Expected Cost and Premium Rates.
Figure 1. Example Breakeven Price Figure from Margin Protection Payment Estimator Tool
This is an example of net indemnities across various harvest time crop futures prices for corn in Arkansas County, Arkansas assuming county yield remains unchanged. Intuitively, as the harvest price increases the net indemnity decreases.
Margin Coverage Option (MCO)
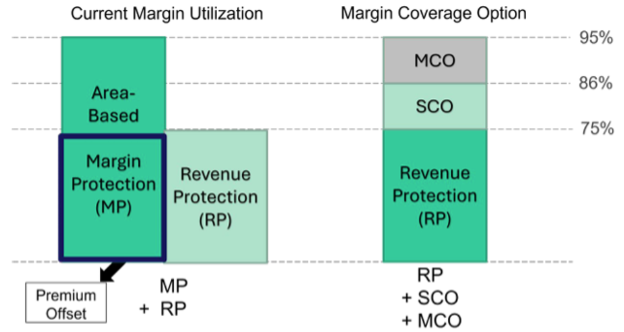
Like MP, MCO provides area-based coverage against an unexpected fall in operating margin. This could be driven by a fall in the county-level yield average, a fall in the harvest-time futures price, or an increase in the futures prices of select inputs or any combination of these perils. MCO faces the same projected and harvest price discovery periods for crop futures and input future prices as MP. MCO uses the same expected and final county-level yields as SCO and ECO and covers a band from 86% to either 90% or 95% of expected county-level revenue. Figure 2 provides a visual comparison of MP and MCO and their eligibility to be enrolled with other federal crop insurance products. Currently, the subsidy rate for MCO is the same as the updated subsidy rates for SCO and ECO, which is 80% of the actuarially fair premium, meaning farmers will pay 20% of the total premium expense. For a full list of crops and MCO pilot areas, visit www.margincoverageoption.com. The Sales Closing Date (SCD) for the 2026 crop year for MCO on cotton and sorghum is September 30, 2025, while the SCD for MCO on Rice in Arkansas is February 28, 2026, like MP and other major crop insurance plans (e.g., YP, RP, SCO, and ECO).
Figure 2. Comparing Coverage Bands of MP and MCO and Eligible with Other Federal Crop Insurance Products
Biram, H.D. and Connor, L. (2023). Types of Federal Crop Insurance Products: Individual and Area Plans. University of Arkansas System Division of Agriculture, Cooperative Extension Service Fact Sheet No. FSA75.
Biram, H.D. and Stiles, S. (2022). Margin Protection Crop Insurance: A Way to Manage the Risk of High Input Costs. University of Arkansas System Division of Agriculture, Cooperative Extension Service Fact Sheet No. FSA66.Chattha, K.A. and Biram, H.D. (2024). Determining Expected Cost and Premium Rates in Margin Protection Crop Insurance. University of Arkansas System Division of Agriculture, Cooperative Extension Service Fact Sheet No. FSA87.
You have been elected to the board of directors, and now what? Gaining some confidence as a new director can be as simple as asking important questions. This is a brief dive into your fiduciary duties and role as a director of a cooperative with a focus on the questions you should be asking. But first, what are fiduciary duties?
Fiduciary Duties
In simple terms, a fiduciary is someone who is entrusted to act on behalf of another. As a director of your cooperative, you have been given authority to act on the behalf of cooperative members. There are specific duties associated with this role. Some of them include:
The Duty of Loyalty
Acting in unity with the best interests of the cooperative and its members.
The Duty of Care
Exercising reasonable care, skill, and diligence in carrying out your responsibilities.
The Duty of Good Faith
Acting honestly and fairly in your dealings with the cooperative and its members.
The Duty of Confidentiality
Keeping confidential all information related to the cooperative and not using that information for personal gain.
Your role as a director
Your role as director is to represent the interests of the cooperative members, and to represent the interests of the cooperative itself. As a director, your role is limited to a few general things.
Hire and evaluate a manager (and then get out of the way).
Establish policies to protect the cooperative, its assets, and its employees.
Engage professional services needed by the cooperative such as a lawyer or auditor.
Ensure accountability for the proper use of cooperative assets.
Provide strategic direction.
Some questions for self-reflection
Let’s consider some questions that might help you stay aligned with your fiduciary and board responsibilities. During board discussions, you might ask yourself:
Is this a topic for board discussion, or is it the responsibility of management?
How will this decision affect our members?
Is this decision fair to all members?
Do we fully understand the facts about this issue?
Have we verified this information?
Is there anything about our decision that might have the appearance of something illegal or unethical?
Is this something that should not be discussed outside the boardroom?
Some questions to improve board discussions
The best boards are the ones that engage in a lot of discussion. If your board meetings feel repetitive, or methodical, or if you feel like your board is in a rut, simply approving what is presented, consider asking some of these questions.
Does this support the mission of the cooperative?
Why does our cooperative exist?
What does our cooperative do better than competitors?
Why should someone be a member of our cooperative?
What are the financial trends of our cooperative, and how do they compare to our industry?
Are we profitable?
Are we efficient?
Are we adding value to member investments?
Are we taking unusual risks (including the status of our accounts receivable)?
Are we replacing and protecting assets?
What are the forces that impact profitability in our industry, and how can we counteract them?
How can we avoid price competition with rival firms?
Is it likely that new firms could enter our industry?
Could our core business be replaced by firms or technologies from other industries?
Do our suppliers have power over prices?
Do our buyers have power over prices?
The most common advice that veteran directors offer new directors is to ask lots of questions. It’s natural to feel reluctant to ask questions. Maybe you are embarrassed to ask something simple, or you are afraid to appear inexperienced. But your questions are likely in the minds of others as well. The answers to these questions will generate discussions that strengthen board connections and overcome groupthink. The questions presented here will help new directors to become more confident in their duties, and boards to become more progressive and effective.
Wildlife damage to crops has become a growing concern for U.S. agriculture. Crop insurance records show that payments for wildlife-related losses increased from about $15 million in 2012 to nearly $39 million in 2022. Among the different threats, feral swine stand out as one of the most destructive, causing an estimated $800 million in damages each year to crops, livestock, property, and even natural resources such as water quality and wildlife habitat.
Feral swine have spread quickly—moving from fewer than 20 states in the early 1980s to more than 30 states today. Because animals often cross property lines, private control efforts, such as hunting and trapping, have been costly and only partly effective. This has created demand for coordinated public programs that can reduce hog populations and restore damaged farmland.
In response, the 2018 Farm Bill created the Feral Swine Eradication and Control Pilot Program (FSCP) with $75 million in funding to remove feral hogs and restore land. The program began in 2020 in 20 selected counties across 11 southern states and expanded in 2021. These counties were selected based on feral swine presence and notable increases in damages (Figure 1). This article summarizes findings from our recent study (Duncan et al., 2025) that evaluated the impact of the FSCP on crop insurance damages.
Findings
Our analysis of USDA Risk Management Agency data from 2013 to 2022 indicates that the FSCP has had an impact, but the benefits are not spread evenly across all crops. The clearest effect was seen in corn. Counties participating in FSCP showed fewer corn acres receiving wildlife-related insurance payments than similar counties without the program. This pattern is consistent with what producers in the field have reported—that corn losses to feral hogs were noticeably lower in areas where FSCP activities were underway.
For other crops, the story is more mixed. For soybeans, wheat, and peanuts, however, the data looked much the same—whether or not counties participated in FSCP. Cotton did show some reduction in losses in certain years, but the effect was smaller and less consistent than what we observed for corn. These results suggest that while FSCP is helping to address hog damage, especially for corn, it may take more time and continued investment before its benefits can be clearly seen for other crops.
Implications
The finding that corn producers benefited the most from FSCP is not surprising. Corn is one of the crops most heavily targeted by feral hogs, and the program’s design, focused on removal and land restoration, appears to be reducing this pressure. For producers, this means that FSCP can serve as a valuable complement to private control efforts that have often proven costly and only partly effective. The lack of clear effects for other crops should not be taken to mean that the program has no value beyond corn. Rather, it may reflect the fact that FSCP is still in its early stages. The program roll out coincided with COVID-19 disruptions which potentially slowed participation and adoption. It is possible that as the program continues and expands, measurable benefits for soybeans, peanuts, and wheat could become more apparent. Also, we should note that a limitation of this study is that only crop damages that were severe enough to trigger crop insurance payments were included. The crop insurance data does not determine the species causing crop damage. We exclude damages that were not severe enough to trigger a crop insurance payment, as well as benefits to livestock health, property, and the environment.
For policymakers, these results suggest that targeting resources towards corn-producing regions could deliver the greatest near-term return on investment. Continued funding and expansion could strengthen these results and help ensure that the success of the corn program translates more widely throughout US agriculture in the coming years.
Figure 1. Wildlife-related indemnified crop acres by crop, 2013–2022. Soybeans and corn account for the majority of reported losses.
Duncan, H., Boyer, C. N., Park, E., & Smith, S. A. (2025). “Evaluating Feral Swine Eradication and Control Pilot Program Impact on Crop Indemnities.” Applied Economic Perspectives and Policy. https://doi.org/10.1002/aepp.70016