Blog

  • Beef Imports to the Rescue?

    Beef Imports to the Rescue?

    Could beef imports from Argentina reduce beef prices in the U.S.?

    Argentina is the sixth largest beef producing country and the fifth largest beef exporting country, accounting for roughly 6 percent of global beef exports. Argentine beef production is about 27 percent of total U.S. production. In recent years, Argentine beef exports have been growing with the majority of beef exports going to China along with Israel, the E.U. and the U.S.

    Argentina is the ninth largest source of beef imports in the U.S., accounting for about 2.1 percent of total U.S. beef imports thus far in 2025. U.S. imports of Argentine beef have been growing in recent years (recovery in Argentina) and were up 41.7 percent year over year through July (the latest data available since the shutdown).  

    How much more beef can the U.S. import from Argentina?

    It’s not clear how much capacity to increase beef exports exists currently in Argentina.  Domestic beef consumption in Argentina uses 70-75 percent of total beef production in the country.  If, for example, the U.S. doubled imports over 2024 levels, it would likely mostly be at the expense of domestic consumption in Argentina or other export markets for Argentine beef.  Such an increase in imports from Argentina would have a negligible impact on the total supply of beef in the U.S. market.   In fact, if the U.S. took all of the projected 2025 Argentine beef exports (not likely), it would represent less than 2.5 percent of the total U.S. beef supply.  

    The Impact in U.S. beef markets

    The majority of Argentine beef imports are lean processing beef used for ground beef production.  This beef is quite similar to beef imported from Brazil (and most other import sources).   Imports from Argentina are less than 10 percent of the imports from Brazil.  Increasing imports from Argentina would have a very slight impact in offsetting the reduction in imports from Brazil expected because of the sharp increase in tariffs on Brazil.  The impacts on beef imports from Brazil are not evident in the January -July import data and we have not had any updates since then. The August data should have been released in early October.  

    Record high cattle and beef prices are occurring despite record beef imports.  Increased beef imports (mostly lean processing beef) partially offsets decreased nonfed beef production in the U.S., helping to moderate sharply higher ground beef prices and increasing utilization of fatty trimmings from U.S. fed cattle.  Argentina is a relatively minor source of beef imports and potential increases would not significantly change the overall supply of beef in the U.S. In short, it does not appear that increasing beef imports from Argentina would have any significant impacts on U.S. beef prices. At most, it might have a very slight (and probably undetectable) impact of moderating expected future increases in U.S. ground beef prices. 

    This article originally appeared in Oklahoma State University Extension’s Cow-Calf Corner Newsletter. 


  • Tracking Technology Adoption on Southern Farms

    Tracking Technology Adoption on Southern Farms

    As high-speed broadband reaches more rural communities, it is important to explore how farms are utilizing the internet and advanced technologies in their operations. Every two years since 1997, the USDA’s National Agricultural Statistics Service has conducted a survey to get an overview of technology use on farms (USDA, 2025). The survey asks producers about what devices they own, whether or not they can access the internet (and if so, if their services are through fiber, cable, etc.), and how they use the internet for business-related purposes. The most recent survey’s findings were released in August 2025 and include comparisons, where applicable, to responses from the 2023 survey. 

    Table 1 shows the 2025 response rates for the percentage of farms that purchase agricultural inputs over the internet, conduct agricultural marketing activities over the internet, and use precision agriculture to manage crops or livestock for states in the Southern Region. The values in parentheses are percentage changes in response rates between the 2023 and 2025 surveys. Looking at changes in the percentage of farms purchasing agricultural inputs over the internet, all southern states saw increased use of the internet to purchase inputs between 2023 and 2025. Notably, four states (Louisiana, Mississippi, South Carolina, and Texas) saw over a 100% increase in the percentage of farms reporting that they buy inputs online. Given the farm financial situation over the last couple of years, farmers could be exploring non-traditional ways of buying inputs to find better deals. With 50% of respondents across the U.S. saying they used the internet to purchase inputs in 2025, it also shows the importance that reliable internet access has on agriculture. 

    For the percentage of farms stating that they conduct agricultural marketing activities online, the average across southern states in 2025 was about 25% compared to an average of 29% across the entire United States. The majority of southern states had positive increases in the percentage of farms reporting that they engaged in agricultural marketing online from 2023 to 2025. Georgia (-23%) and Missouri (-8%) being the only exceptions.  However, the survey did not reveal the specific type of marketing activities they conduct online. It could be that most are simply getting crop/livestock price information.  Either way, it is an indication of the growing importance of online engagement.

    The column to the far right in Table 1 is for the percentage of farms using precision agriculture. Between 2023 and 2025, the percentage of farms that use precision agriculture for their crops or livestock decreased in seven southern states, with the largest decreases occurring in Tennessee, North Carolina, and Alabama. The percentage of farms that use precision agriculture increased in the other seven southern states over the same time period. For the U.S. as a whole, the use of precision ag technologies decreased by 19% from 2023 to 2025. This finding could signal that precision ag technologies are not viewed as cost savers, and producers are cutting these technologies to save costs. 

    Producers are finding different ways of using the internet to help with their businesses, including buying inputs and finding marketing information. These are relatively low-cost ways of gaining cost savings or information. Conversely, higher cost technologies, like precision agriculture, may see their use decreased in times of financial stress. Regardless, these results show that having reliable internet access is an essential tool for farmers.

    StatePercentage of Farms that Purchase Agricultural Inputs over InternetPercentage of Farms that Conduct Agricultural Marketing Activities over InternetPercentage of Farms Using Precision Agriculture Practices to Manage Crops or Livestock
    Alabama44% (100%) *19% (111%)15% (-32%)
    Arkansas45% (55%)28% (8%)20% (-26%)
    Florida57% (84%)24% (50%)17% (42%)
    Georgia51% (11%)23% (-23%)18% (38%)
    Kentucky49% (69%)27% (69%)13% (18%)
    Louisiana53% (130%)27% (125%)22% (-29%)
    Mississippi48% (140%)26% (271%)19% (-5%)
    Missouri43% (59%)24% (-8%)22% (-4%)
    North Carolina58% (66%)29% (-9%)17% (-37%)
    Oklahoma51% (89%)29% (45%)22% (22%)
    South Carolina57% (159%)25% (47%)17% (21%)
    Tennessee47% (88%)22% (22%)12% (-61%)
    Texas51% (143%)23% (130%)14% (8%)
    Virginia48% (23%)28% (87%)14% (27%)
    United States50% (56%)29% (26%)22% (-19%)
    *  Values in parentheses represent percentage changes in responses from 2023 to 2025

    Source: United States Department of Agriculture, National Agricultural Statistics Service. 2025. Technology Use (Farm Computer Usage and Ownership). Available at: https://esmis.nal.usda.gov/publication/technology-use-farm-computer-usage-and-ownership. 


    Mills, Devon, and Brian E. Mills. “Tracking Technology Adoption on Southern Farms.” Southern Ag Today 5(43.1). October 20, 2025. Permalink

  • Southeastern U.S. Specialty Crop Sector Competitiveness: Moving the Needle

    Southeastern U.S. Specialty Crop Sector Competitiveness: Moving the Needle

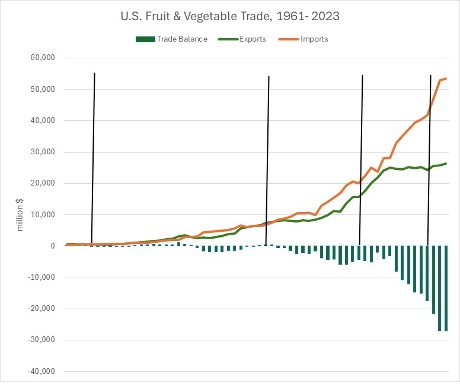
    Fruit and vegetable sectors are important contributors to the U.S. agriculture economy. At the same time, they are particularly vulnerable to import competition and recorded a positive annual trade balance in just 18 of the 63 years between 1961 and 2023 (Figure 1). 

    Data Source: FAO Stat

    From an economic perspective, sustainable market competitiveness (whether domestic or international) is driven by a combination of: (1) lower cost throughout the supply chain; (2) prioritized market access – earlier entrance to a market or better market intelligence; and (3) increased value to buyers – differentiated products that consumers can identify, want, and purchase. 

    The Southeastern specialty crop sector comprises hundreds of unique crops and growing situations, with the emergence of new or differentiated crops ongoing. While this creates opportunities for market development and response to consumers, it can create challenges for the development and commercialization of innovative technologies to lower costs. Technology development for specialty crops must either target a relatively small number of potential users or be adaptable over differentiated use cases. Agricultural research and manufacturing interests are more likely to focus on the needs of the almost 300,000 U.S. farms (80.6 million acres) growing corn for grain in 2022 than the needs of the less than 8,500 U.S. farms (73,500 acres) growing strawberries. Additive manufacturing technologies may eventually expand solutions for small-volume agricultural needs as they have in manufacturing sectors of the economy (Lu et al., 2024).

    There is widespread recognition that the cost and availability of labor are one of the leading challenges (IFPA, 2023; Martin 2024). Mechanized solutions such as precision agriculture, remote sensing, mechanical harvesters, and labor-aids offer potential benefits as labor-saving technologies. Concerns over labor availability and affordability are not new, and neither are attempts to develop mechanization. Yet the adoption of such technologies has been uneven, over time and across commodities. Recent policy changes are aimed at the affordability of workers. On October 2, 2025, the U.S. Department of Labor (DOL) issued an Interim Final Rule establishing a new, skill-based methodology for calculating the Adverse Effect Wage Rate (AEWR) for H-2A agricultural workers in non-range occupations, aiming to lower costs for farmers.

    Unique needs among the myriads of commodities, markets, and supply chains that comprise specialty crops makes shifting sector competitiveness challenging, even within seasonal markets. Technologies compatible with large-scale systems may not be feasible on a smaller-scale and vice versa. It is critical to assess technology and information needs for small-scale and regional challenges as well as large commercial farms. 

    References

    International Fresh Produce Association (IFPA). 2023. Future Trends Report. Available online: https://www.freshproduce.com/resources/consumer-trends/2023-future-trends-report/

    Lu, Y., W. Xu, J. Leng, X. Liu, H. Xu, H. Ding, J. Zhou, and L. Cui. 2024. “Review and Research Prospects on Additive Manufacturing Technology for Agricultural Manufacturing.” Agriculture 14(8):1207.

    Martin, P. 2024. Bracero 2.0: Mexican Workers in North American Agriculture. Oxford University Press. 


    Thirnsbury, Suzanne. “Southeastern U.S. Specialty Crop Sector Competitiveness: Moving the Needle.” Southern Ag Today 5(42.5). October 17, 2025. Permalink

  • Can the U.S. Move from Multilateral to Bilateral Trade Agreements?

    Can the U.S. Move from Multilateral to Bilateral Trade Agreements?

    As U.S. trade policy under this administration continues to dominate the news, there seems to be a marked shift from multilateral to bilateral trade negotiations. The current administration’s strategy to use tariffs and the size of the U.S. economy as leverage to change trade relationships bilaterally seems to be the norm lately. There are 166 countries that are members of the World Trade Organization (WTO). How realistic would it be for the U.S. to negotiate bilateral trade agreements with each of them? And a follow up question, does the United States need to have a bilateral trade agreement with each country?

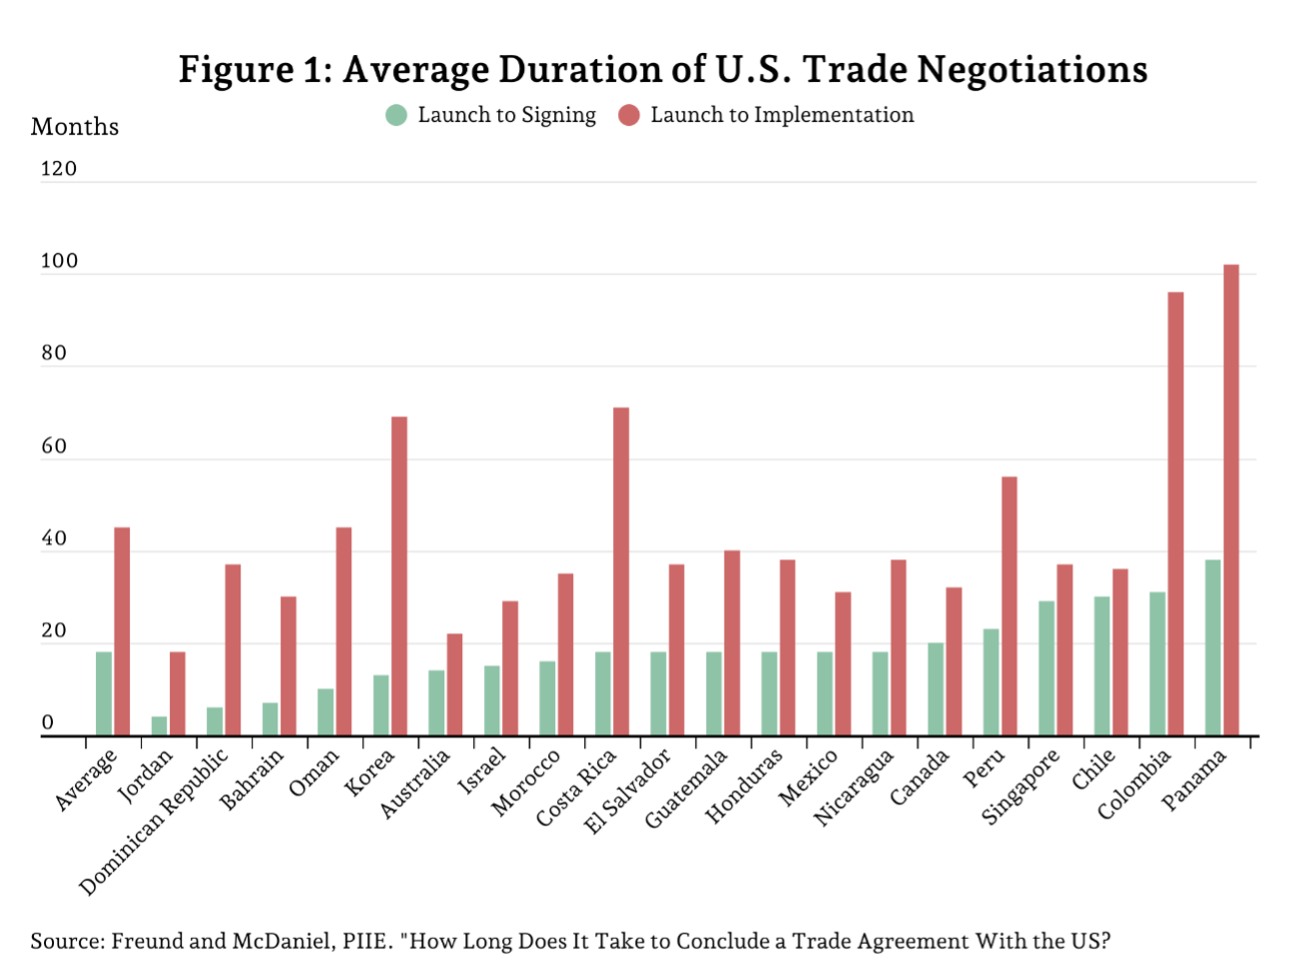
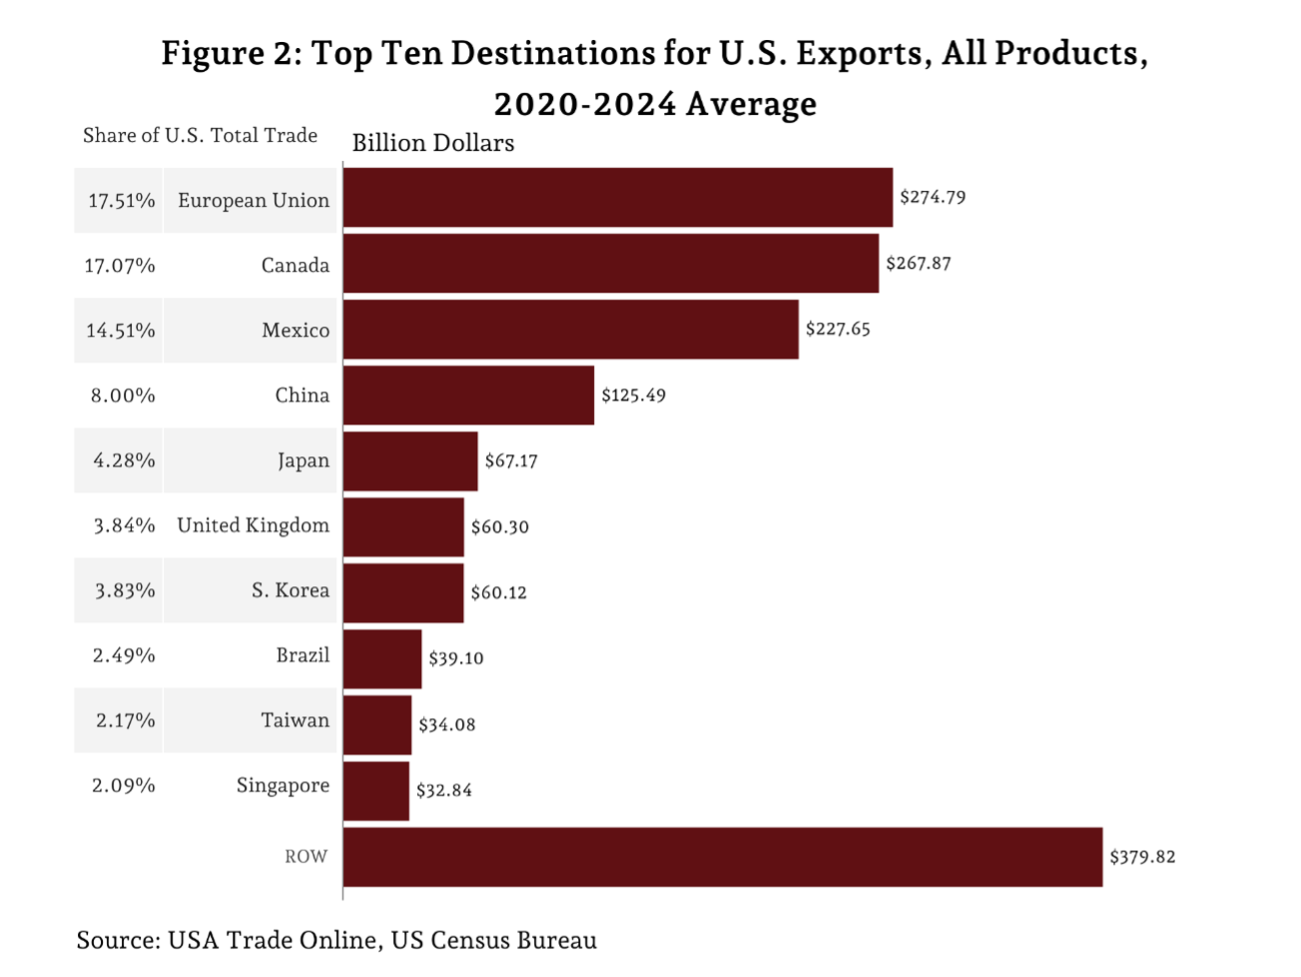
    The answer to the first question is probably “no” as the average duration of U.S. trade negotiations from launch date of signing is 18 months and from launch to date of implementation is 45 months (Figure 1.). Therefore, it will take too much time and resources to negotiate or re-negotiate trade agreements with all WTO members. However, to the second question, the answer is probably “no” as well; the top 10 export destinations accounts for 76 percent of all U.S. products exported (Figure 2.). The European Union (EU) is the largest market for U.S. products accounting for 17.51 percent followed by Canada, Mexico and China with 17.07, 14.51 and 8 percent, respectively. The United States has already or is currently negotiating trade agreements with all top 10 countries.

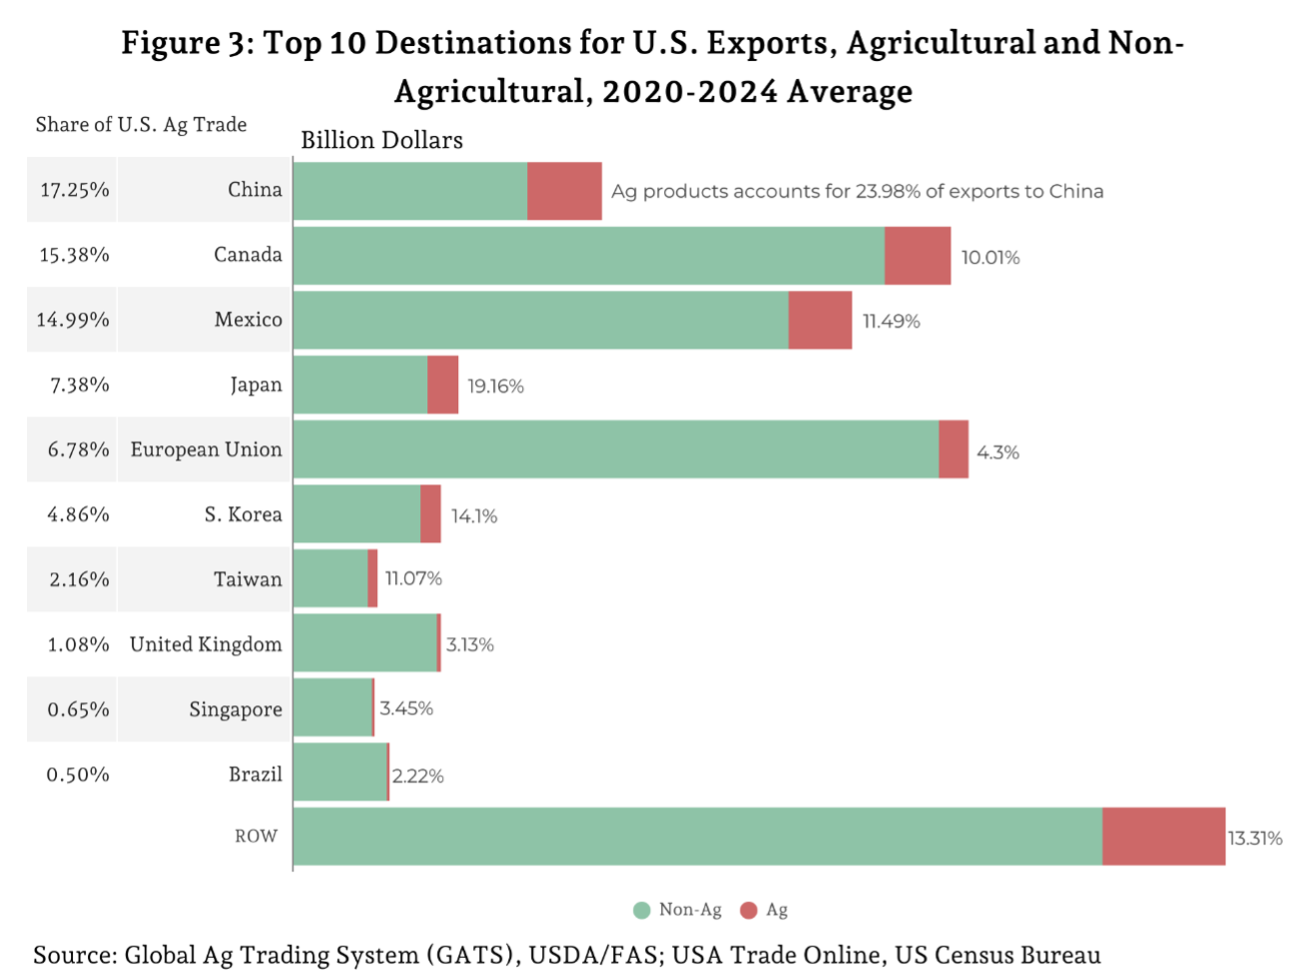
    When the top 10 destination for all U.S. products are ranked by share of agricultural exports, the order of countries changes. China is the largest destination for all U.S. ag products accounting for 17.25 percent. In addition, agricultural products account for 23.98 percent of all U.S. products that China imports from the United States. The second largest destination is Canada where 15.38 percent of all U.S. agricultural products end up, and those agricultural products account for 10.01 percent of all U.S. products exported to Canada. To finish the top three, Mexico accounts for 14.99 percent of all U.S. agricultural products exported while agricultural products account for 11.49 percent of all products the U.S. exported to Mexico. These top 10 countries account for 71 percent of all U.S. agricultural exports.  Due to the latest trade tensions, China is no longer the top destination for U.S. ag exports but is now third behind Mexico and Canada.

    References

    Foreign Agricultural Service (FAS). Global Agricultural Trade System (GATS). Online database. https://apps.fas.usda.gov/gats/default.aspx. Online public database accessed October 2025. 

    Freund, Caroline & Christine McDaniel. “How Long Does It Take to Conclude a Trade Agreement With the US?” Peterson Institute for International Economics. July 21, 2016.


    Ribera, Luis A., Landyn Young. “Can the U.S. Move from Multilateral to Bilateral Trade Agreements?” Southern Ag Today 5(42.4). October 16, 2025. Permalink

  • Potential Market Impacts of Missing a WASDE Report During Government Shutdowns

    Potential Market Impacts of Missing a WASDE Report During Government Shutdowns

    The USDA’s World Agricultural Supply and Demand Estimates (WASDE) report is one of the most influential monthly publications in agriculture. It summarizes and updates projections on global crop production, trade, and consumption—information that agricultural markets rely on to set prices. However, the October WASDE report will not be released due to the ongoing government shutdown. Without this update, the effects ripple across the supply chain, impacting farmers, merchandisers, and financial markets that depend on timely market intelligence to guide decisions.

    Previous government shutdowns have interrupted the release of WASDE reports, and research has shown this has introduced heightened uncertainty into the markets during the short term (Adjemian et al. 2017; Goyal and Adjemian, 2021). Without the monthly WASDE, buyers and sellers lose a crucial reference point on where the market stands. While we can only speculate about what the October report would have shown, its absence means missed opportunities. The numbers could have shifted prices positively or negatively, creating advantages for either sellers or buyers of agricultural commodities.

    The disruption is especially significant during harvest. This is the time when actual yields are measured, contracts are delivered, and elevators manage a surge of grain. Typically, the October and November WASDE reports capture updated harvest conditions, painting a near real-time picture of the national balance sheet. Without those updates, elevators are left to alternative sources of information to estimate supply levels—possibly causing basis moves that may be too high or low. Similarly, demand projections lack clarity, which can swing futures prices in either direction.

    In the short term, private forecasts will likely gain influence, but these estimates often vary widely by source, adding to market volatility. In the longer term, multiple months of projections may be bundled into a single release once USDA reporting resumes, creating larger adjustments in supply or demand estimates that markets must digest all at once.

    In sum, whether the October WASDE would have been bullish or bearish for producers would have depended largely on changes to yield estimates. But the absence of a report is significant in itself. The lack of transparent, standardized market information increases the risk of mispriced grain and market inefficiencies, leaving producers and elevators to make large-scale marketing and storage decisions under heightened uncertainty.

    References

    Adjemian, M. K., Johansson, R., McKenzie, A., & Thomsen, M. (2018). Was the missing 2013 WASDE missed?. Applied Economic Perspectives and Policy, 40(4), 653-671.

    Goyal, R., & Adjemian, M. K. (2021). The 2019 government shutdown increased uncertainty in major agricultural commodity markets. Food Policy, 102, 102064.


    Gardner, Grant. “Potential Market Impacts of Missing a WASDE Report During Government Shutdowns.” Southern Ag Today 5(42.3). October 15, 2025. Permalink