Blog

  • Product of the U.S.A. Rule and Trade Implications

    Product of the U.S.A. Rule and Trade Implications

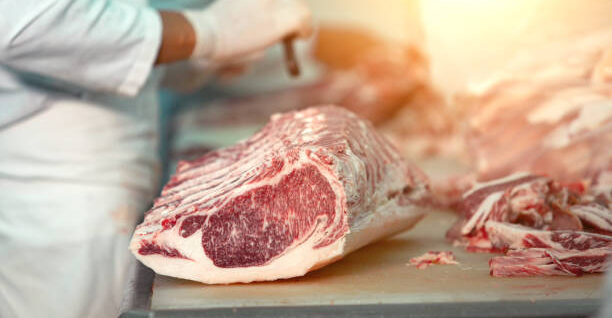
    On May 17, 2024, the USDA’s new “Product of the USA” rule took effect nationwide. At your local meat counter, “Product of the USA” now has a new meaning. Previously, labels using “Product of the USA,” “Made in the USA” and use of the American flag imagery could be used whenever any single part of the processing of meat, poultry and eggs occurred within the U.S. This meant that even where the only processing involved was repackaging on U.S. soil, labels could claim that the product was “Made in the USA.” In a 2022 USDA conducted study, 63% of consumers mostly incorrectly believed that “Product of the USA” meant that all production steps occurred in the U.S., an additional 21% reported not knowing what “Product of the USA” meant, while only 16% of consumers could correctly define this marketing claims.[i]

    On March 11, 2024, USDA Secretary Tom Vilsak announced USDA’s new rule for labeling meat, poultry, and eggs as “Product of the USA” or “Made in the USA,”, as well as the use of the American flag on labels. Under the new rule, these claims may only be used if the product is derived from animals born, raised, slaughtered, and processed in the United States. Meaning, every step from birth to processing must be done in the U.S. in order to use these marketing claims. The same is true whether it is a single-ingredient product, such as ground beef, or a multi-ingredient product such as pork sausage. With the exception for spices and flavorings, which may be of foreign origin, each individual ingredient must be of U.S. origin and entirely processed within the United States. Compliance for those choosing to use these marketing claims is mandated by January 1, 2026. The new rule is intended to better align with consumer understanding of the label claims. In the announcement of the new rule, Vilsak stated that consumers should be able to rely on the packaging claims of meat, poultry and egg products which they are purchasing, without hidden nuances and misleading claims. 

    As we saw with country-of-origin labeling (COOL), Mexico and Canada have openly expressed objection to the new Product of the USA rule in terms of compliance with existing trade agreements, suggesting that the rule violates the United States-Mexico-Canada Agreement (USMCA) and U.S. obligations to the World Trade Organization by discriminating against Mexico and Canada exports and ignoring economic integration principles. Further, Mexico alleges that the rule hinders binational production chains, ignores North America’s extensive integration of meat and livestock industries, and may result in food chain disruptions.[ii] It is anticipated that the countries will consult and work towards a mutually agreeable resolution, as is first required by USMA’s dispute resolution process.

    This conflict follows on the heals of a U.S.-Mexico USMCA dispute regarding Mexico’s ban on biotech and genetically modified (GM) corn, initially in tortillas and dough, with the intent to gradually ban the use of biotech and GM corn in all products intended for human and animal consumption. The U.S. alleges that Mexico’s ban is not based in science and undermines market access guaranteed by the USMCA. In August of 2023, the U.S. established a dispute panel under provisions of the USMCA in an effort to ensure that U.S. producers continue to have “full and fair access to the Mexican market.”[iii] A hearing on this dispute is scheduled for June 2024 with an expected report and decision by the dispute panel in November 2024.


    [i]https://www.fsis.usda.gov/sites/default/files/media_file/documents/Product_of_USA_Consumer_Survey_Final_Report.pdf

    [ii] Gobierno De Mexico, Press Release form the Ministry of Agriculture. March 11, 2024. https://www.gob.mx/agricultura/prensa/press-release-from-the-ministry-of-agriculture

    [iii] Office of the U.S. Trade Representative, Press Release. August 17, 2023. https://ustr.gov/about-us/policy-offices/press-office/press-releases/2023/august/united-states-establishes-usmca-dispute-panel-mexicos-agricultural-biotechnology-measures


    Friedel, Jennifer. “Product of the U.S.A. Rule and Trade Implications.Southern Ag Today 4(24.5). June 14, 2024. Permalink

  • China lifts ban on Australian beef: Is there cause for concern in the U.S.?

    China lifts ban on Australian beef: Is there cause for concern in the U.S.?

    In 2019, China became the largest beef importing country in the world ($8.2 billion). By 2022, China imported a record $18.0 billion in beef and beef products. To provide some background, China’s imports were negligible over a decade ago, less than $150 million in 2010 and 2011. The remarkable growth in China’s beef imports since that time has benefited major exporting countries, most notably Brazil. However, U.S. exporters have also benefited, particularly since China lifted its ban on U.S. beef due to BSE concerns in 2016. China is now the third leading market for U.S. beef exports (See previous SAT article in 2023).

    Figure 1 shows China’s beef imports since 2010 in terms of quantity and value and by exporting country. Since 2010, China’s beef imports have increased from 33 million metric tons to 2.8 billion metric tons by 2023, which is an increase of 8,000%. As the figure shows, Brazil accounts for the largest share of total imports (1.2 billion metric tons). Since 2019, U.S. beef exports to China increased from 10 million metric tons ($85 million) to 192 million metric tons ($1.8 billion) by 2022.In late May, China lifted bans on Australian beef companies raising questions about the competitiveness of U.S. beef in China moving forward. Recall that these bans were imposed during a period of rising tensions when Australia’s former Prime Minister called for an investigation into the first outbreak of COVID-19 in central China. Tensions between Australia and China began to ease in 2022 with the election of the new Prime Minister (Hoyle, 2024). The ease in tensions and the lifting of ban on Australian companies have resulted in increased imports from Australia in recent years. But what does the data show for U.S. beef? In 2023, U.S. beef exports to China decline from 192 to 166 million metric tons, while imports from Australia increased from 185 to 228 million metric tons. That said, Uruguay (decrease of 84 million metric tons) and New Zealand (decrease of 10 million metric tons) also experienced declines in the Chinese beef market in 2023, even as beef imports from Argentina, Brazil, and the Rest of World increased. Year-to-date (January-April) imports in 2024 suggests a different story. As of April 2024, China’s beef imports are down 18% when compared to imports during the same period in 2023. Beef imports from Australia were down 26% as of April 2024. However, imports of U.S. beef were up 7% as of April of this year. Only time will tell if these trends continue throughout the year.

    Figure 1. China’s Beef Imports by Major Exporting Country: 2010-2023

    References

    Hoyle, R. (2024). “China Lifts Ban on Most Australian Beef Exporters, Australian Officials Say” Wall Street Journal(May 29, 2024).

    Trade Data Monitor®. (2023). https://tradedatamonitor.com/


    Muhammad, Andrew. “China lifts ban on Australian beef: Is there cause for concern in the U.S.?Southern Ag Today 4(24.4). June 13, 2024. Permalink

  • Farmland Value Trends in South

    Farmland Value Trends in South

    Farmland value represents the most important component of an agricultural producer’s net worth and asset value, accounting for more than 80% of the average farm balance sheet, according to a USDA survey. Therefore, monitoring farmland value per acre is crucial, as it affects farmers’ and ranchers’ ability to secure additional funding from lending institutions, given that these lands are used as collateral.

    Farmland Value Increase in the Short-Term

    In the last couple of years, despite interest rate hikes that have increased the cost of funding for farmland purchases, the demand for agricultural land and farm profitability have remained strong. Strong demand, coupled with a limited supply of agricultural land, average agricultural land prices soared by 7.7% in 2023, according to the USDA.

    Recent record-high farmland value increases in the Corn Belt region have sparked discussions about the seemingly slower increase in the southern region. While it is true that some Corn Belt states experienced 30% to 40% increases in farmland values over the past couple of years, examinations of broader regional changes and long-term trends present a different picture.

    Source: USDA NASS

    According to the USDA, since 2021, cropland values in the Southeast (Alabama, Florida, Georgia, South Carolina) and the Southern Plains (Texas and Oklahoma) have increased by 20% and 22%, respectively, making these increases comparable to those in the Corn Belt states (22%). Delta states (Arkansas, Louisiana, and Mississippi) experienced a 12% increase, falling short of other regions. Increases in pastureland values were more consistent across regions. Delta and Southeast states saw increases of 12% and 13% in pastureland values, similar to the 14% increase in the Corn Belt states. In the Southern Plains, pastureland values soared in 2023, reaching a 20% increase.

    Source: USDA NASS

    Farmland Value Increase in the Long-Term

    While some southern states may seem to lag behind in growth rates in the short term, long-term trends show robust growth for these states. Between 2014 and 2023, the Southern Plains states experienced the highest increase in cropland value (50%), while the Southeast and Delta states each saw a 40% increase. Cropland values in the Corn Belt states increased by 18% during the same period. Looking at pastureland, the dollar value per acre in the Delta states increased by 39%, followed by the Southern Plains (34%) and the Southeast (30%). Pastureland value in Corn Belt increased by 22% for the same period.

    Moving Forward

    While it is true that farmland value increases have been sluggish for some states in the South, production specialties and long-term trends should not be overlooked.

    For 2024, it is generally expected that farm profitability will decrease, especially for crop producers, adding downward pressure on cropland values along with high farmland loan interest rates. However, due to the limited supply of farmland and strong demand for agricultural land, it is expected that farmland values will remain steady or experience a slight increase.


    Kim, Kevin. “Farmland Value Trends in South.Southern Ag Today 4(24.3). June 12, 2024. Permalink

  • From Byproduct to Beef: Revolutionizing Cattle Feeding for Sustainability and Savings in the Southeast

    From Byproduct to Beef: Revolutionizing Cattle Feeding for Sustainability and Savings in the Southeast

    Supplemental feeding programs are a staple in beef cattle production systems. Something that is a constant battle is making it more economical. One sector of supplemental feeding is the use of byproduct supplemental feeds to achieve a more sustainable, yet economical way of production. Byproduct feeds are used throughout the southeastern US and include a wide variety of products. Availability of specific products is based on location. In the Southeast, some commonly used supplements include products from the processing of cotton, peanuts, soybeans, corn, ethanol and beer.         

    We surveyed beef cattle producers across the southeastern states including Alabama, Arkansas, Florida, Georgia, Kentucky, Louisiana, Mississippi, North Carolina, South Carolina, Oklahoma, Tennessee, Texas and Virginia. The survey received 142 responses. Of those responses, 99 indicated use of some type of supplementation for their grazing cattle. Furthermore, 50% of respondents who used supplementation were using byproduct feeds for supplementation while the other 50% were using commodity feeds for supplementation. The results indicated that producers use a variety of different products based on availability, storage facilities and time of year. The most common products used in the southeastern US are whole cottonseed, corn gluten feed, soybean hulls, dried distillers grain, cotton gin byproduct, and peanut hulls (Figure 1). 

    Cost is often a key difference between byproduct feed supplementation and commodity feed supplementation. Prices vary throughout the year depending on what products are being produced during that time. Current prices can be found on the USDA’s Agricultural Marketing Service’s National Grain and Oilseed Processor Feedstuff Reports. Considering the energy and protein concentration is important.  Knowing what your herd needs and finding a product that fits those needs will lead to the best results. 

    The use of byproduct feeds for cattle is a promising way to promote both sustainability and economic gain in beef cattle production. By understanding the nutritional needs of your herd and the cost differences between products, producers can make decisions to benefit their operations. Our next step in this research is to analyze fertilizer value of feeding byproduct supplements to cattle on pasture. 

     Figure 1: Survey Results of Byproduct Feed Use by Southeastern Producers


    St. Andrew, Lauren. “From Byproduct to Beef: Revolutionizing Cattle Feeding for Sustainability and Savings in the Southeast.Southern Ag Today 4(24.2). June 11, 2024. Permalink

  • Ag Export Percentages: A Focus on Corn, Soybeans, and Wheat

    Ag Export Percentages: A Focus on Corn, Soybeans, and Wheat

    U.S. exports can be a key driver for commodity prices. U.S. production of corn, soybean, and wheat exceeds domestic use, making access to export markets crucial. Data from 2018/19 to 2022/23 shows that corn, soybean, and wheat exports are dominated by a few key countries. For corn, the United States, Brazil, Argentina, and Ukraine constitute 85% of global exports (Figure 1). For soybeans, Brazil is the largest exporter followed by the United States and Argentina; together, the three countries account for 90% of soybean exports (Figure 2) and 84% of soybean meal exports. Wheat exporting countries are more diversified, with the United States, Russia, the EU, Canada, Australia, Ukraine, and Argentina making up 84% of the market (Figure 3).

    In 2022/23 Brazil overtook the United States in corn exports and is expected to remain the largest export competitor to the United States. In the 2022/23 marketing year, Brazilian soybean exports nearly doubled those of the United States, and Brazil is projected to maintain its role as the worlds largest exporter of soybeans. In 2023/24, Brazilian exports are estimated at 50 million metric tons (MMT) of corn and 102 MMT of soybeans. Brazilian export projections for 2024/25 are at 49 MMT of corn and105 MMT of soybeans. In comparison, the United States is estimated to export slightly more corn at 55 MMT and 46 MMT of soybeans in 2023/24. 2024/25 U.S. export projections are at 56 MMT of corn and 50 MMT of soybeans. Wheat export patterns have remained relatively stable, despite geopolitical conflicts affecting some regions. The largest question for 2024/25 wheat exports pertains to Russia, which is experiencing weather-driven yield and quality issues in addition to the war with Ukraine.

    Export data is vital for commodity marketing. Weekly, the USDA Foreign Agricultural Service reports sales transactions entered into with a buyer outside the United States. In addition to the weekly reporting requirements, daily reports to USDA FAS are required for any export sales activity of quantities totaling 100,000 metric tons or more of one commodity sold in one day to one destination or 200,000 metric tons or more of one commodity sold to one destination during any reporting week. Positive U.S. export bookings support domestic commodity prices. If exports exceed projections or expectations, prices will typically rise, offering a potential opportunity for producer sales. 

    Weather events in other major exporting countries, particularly in South America, can signal support for prices and provide opportunities for increased U.S. commodity sales, especially for corn and soybeans. Wheat can be less sensitive to weather as wheat is produced on six continents in both hemispheres, so production is spread throughout the calendar year. Wheat can be strongly influenced by geopolitical and weather events, making it harder to predict specific timing for market changes. 

    Exchange rates can also affect exports. The strengthening of the USD, relative to the export competitor’s currency, can make U.S. exports relatively more expensive to an importer. A weakening USD makes U.S. exports more competitive.

    The competitiveness and small number of countries in export markets, particularly Brazil and Argentina in corn and soybeans, along with the past relative stability in wheat exports underscores the importance of monitoring both export trends and external factors to optimize commodity marketing strategies.

    Figure 1: World Corn Exports by Country, 2018/19-2022/23 Marketing Years Average (%)

    Figure 2: Soybean Exports by Country, 2018/19-2022/23 Marketing Year Average (%)

    Figure 3: World Wheat Exports by Country, 2018/19-2022/23 Marketing Year Average (%)

    References

    USDA Foreign Agricultural Service. Production, Supply and Distribution.https://apps.fas.usda.gov/psdonline/app/index.html#/app/advQuery.

    USDA Foreign Agricultural Service. Export Sales Reporting Program. https://fas.usda.gov/programs/export-sales-reporting-program and https://apps.fas.usda.gov/export-sales/esrd1.html.

    Gardner, Grant. “Ag Export Percentages: A Focus on Corn, Soybeans, and Wheat.Southern Ag Today 4(24.1). June 10, 2024. Permalink