Tariffs and trade have been a big topic across the economy and agriculture. In the lamb industry, tariffs have been controversial, with producers on both sides questioning their necessity. The lamb industry is a smaller agricultural sector in the U.S. but one in which there has been some growth in the South, particularly since the introduction of hair sheep breeds.
Some Historical Context
Lamb imports have been a controversial topic for many years. Surging imports in the early 1990s led to investigations by the U.S. International Trade Commission (USITC) on unfair trading practices by Australia and New Zealand. Tariffs, as a remedy for rising imports, were not imposed and domestic production continued to decline. (As an aside, part of my PhD dissertation research, longer ago than I would like to admit, looked at the potential impact of a 10 percent tariff on imported lamb). By 2006, imports exceeded domestic production. In 2024, lamb and mutton imports amounted to about 70 percent of total supplies on the U.S. market.
Almost all, over 99 percent, of imported lamb and mutton comes from Australia and New Zealand. About 75 percent of imports are from Australia. New Zealand has made up a declining share of U.S. imports over time. In 2024, about 85 percent of the total product coming in was lamb and the rest mutton.
This Year
The lamb industry in the U.S. is evolving with the growth of non-traditional markets and some growth in demand. Increasing production in recent years is linked to grazing solar properties where the economic incentive for growth is on the grazing services side and not necessarily driven by meat demand.
Compared to record imports in 2024, monthly imports in 2025 have been mixed. Imports tend to peak in Spring as Easter and other holiday driven demand boosts prices. This year was no exception as imports peaked in April with Easter falling on April 21st. A 10 percent tariff on goods from Australia and New Zealand began in early April. Imports declined in May and June compared to the historically high levels in 2024.
Can we attribute the decline in imports to the tariff? It’s probably not that easy. The lamb market makes a great illustration that other market factors may be more important than tariffs. Imports tend to decline seasonally after Easter. Relative prices in the trading countries are also important. Lamb prices have been rising in Australia and recently hit record highs for live lambs. Leg of lamb prices for comparable Australian and U.S products indicates that Australian prices have been rising relative to U.S. prices since 2024. Relatively more expensive Australian lamb would likely reduce some imports. The U.S. dollar has been weakening versus the Australian dollar over the last 4 months which should also lower imports. All of these things, along with the new tariff, are impacting lamb imports.
A lot of other questions remain about tariffs on lamb. Is this tariff high enough to help the domestic industry and what would be an effective tariff? How much would higher tariffs hurt consumption? If tariffs resulted in higher lamb prices for producers, would we respond by producing more lamb and causing prices to decline? The impact of tariffs will be interesting to watch approach next spring.
U.S. agricultural producers use hired farm labor for field crops, livestock, and nursery operations, for grading and sorting of agricultural products, for supervisory roles, and other areas. According to USDA’s Economic Research Service (ERS), mechanization led to greater productivity and a reduction in the need for labor, both self-employed farm operators (including family members) and hired workers, from 1950 to 1990. Since 1990, however, U.S. employment of agricultural workers has stabilized. For the 1950 to 1990 period, labor from self-employed and family members experienced a greater decline (74 percent) than hired farm labor (51 percent reduction). Even though hired farm labor comprises only one percent of all U.S. wage and salary workers, hired labor is important for agriculture to succeed (USDA/ERS, 2025).
Table 1 contains census of agriculture data for the number of hired farm laborers and farms with hired farm labor from 2012 to 2022, along with the ten-year average change for the southern states. There should be no surprise that all southern states have witnessed a decrease in both workers and farms with hired farm labor (for Maryland, the number of farm workers is essentially flat, but farms with hired labor are declining). Kentucky leads in the loss of hired farm labor over the ten-year average at -23.2%, followed by Oklahoma (-18.1%). Kentucky also leads in the decrease in the number of farms with hired farm labor at -18.7%, followed by Mississippi (-16.6%). For Kentucky during this timeframe, there was a shift away from tobacco production, a highly labor-intensive crop. Florida and Georgia have lost the fewest workers as measured by the ten-year average (USDA/NASS, 2025a). The prevailing reasons for the decrease in hired farm labor are the aging of the farm workforce, the lack of new immigrants entering agriculture, the displacement of labor by technology and machinery, costs, a lack of interest, and a preference for a better life-work balance.
Table 1. Number of Hired Farm Laborers (Workers) and Farms with Hired Farm Labor for Selected Southern States
2012
2017
2022
2012-2022 Ave Δ
State
Workers
Farms
Workers
Farms
Workers
Farms
Workers
Farms
Kentucky
68,586
19,586
52,701
16,530
40,464
12,939
-23.2%
-18.7%
Oklahoma
51,119
18,108
42,431
16,794
34,323
13,181
-18.1%
-14.4%
Mississippi
32,307
10,581
27,166
9,105
21,936
7,345
-17.6%
-16.6%
N. Carolina
78,012
14,469
67,496
12,492
55,536
10,464
-15.6%
-14.9%
Virginia
46,561
12,718
39,657
10,954
33,719
8,969
-14.9%
-16.0%
Alabama
32,948
11,216
26,136
9,881
24,228
7,850
-14.0%
-16.2%
Texas
160,392
56,401
143,763
50,892
120,468
40,327
-13.3%
-15.3%
Tennessee
42,737
15,071
40,056
14,170
32,240
11,222
-12.9%
-13.4%
Louisiana
26,632
7,838
23,019
6,789
20,863
5,951
-11.5%
-12.9%
S. Carolina
23,398
5,851
20,938
5,254
18,730
4,449
-10.5%
-12.8%
Arkansas
33,104
11,715
29,047
10,373
28,162
9,051
-7.7%
-12.1%
Georgia
51,156
12,258
48,972
11,737
44,537
9,891
-6.7%
-10.0%
Florida
107,192
13,291
96,247
12,207
96,588
11,680
-4.9%
-6.2%
Maryland
14,705
3,536
15,143
3,410
14,820
2,992
0.4%
-7.9%
Source: Censuses of Agriculture
The 2022 agriculture census indicates that hired farm labor ranked third in a ranking of production expenses for southern states, preceded by feed purchases and livestock and poultry purchased/leased (see Menard SAT “Census of Agriculture Production Expenses for Southern States, 11/11/24). For all farms, data from the most recent agriculture census indicate that wages and salaries plus contract labor are 12 percent of production expenses. However, this percentage increases to 42 percent for greenhouse and nursery operations and 40 percent for fruit and tree nut operations. For immigrant labor costs in dairies and nurseries, costs as a share of gross revenues are near their 20-year highs. Hired farm labor wages vary by state and farm region. For 2024, the hourly wage rates for hired farm labor in the southern states range from $15.25 (Arkansas, Louisiana, and Mississippi) to $19.15 per hour (Maryland). For that same timeframe, hired farm labor ranges from $14.86 to $18.13 per hour for crop operations and $14.73 to $17.51 per hour for livestock operations (USDA/ERS, 2025; USDA/NASS 2025a & 2025b).
For 2022, the most common agriculture operation type for each state where hired farm labor was utilized is indicated in Table 2. The table also provides information for each state on the operation type having the largest hired farm labor production costs. For example, beef cattle (NAICS 112111) farming was the most common operation type for hired farm labor in Alabama, Kentucky, Oklahoma, Tennessee, and Texas. Greenhouse, nursery, and floriculture production operations had the highest hired farm labor production costs for Alabama, Florida, Maryland, North Carolina, South Carolina, Tennessee, and Virginia.
Table 2. Most Common Operation Type for Hired Farm Labor and Largest Hired Farm Labor Production Costs for Selected Southern States, 2022
State
Most Common (NAICS)
Largest Production Costs (NAICS)
Alabama
Beef Cattle (112111)
Greenhouse, Nursery, & Floriculture Production (1114)
Arkansas
Oilseed & Grain Crops (1111)
Oilseed & Grain Crops (1111)
Florida
Greenhouse, Nursery, & Floriculture Production (1114)
Greenhouse, Nursery, & Floriculture Production (1114)
Georgia
Fruit & Tree Nut Farming (1113)
All Other Crop Farming (11194/11199*)
Kentucky
Beef Cattle (112111)
Other Animal Production (1129**)
Louisiana
Oilseed & Grain Crops (1111)
Oilseed & Grain Crops (1111)
Maryland
Greenhouse, Nursery, & Floriculture Production (1114)
Greenhouse, Nursery, & Floriculture Production (1114)
Mississippi
Oilseed & Grain Crops (1111)
Oilseed & Grain Crops (1111)
N. Carolina
Greenhouse, Nursery, & Floriculture Production (1114)
Greenhouse, Nursery, & Floriculture Production (1114)
Oklahoma
Beef Cattle (112111)
Beef Cattle (112111)
S. Carolina
Vegetable & Melon Farming (1112)
Greenhouse, Nursery, & Floriculture Production (1114)
Tennessee
Beef Cattle (112111)
Greenhouse, Nursery, & Floriculture Production (1114)
Texas
Beef Cattle (112111)
Beef Cattle (112111)
Virginia
Greenhouse, Nursery, & Floriculture Production (1114)
Greenhouse, Nursery, & Floriculture Production (1114)
*Hay and peanut farming**Horse/equine productionSource: Censuses of Agriculture
There are a couple of interesting trends moving forward that may affect southern states and the use of hired farm labor. Long-distance migrations from home to work are declining —farmworkers are more settled. Fewer farmworkers are pursuing the seasonal follow-the-crop migration. Also, women as farmworkers is an increasing trend. (USDA/ERS, 2025; USDA/NASS, 2025a).
Reference
USDA Economic Research Service (ERS). 2025. “Farm Labor.” Available at https://www.ers.usda.gov/topics/ farm-economy/farm-labor.
USDA National Agricultural Statistical Service (NASS). 2025a. Census of Agriculture Reports. Available at https://www.nass.usda.gov/AgCensus/index.php.
USDA National Agricultural Statistical Service (NASS). 2025b. “Quick Stats.” Available at https://quickstats.nass.usda.gov/
Over the past five years, the number of data centers has doubled in the U.S. The U.S. currently accounts for roughly 54 percent of total global data center capacity. The number of data centers will only grow in the U.S. over time as we see more computing turning to artificial intelligence-based systems. These data centers can bring economic benefits to the local economy but can also create additional problems in the areas where they are built. If states make a push for data centers to develop in an area, this can increase power needs within that area, which will lead to increased infrastructure needs (such as transmission lines) to support the power needs of these data centers. New transmission lines may target your property. With that in mind, let’s talk about what eminent domain is, why power companies have the right to utilize it, and what landowners should consider when presented with a notice.
The power of eminent domain comes from the U.S. and state constitutions, which allow governments or companies that have been granted eminent domain power by the government to take private property for public use, with just compensation. The law requires owners to be paid fair market value. State legislatures often provide the power of eminent domain for easements to certain entities that provide a public service. These private entities are frequently electric, gas, and cable companies. When the use of eminent domain results in an easement being taken for a transmission line, the analysis of just compensation will depend on the impact on the property from the taking. This is often not an easy analysis and will require experts to determine the impacts on the dominant estate.
This entire process is driven by state law; it’s hard to do a basic overview for that reason. What should landowners do when presented with notices that their land might be in a proposed transmission line path? First, do not delay responding to the request, and look for competent legal representation with experience in eminent domain actions. You can also talk to neighbors or other trusted advisors to get ideas on reasonable attorneys in your area. An eminent domain attorney will understand how to assist you in intervening in any state processes to determine the route, understand the experts needed to help determine fair market value when looking at the value of the easement, and assist in drafting terms to protect the land in the easement document.
No one wants to get the notice in the mail that their property might be taken for a transmission line easement. As we continue to see states make pushes for the development of data centers, we may see a rise in the need for increased transmission lines. Not sitting on the notice and talking to attorneys early can help you better protect your rights. At the same time, it will reduce your stress and, hopefully, let you keep doing what you enjoy doing on your property.
Historically, tobacco has been an important crop in several U.S. southern states. However, due to a variety of factors, including health issues surrounding the crop, international competition, and policy/regulatory changes, the U.S. tobacco industry has declined by nearly 70% over the past 25 years.
A previous article in Southern Ag Today, highlighted some of the major structural changes following the elimination of the federal tobacco program (better known as the tobacco buyout) in 2004. Another important part of the modern day tobacco story that has not received much attention has been the significant “investment” dollars made available for tobacco farmers and rural communities evolving from tobacco’s Master Settlement Agreement (MSA).
In 1998, 46 state attorney generals signed the MSA with the major U.S. tobacco companies to settle state lawsuits to recover health care costs associated with treating smoking-related illnesses. [1] To date, the MSA represents the largest civil lawsuit settlement in U.S. history.
Under the MSA, tobacco manufacturers agreed to make annual payments to the settling states into perpetuity, as long as cigarettes are sold in the United States. While encouraged to use these funds for tobacco cessation, tobacco control, and other health-related issues, participating states were given complete control over how to use these settlement funds. Most state governments have used these funds over the past 25 years for at least a portion of public health care expenses, but many states have opted to distribute these funds for other state priorities including funding for education, childhood development, infrastructure investment, and balancing state budgets. Given the significant impact of the MSA on tobacco economies and rural communities, three traditional tobacco-producing states, Kentucky, North Carolina, and Tennessee have elected over the years to use a significant share of their MSA dollars to fund ag diversification in their state’s farm economy.
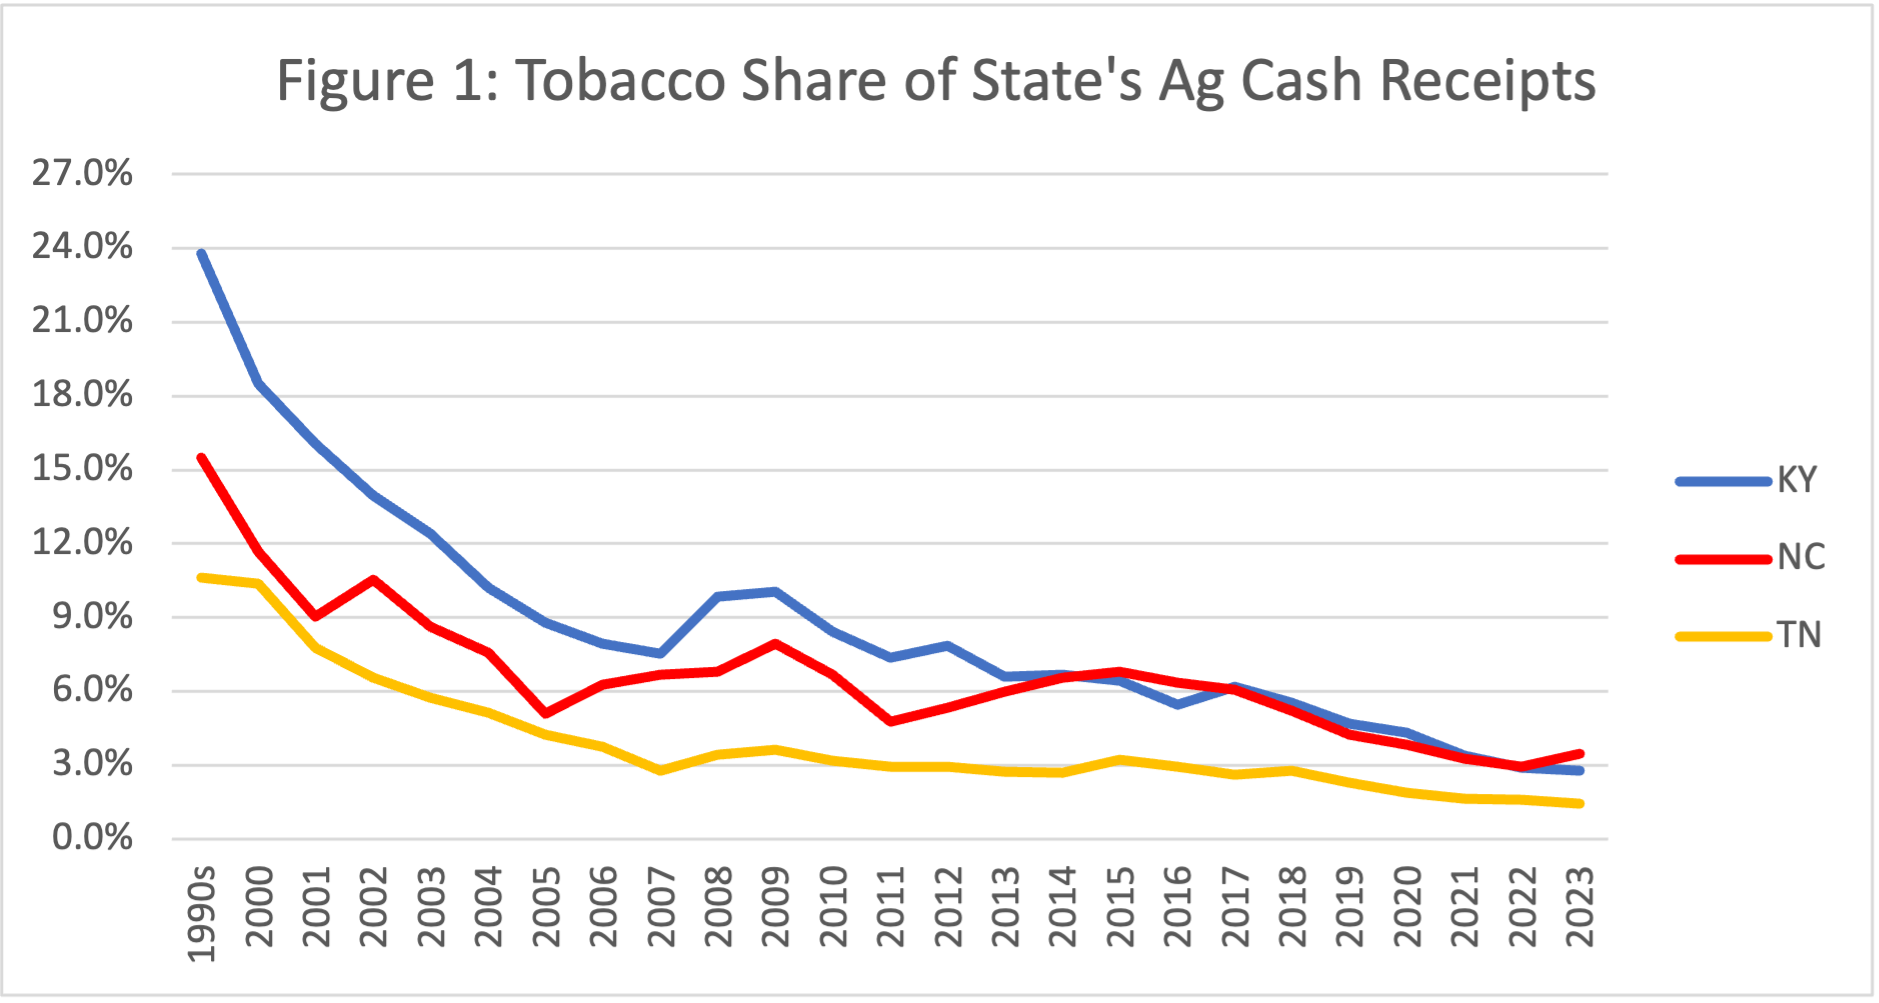
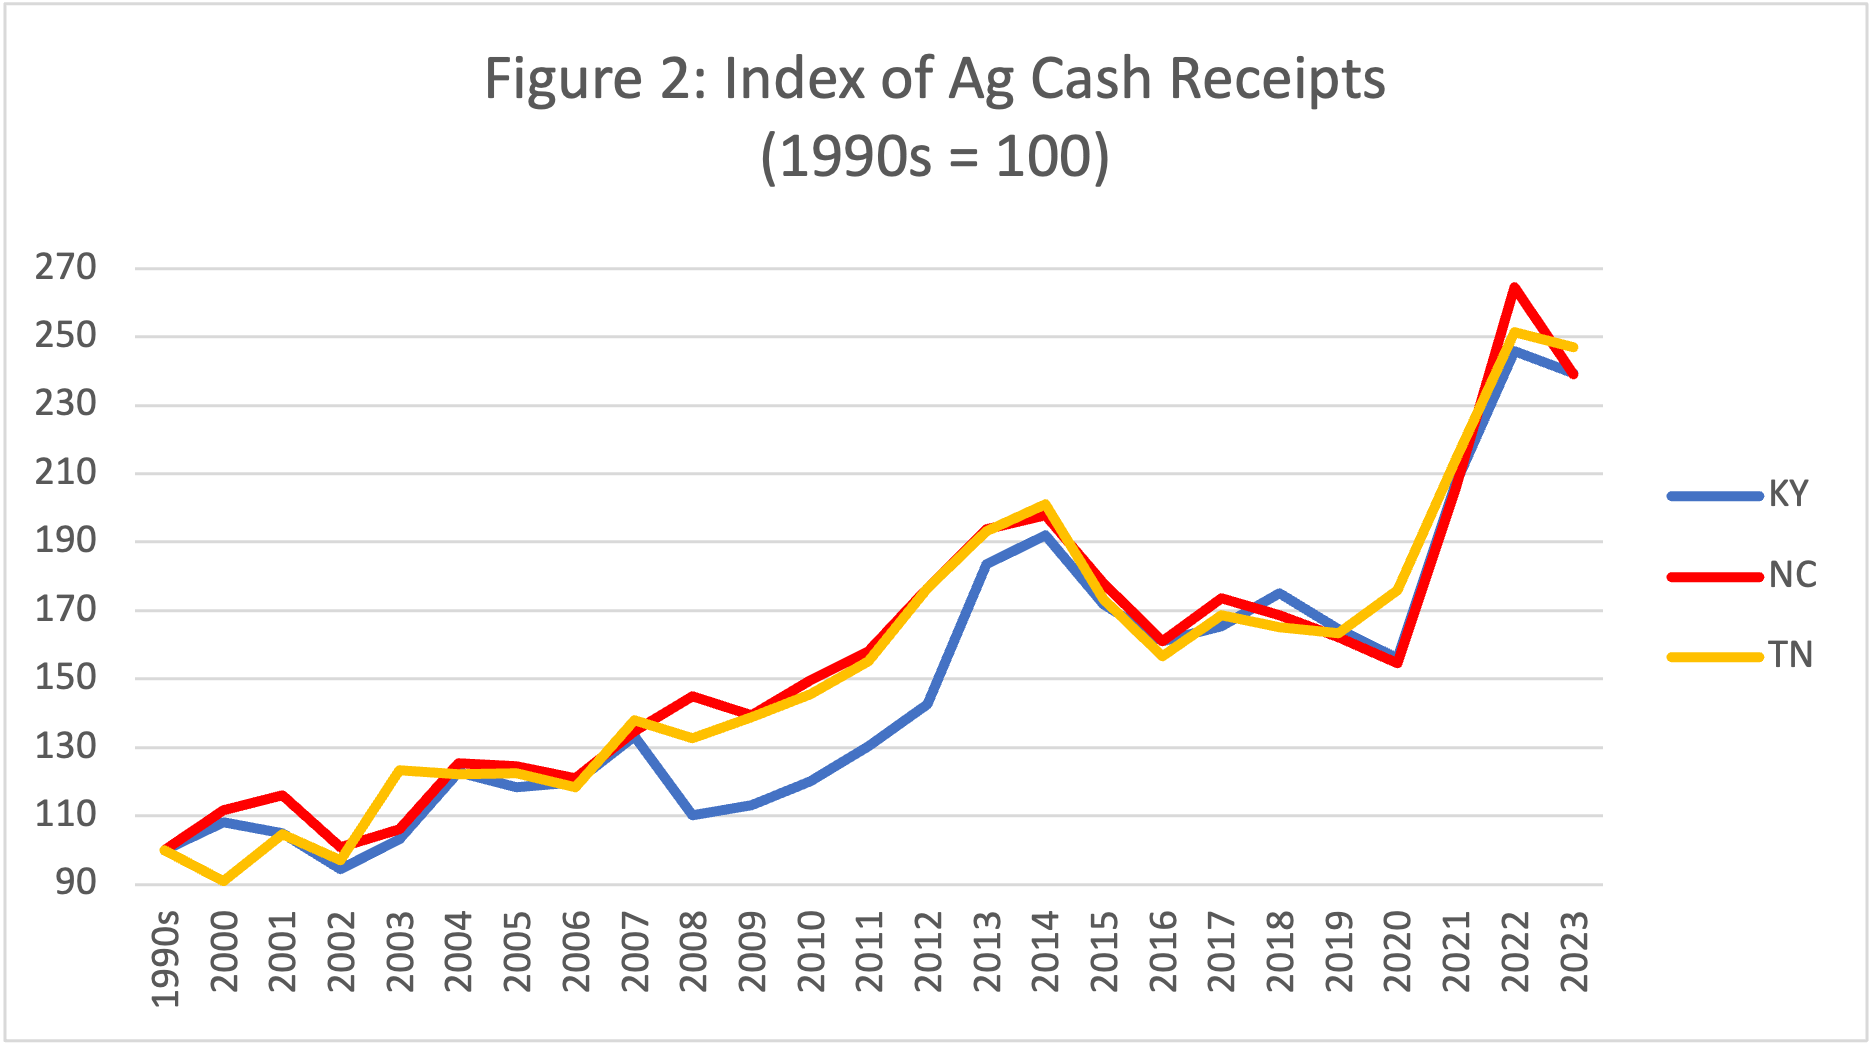
During the 1990s, tobacco accounted for 24% of Kentucky ag cash receipts, 16% in North Carolina, and 11% in Tennessee – representing the number one cash crop in each state (Figure 1). Since the 1990s, tobacco cash receipts in Kentucky have declined by 72%, compared to a 66% loss in Tennessee and a 47% loss in North Carolina. However, ag cash receipts have more than doubled in all three states on a nominal basis since 2000 (Figure 2) and are up around 30% when adjusted for inflation. Tobacco now accounts for only around 3% of ag cash receipts in Kentucky and North Carolina and less than 2% in Tennessee.
Given the magnitude of the tobacco losses, the growth in ag cash receipts in these historically tobacco-dependent states has been very impressive. Imagine the outcome of any state’s ag economy losing over half of its top ag enterprise such as a mid-western state experiencing a greater than 50% reduction in their grain sales or a Wisconsin losing over half of its dairy receipts. Not only have ag cash receipts increased substantially in North Carolina, Kentucky, and Tennessee over the past 25 years, but ag sales in these three tobacco states have actually increased on a percentage basis more than the aggregate receipts in the remaining eleven states in the Southern region since 2000. Arguably, access to these diversification funds evolving from the MSA (along with tobacco buyout dollars) have contributed greatly to this growth in the ag economies in these major U.S. tobacco states.
North Carolina has had two entities that have accessed MSA funds over the past 25 years to support agriculture and its tobacco-dependent rural communities — the North Carolina Tobacco Trust Fund and the Golden LEAF Foundation. The Kentucky Agricultural Development Fund (KADF) also recently celebrated 25 years of existence of providing 50% of their MSA dollars to agriculture, while the Tennessee Agriculture Enhancement Program )TAEP) have utilized a portion of these MSA funds to support ag diversification since 2005. In aggregate, these entities have invested more than one billion dollars of MSA dollars among tobacco producers and their rural communities over the past 25 years, covering more than 100,000 projects. These projects are all over the board, including funding alternative ag enterprises, farm and rural community infrastructure, programs supporting beginning farmers, improving crop and livestock marketing/management, investing in regional and local food markets, agritourism, food processing, ag education, workforce development, leadership and ag promotion programs along with a host of other initiatives to help offset tobacco incomes in tobacco-dependent regions in the South.
[1] Florida, Minnesota, Mississippi, and Texas were not signatories to the MSA as they had their own individual settlements with U, S. tobacco companies.
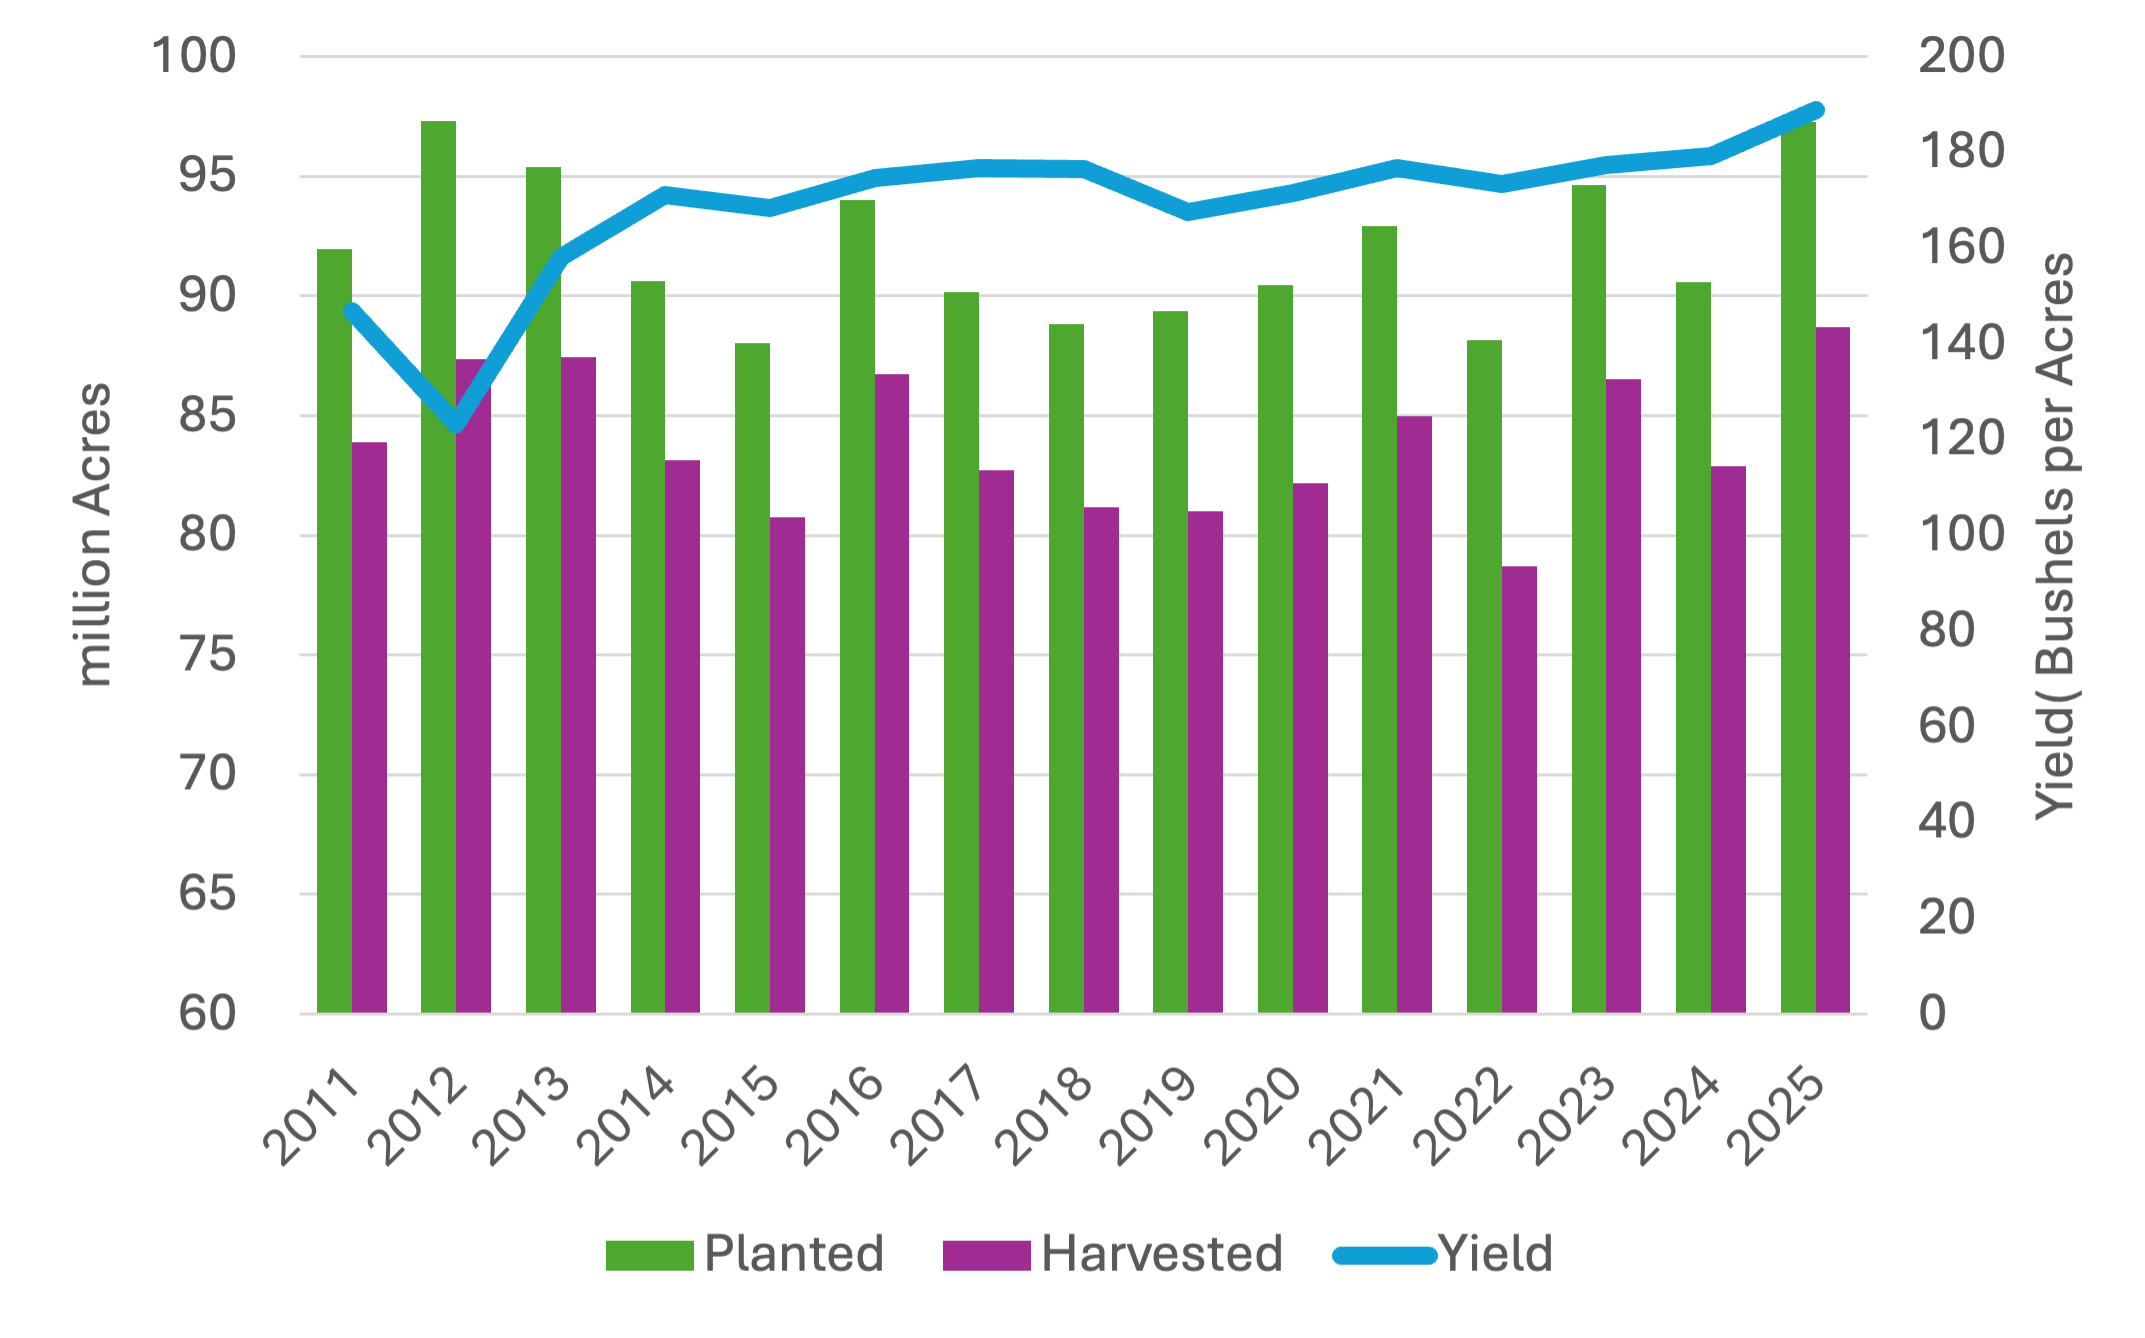
All summer, much of the corn market conversation has focused on how strong the corn crop looks nationwide and the potential for a record-breaking harvest. The August WASDE, the first report of the year to incorporate yield estimates from the National Agricultural Statistics Service, confirmed that outlook. National corn yield was pegged at a record 188.8 bushels per acre, up 7.8 bushels from July. An additional 1.9 million harvested acres also pushed production to a forecasted 16.7 billion bushels, 1.4 billion more than the previous record set in 2023. While total U.S. corn use was raised to 16.0 billion bushels, the larger supplies still left the market facing the largest ending stocks since 2018 at 2.1 billion bushels. With that surplus, USDA trimmed the season-average price to $3.90 per bushel.
While corn is setting new supply records, soybean estimates were far less dramatic. USDA trimmed harvested area from 82.5 million acres to 80.1 million, but a higher yield estimate of 53.6 bushels per acre offset much of that reduction. As a result, 2025 production is forecast at 4.29 billion bushels. Lower supplies and sluggish export sales led USDA to cut export projections by 40 million bushels. Even so, the soybean balance sheet did tighten slightly, with ending stocks lowered by 20 million bushels to 290 million.
Cotton’s supply outlook shifted sharply this month, with USDA cutting production estimates by 10 percent. Planted acres are now pegged at 9.28 million, down 9 percent from July. Persistent dryness in the Southwest pushed the abandonment rate higher, leaving harvested acres at 7.36 million. With more abandoned low-yield acres removed from the mix, the yield estimate rose to 862 pounds per acre. However, the acreage losses outweighed the yield gains and pulled production down to 13.21 million bales, 1.4 million fewer than last month. Exports were trimmed by 0.5 million bales, and ending stocks are now projected at 3.60 million bales, a reduction of 1 million from July.
Overall, the latest WASDE report paints a mixed picture across key row crops. Corn is poised for a record harvest with ample supplies putting downward pressure on prices, while soybeans show modest tightening of the supply and demand situation. Cotton faces reduced acreage and production. As harvest progresses, market participants will be closely watching export demand and weather developments during harvest, which will play critical roles in shaping prices and supply dynamics through the rest of the year.
Figure 1. U.S. Corn Yield, Planted Acres, and Harvested Acres, 2011–2025 (USDA – NASS)