Blog

  • Ground Beef Now or Calves in 2026?

    Ground Beef Now or Calves in 2026?

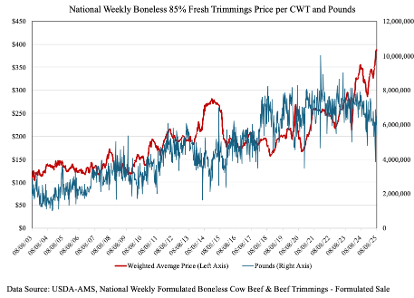
    Tight supplies and strong demand are driving all types of cattle to record price levels, including cull cows. The national direct dressed price for 85 percent lean (boner cows) cull cows topped $300 per CWT last week for the first time in history. At local auctions across the southeast, cull cow prices are topping $160, $170, $180, and occasionally even $190 per cwt, depending on type. Ground beef demand has been strong and is the product most closely associated with lean trim from cull cows. Average U.S. retail ground beef prices topped $6 per pound in June for the first time ever, according to data from the Bureau of Labor Statistics. 
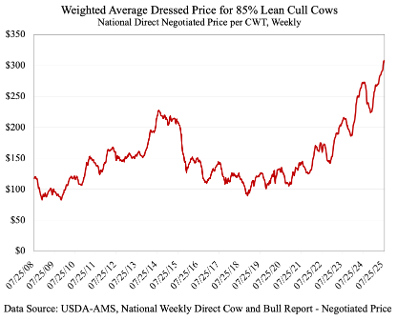
    The chart below displays the price of 85 percent fresh trimmings and the pounds sold over time. This series is not comprehensive of all trims since it is just looking at formula sales for 85 percent trim and not any other percentages or sales type. However, the chart is interesting in that it highlights the inverse relationship between price and quantity. The declining availability of 85 percent trim over the past year has corresponded with sharp increases in price. This is driving the sharply higher dressed cow prices and local auction prices for cull cows. 

    Imports are a key piece of this puzzle. Beef imports are up sharply this year amid the high U.S. domestic prices. The majority of imports are lean trim that will be mixed with the fattier trim produced by domestic fed steers and heifers to make ground beef. Recent changes in tariffs will have impacts on lean trim. Brazil was the top import source for the first half of 2025, but the tariff on beef from Brazil jumped to 76 percent last week, which is sure to lead to significant reductions for as long as the tariff is in place. Meanwhile, the percentage of those imports that were lean trim will need to be filled by other import sources or domestic lean trim (i.e., cows and bulls). This is a good example of how tariffs and trade flows can impact domestic prices and supplies.

    This all leads to an important discussion about cow herd expansion. Producers making culling decisions ahead of winter will be tasked with navigating the value of the cow as a cull cow vs their expected value in producing a calf next year. As the value of domestic lean trim increases, cull cow prices also increase. There will be some producers who would not have culled cows at $150 per CWT, but will cull cows if they are able to get $200 per CWT, if their expected value of calves in 2026 is unchanged. These decisions are all interconnected. In the absence of much heifer retention, it is possible that surging cull cow values could slow expansion efforts further. 

    Maples, Will. “Ground Beef Now or Calves in 2026?” Southern Ag Today 5(33.2). August 12, 2025. Permalink

  • USDA’s Livestock Risk Protection Program Use Keeps Increasing

    USDA’s Livestock Risk Protection Program Use Keeps Increasing

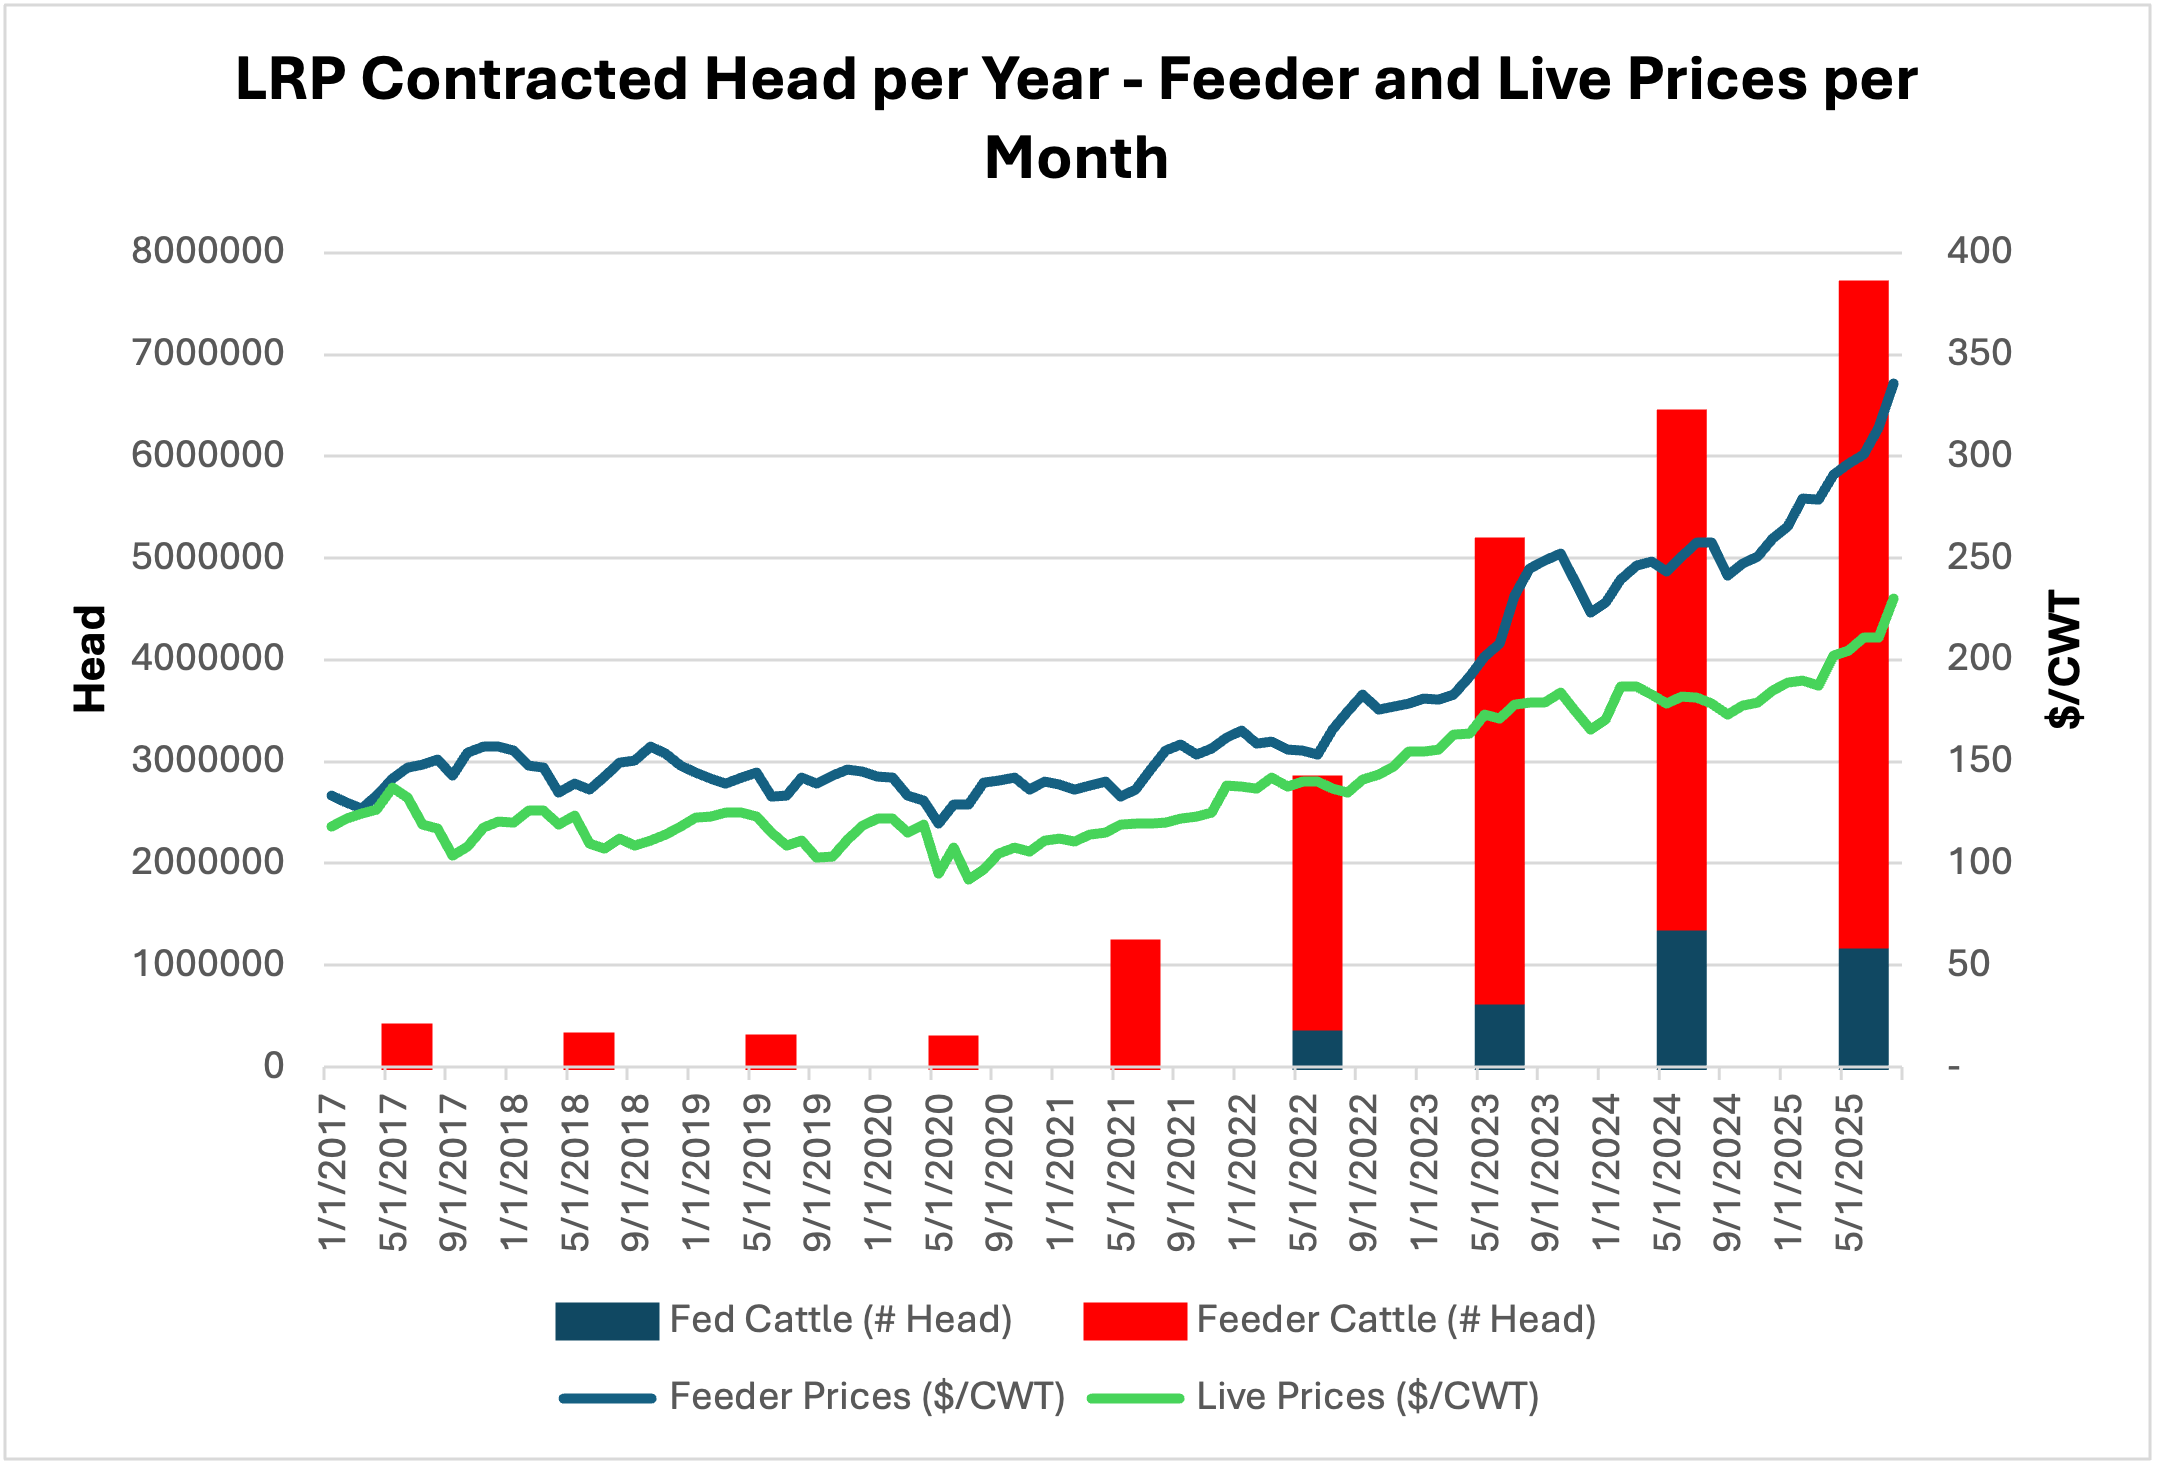
    Producers across the United States, particularly in the Southern states, are increasingly adopting the Livestock Risk Protection Program (LRP) despite a strong market and high premiums. Originally designed to protect ranchers against declining cattle prices, the LRP has experienced significant growth. The number of head covered under the program has increased from just 71,000 in 2017 to 7.5 million by July 2025. In 2024, ranchers insured prices for 6.2 million head, a notable increase from 4.97 million in 2023. This increase corresponds with changes made to the LRP program by the USDA and the substantial improvement in market prices for feeder and live cattle (see Figure 1).

    The increase in cattle prices, coupled with the narrowing margins for stockers and feedlot operations, highlights the need to implement effective price risk management strategies. The LRP helps minimize financial losses, secure profit margins, and reduce the risk of business failure, especially considering higher investment levels. The higher adoption of the LRP indicates a growing number of ranchers are integrating price risk management plans to protect their operations. By establishing a floor price for their cattle, these ranchers significantly lower the risk of business failure.

    Figure 1: LRP Usage and Prices

    In the summers of 2019 and 2021, the USDA implemented several modifications to the Livestock Risk Protection (LRP) program that contributed to this growth. These changes not only reduced the premiums ranchers had to pay but also allowed them to defer premium payments until the end of the endorsement period, making the program more accessible across all states and counties. 

    While LRP can be used to hedge many beef cattle categories, not every LRP animal category has increased at the same rate. Steer Weight 2 is the most commonly used category for price hedging. This category had an average weight of 854 pounds per head insured. So far in 2025, this category accounts for 42% of all transactions, which is slightly below the historical average of 46%. The second and third largest categories are Fed Cattle Steers & Heifers, which have a historical average weight of 1,480 pounds per insured head, and Heifers Weight 2, which have a historical average weight of 826 pounds. These two categories account for 20% and 17% of the historical transactions, respectively.

    Remarkably, the Unborn category has experienced significant growth this year. Unborn cattle represent 11% of the total number of head insured, well above the historical average of 6%. Historically, the Steers and heifers Category 1, including the Unborn category, accounts for 17% of all head insured. This past year, that proportion increased to 22%, thanks to the growth in unborn cattle.

    Figure 2: Beef LRP Usage per Animal Category

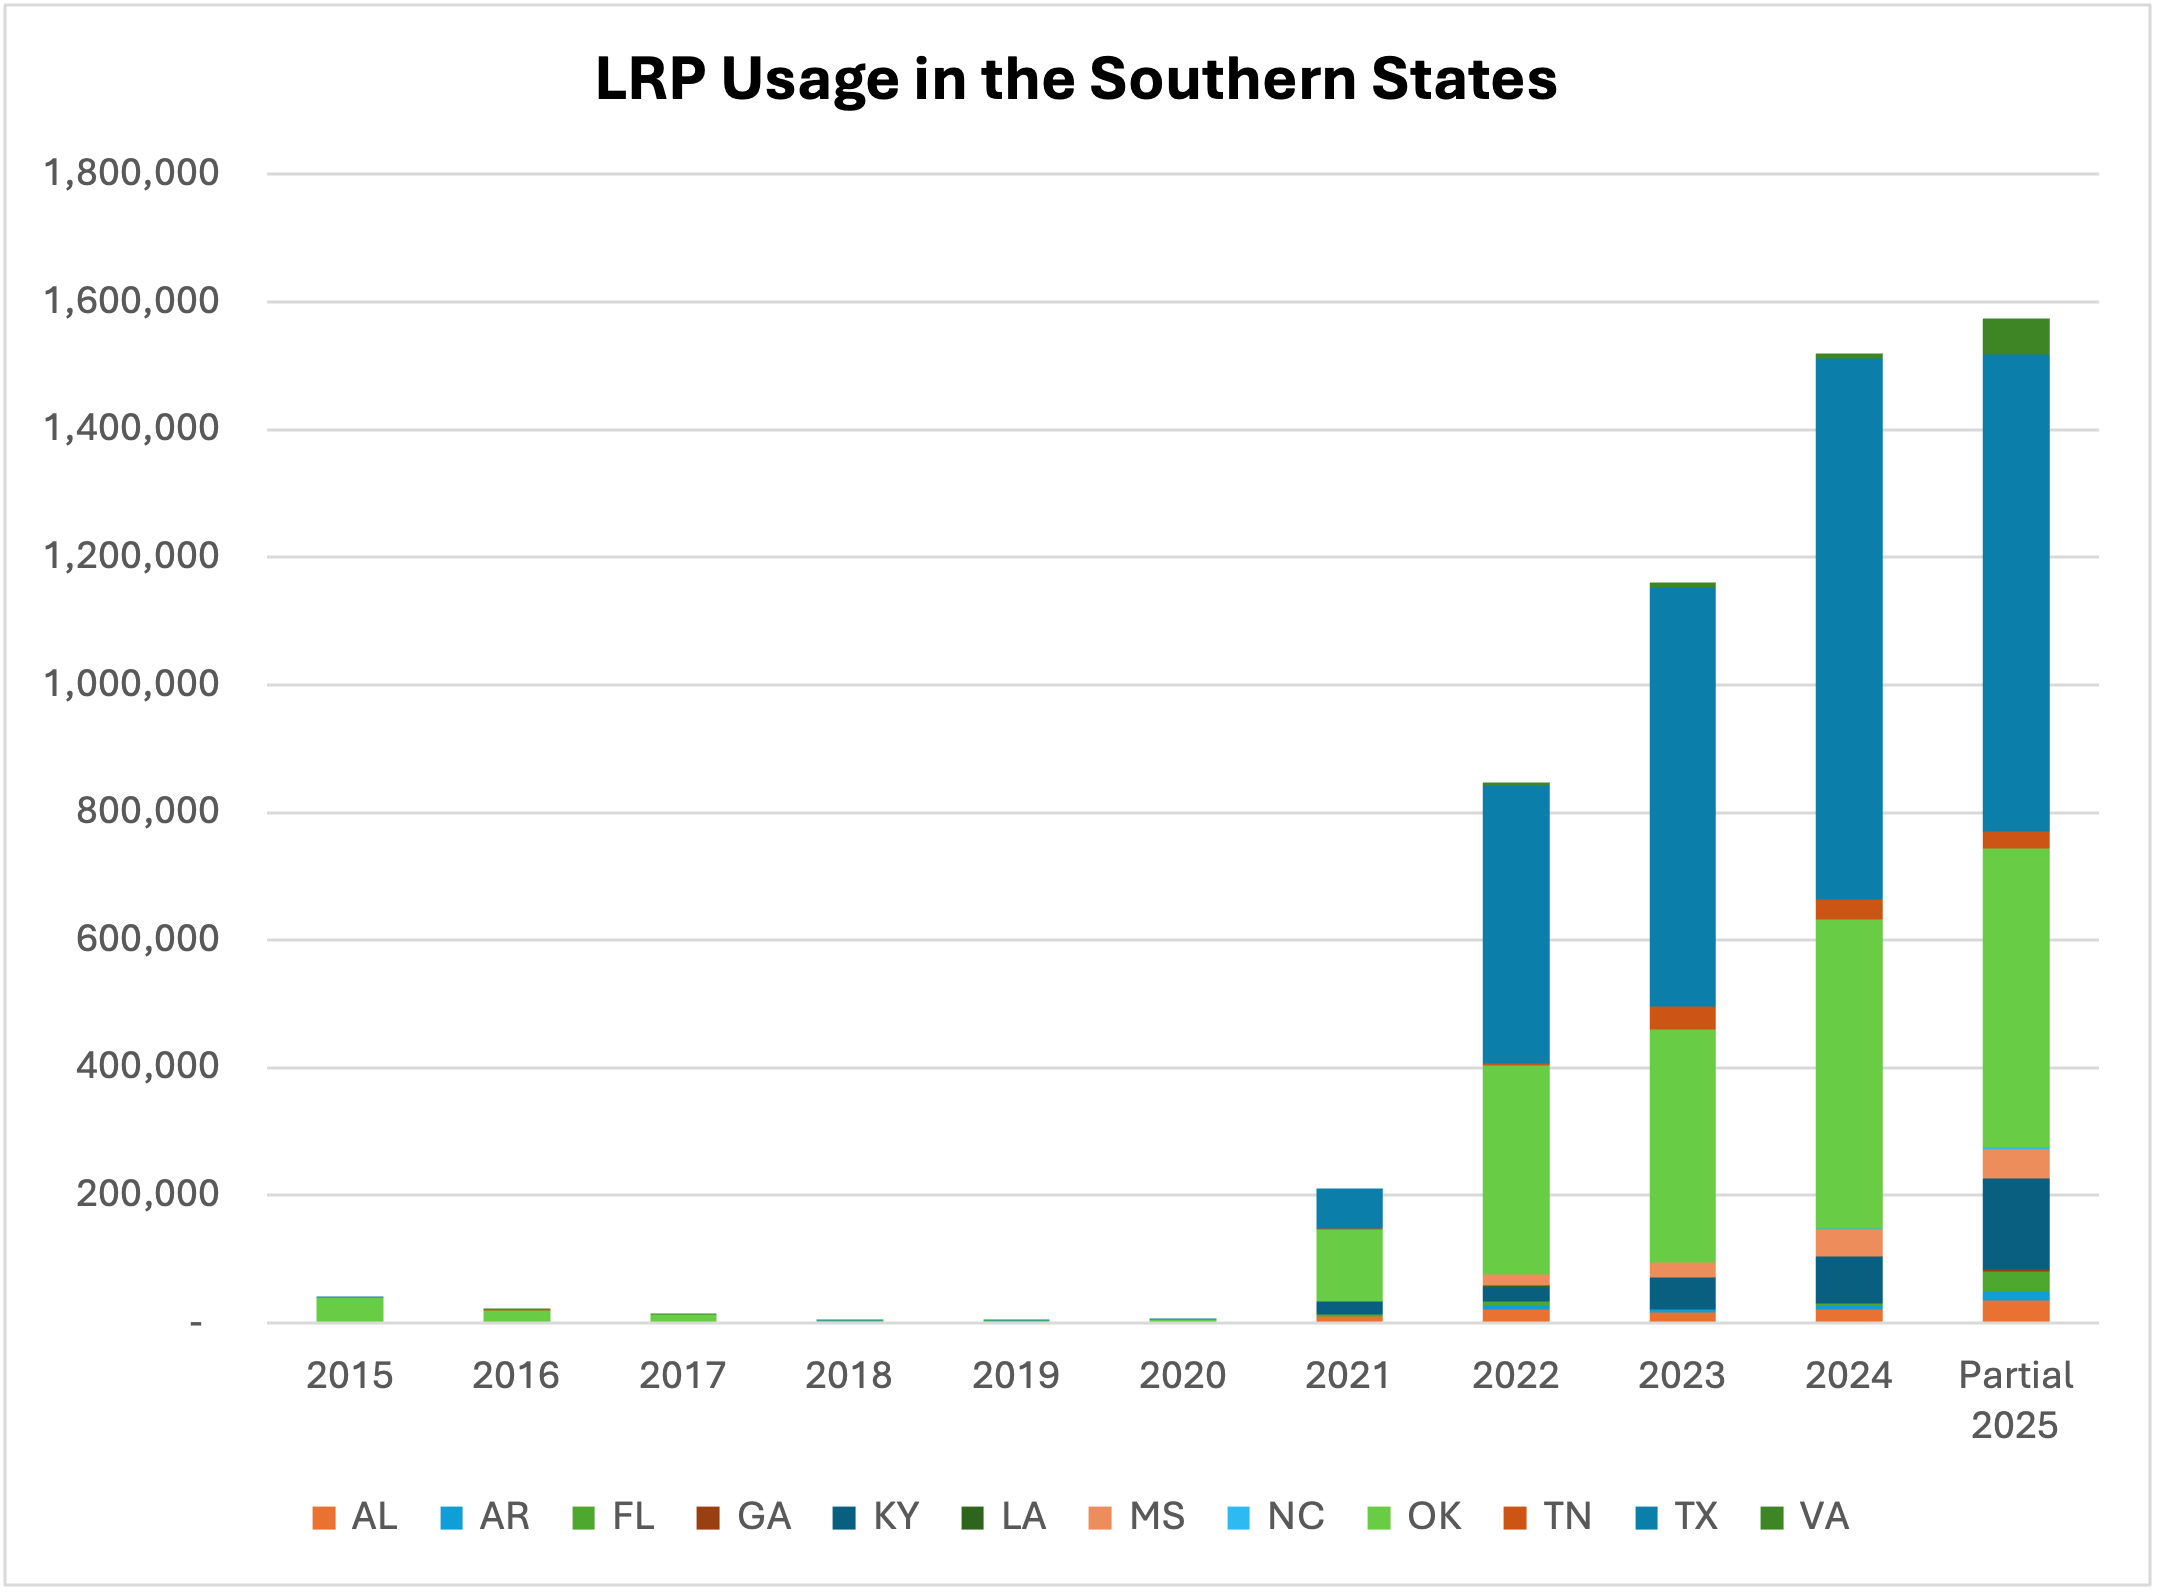
    Ranchers in the Southern region have also increasingly adopted the Livestock Risk Protection (LRP) program as an essential tool for managing price risks over the past five years (see Figure 3). As of July 2025, ranchers insured approximately 1.3 million head of cattle annually through the LRP program, with Texas and Oklahoma accounting for 47% and 30% of the total, respectively. However, in the past year, participation from Texas and Oklahoma has decreased compared to other Southern states. So far in 2025, these two states represent 77% of the total head insured in the Southern region, down from 88% participation in 2024.

    Figure 3: LRP Usage in the Southern States

    For more information on the LRP, consult the USDA Fact Sheet on Livestock Risk Protection for Fed Cattle. If you’re considering purchasing price insurance through this program, you can find a list of approved livestock agents and insurance companies on the USDA website.


    Abello, Pancho. “USDA’s Livestock Risk Protection Program Use Keeps Increasing.” Southern Ag Today 5(33.1). August 11, 2025. Permalink

  • New Federal Law Simplifies Payment Limitations

    New Federal Law Simplifies Payment Limitations

    The recent H.R. 1 budget reconciliation bill signed into law on July 3, 2025 made a number of changes to farm programs and qualifications that would normally be addressed in a five year farm bill. One of these is payment limitations on federal programs (e.g. conservation, crop insurance subsidies, disaster payments, etc.) imposed on farms organized as S corporations (S corps) or limited liability companies (LLCs). The need for this change was highlighted in a previous Southern Ag Today article that called attention to the disparate treatment of certain entities. As noted in the article, modern-day payment limitations trace their origins to the 1970 Farm Bill.. Since that time, larger farms – those with multiple owners actively engaged in operations – often have required specialized structuring to allow their operating or landholding entity to capture more than one payment limitation to contribute to the overall operation.

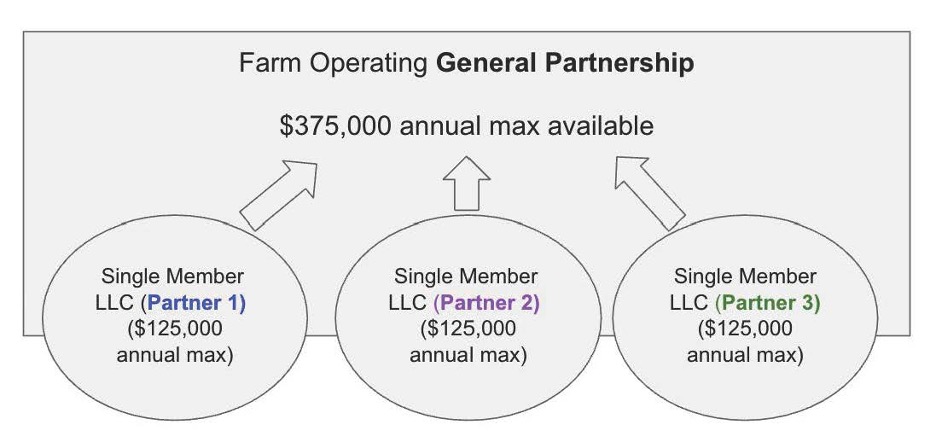
    Since the 2008 Farm Bill, LLCs and S corps have been treated as “individuals” and limited to one payment limit, regardless of the number of members or shareholders in the entity. This was the case even though for federal income tax purposes, these entities are considered “pass through” entities where the individual equity owners pay or take their pro-rata share of tax liability (or loss). Partnerships and joint ventures on the other hand were explicitly exempt from the payment limit, so each partner could receive payments up to their individual limitation and apply to the business of the partnership or joint venture (i.e. the farm operation). One distinction is that such arrangements are not considered entities in that they do not require registration and formation under state law. As such, partnership arrangements are not considered legal individuals, and they do not shield the equity owners from individual liability for actions of the partnership or other partners.Such lack of liability protection made operating as a partnership risky to the individual partners, perhaps not worth the risk simply to attain multiple payment limitations. A workaround legal arrangement came into practice, whereby the farm firm would operate as a partnership, but the individual partners would organize single member limited liability companies or S corps and assign their interest to their LLC or corporation, such that the LLC or corporation became the partner, rather than them in their personal capacity. This had the theoretical effect of shielding their personal assets from any tort litigation liabilities of the partnership. The arrangement looked like this:

    In this arrangement, instead of the farm being limited to one payment of $125,000, each individual LLC would qualify for a payment, so the farm operation could benefit from $375,000 in federal benefits (3 x $125,000).

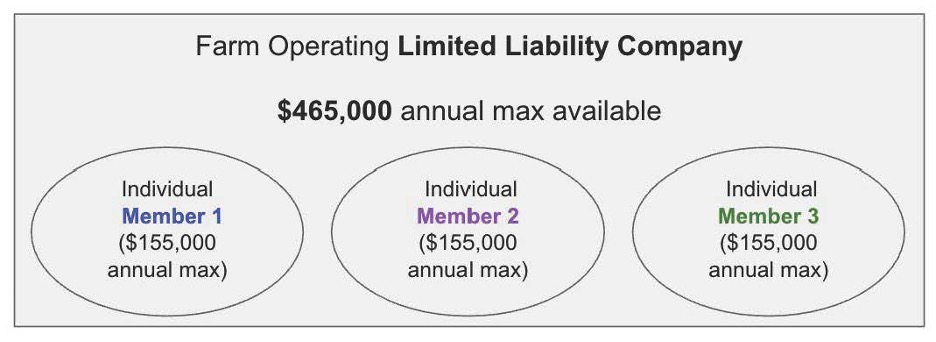
    The HB1 provision now places LLCs and S corps alongside partnerships and joint-ventures as pass-through entities for payment limitation purposes. Now, the farm may bypass the step of forming a partnership and organizing individual “partner entities,” and go straight to organizing the farm firm as one LLCs or S Corp. Each individual partner or shareholder who is “actively engaged in farming” will have their own payment limitation, so the farm firm benefits from the individual limitation multiplied by the number of members (LLC) or shareholders (S Corp). The limitation itself – previously set at $125,000 per individual – has also been raised to $155,000 per individual. The Secretary of Agriculture is authorized to increase this amount yearly with inflation. The simplified arrangement – along with the increased payment limit – may be formed as:

    Whether farm firms will reorganize may be a matter of cost priority. The higher costs of the arrangement under the old rules came in the form of tax accounting for both the partnership and each individual partner entity, annual filing fees with the secretary of state, plus increased paperwork with the county Farm Service Agency office. For brand new operations, reduced legal fees and state filing fees should offer savings.


    Branan, Andrew. “New Federal Law Simplifies Payment Limitations.” Southern Ag Today 5(32.5). August 8, 2025. Permalink

  • U.S.–Brazil Beef Trade at a Crossroads

    U.S.–Brazil Beef Trade at a Crossroads

    Brazil is shifting from a bulk commodity supplier to a premium beef exporter. In June 2025, it reached a turning point: certification as free of foot-and-mouth disease (FMD) without vaccination (PAHO, 2025). The upgrade opened doors to high-value markets like Japan and South Korea. A Japanese delegation visited days later, and a deal with Vietnam quickly followed (Brasil, 2025).

    While expanding access to Asia, Brazil also made significant inroads into the U.S. market. In May alone, it shipped 175 million pounds of beef to the U.S., five times the volume of May 2024. As shown in Figure 1, Brazilian beef exports more than doubled year-to-date, driving a 60% surge in total U.S. beef imports (USDA–ERS, 2025).

    The U.S. imposed a 50% tariff on imports from Brazil in July. With existing duties, the effective rate jumped to 76.4%. Brazil’s top exporters, Minerva, JBS, and Naturafrig, paused shipments and redirected product to Asia and the Middle East (Reuters, 2025a). Industry losses could top $1 billion in the second half of 2025 (Reuters, 2025b). The U.S. also launched a Section 301 investigation into Brazil’s trade practices (USTR, 2025). Though nearly 700 Brazilian products were exempted, beef remained on the list (The White House, 2025).

    At the same time, the U.S. reinforced its trade presence in Asia, signing new agreements with Japan, the Philippines, and Indonesia. Figure 2 shows Asia remains the top market for U.S. beef exports (USDA–ERS, 2025).

    While U.S. beef continues to command a premium, high prices and limited supply may create openings for Brazil in select Asian markets. With lower costs and upgraded health credentials, Brazil could appeal to buyers seeking value without sacrificing quality. Brazil’s pivot toward premium exports positions it to compete on perceived value, not just price. Still, U.S. beef holds strong brand recognition, deep trade ties, and a track record of consistency, advantages that remain critical in Tokyo, Seoul, and Hanoi.

    Figure 1. Year-to-date U.S. Beef Imports by Volume (million pounds) and Origin, January-May 2024 and 2025 

    Source: USDA, Livestock, dairy and poultry outlook (2025)

    Figure 2. U.S. Beef Exports by Volume (metric tons) and Countries, 2020 to 2024 

    Source: USDA

    References

    ASBIA – Associação Brasileira de Inseminação Artificial. (2025). Anuário ASBIA 2025. https://asbia.org.br/wp-content/uploads/Anuario/ASBIA_anuario_2025.pdf

    Brasil. Presidência da República. (2025, April 1). President Lula announces opening of Vietnam’s market to Brazilian beef. https://www.gov.br/planalto/en/latest-news/2025/04/president-luiz-inacio-lula-da-silva-announces-opening-of-vietnams-market-to-brazilian-beef

    Datamar News. (2025, July 31). Possible opening of Japanese market to Brazilian beef will apply only to five states. https://datamarnews.com/noticias/possible-opening-of-japanese-market-to-brazilian-beef-will-apply-only-to-five-states/

    Office of the United States Trade Representative. (2025, July). USTR announces initiation of Section 301 investigation of Brazil’s unfair trading practices. https://ustr.gov/about/policy-offices/press-office/press-releases/2025/july/ustr-announces-initiation-section-301-investigation-brazils-unfair-trading-practices

    Pan American Health Organization. (2025, June 6). Bolivia and Brazil certified free of foot-and-mouth disease without vaccination. https://www.paho.org/en/news/6-6-2025-bolivia-and-brazil-certified-free-foot-and-mouth-disease-without-vaccination

    Reuters. (2025a, July 30). U.S. tariffs prompt Brazilian meatpackers to reassess beef exports. https://datamarnews.com/noticias/u-s-tariffs-prompt-brazilian-meatpackers-to-reassess-beef-exports-says-abiec/

    Reuters. (2025b, July 29). Brazil beef-packers estimate $1 billion in losses if U.S. tariffs apply. https://www.reuters.com/world/americas/brazil-beef-packers-estimate-1-billion-losses-if-us-tariffs-apply-2025-07-29/

    The White House. (2025, July 30). Addressing Threats to The United States by The Government of Brazil. The White House. https://www.whitehouse.gov/presidential-auctions/2025/07 /addressing-threats-to-the-us/

    U.S. Department of Agriculture, Economic Research Service. (2025, July 17). Livestock, dairy, and poultry outlook: July 2025 (LDP-M-373). https://www.ers.usda.gov/publications/pub-details/?pubid=106890


    Calil, Yuri, and Felipe Martins Moreira. “U.S.–Brazil Beef Trade at a Crossroads.” Southern Ag Today 5(32.4). August 7, 2025. Permalink

  • Examining August FSA Data to Forecast Final Cotton Acreage

    Examining August FSA Data to Forecast Final Cotton Acreage

    Since 2011, the USDA’s Farm Service Agency (FSA) has provided monthly reports of crop acreage beginning in August.   This information is based on farmer reports of planted, prevented planted, and failed acres received and summarized to date.  A final acreage summary is released in January.  Beginning in October (occasionally in September), these data are used by USDA’s National Agricultural Statistics Service (NASS) for comparison to survey-based planted acreage estimates in the monthly Crop Production report. 

    In this article, we examined the relationship between the preliminary August FSA planted acreage and final FSA planted acreage for cotton.  We also looked at the relationship between final FSA planted acreage and NASS planted acreage.

    While FSA acreage data represents a census of planted acreage enrolled in farm programs, the FSA acreage data does not function as official USDA planted acreage estimates (because not all farms are enrolled in the farm programs administered by the FSA). The official planted acreage estimates are the responsibility of NASS, the statistical agency of the USDA.  

    As a starting point, we reviewed the relationship between the August and final (i.e., January) FSA planted acreage estimates for cotton (upland and Pima combined).  As noted in Figure 1, reporting during August 2020 was off significantly due to the reporting extension during the COVID pandemic. The data pre-2020 and post-2020 indicate all but a small percentage of planted acreage for cotton is generally reported to the FSA by August.  For example, over the 2015-2019 period, the average ratio of preliminary to final FSA planted acreage for cotton was 98.9 percent.  In recent years, 2021-2024, the average ratio increased to 99.7 percent in August. Arguably the period 2021-2024 is the most representative part of the sample for making 2025 forecasts. 

    Figure 1. Ratio of August to Final January FSA Estimate of U.S. Cotton Planted Acreage, 2015-2024

    We also looked at the relationship between the final FSA planted acreage and final NASS planted acreage (Table 1).  In the years 2015-2024, the acreage relationship is quite consistent.  For cotton, the final FSA estimate of planted acreage averages 98.2 percent of final NASS planted acreage with a range of 0.9 percent.   The consistency of the relationships can be attributed to the fact that enrollment in FSA farm programs varies relatively little from year to year.

    TablTable 1. U.S. Planted Acres of Cotton Estimated by NASS and Reported to FSA, 2015-2024

    YearNASSFSADifferenceFSA/NASS(%)
    20158,580,5008,450,939129,56198.5%
    201610,073,5009,927,191146,30998.5%
    201712,717,50012,413,314304,18697.6%
    201814,081,30013,824,448256,85298.2%
    201913,722,70013,405,957316,74397.7%
    202012,086,00011,834,619251,38197.9%
    202111,206,50011,025,710180,79098.4%
    202213,749,00013,530,779218,22198.4%
    202310,230,00010,077,091152,90998.5%
    202411,183,00010,997,089185,91198.3%
         
    Average  214,28698.2%
    Low  129,56197.6%
    High  316,74398.5%
    Source: USDA Farm Service Agency and National Agricultural Statistics Service.

    In 2025, historic spring rainfall disrupted cotton planting in some states, which has made for a challenging year.  Many industry observers questioned the NASS June Acreage survey that delivered much higher-than-expected cotton acreage estimates for the Midsouth region. The findings in USDA’s first monthly acreage report of 2025 will be of particular interest to the cotton industry.  The report will be released on August 12th and can be found at this link:  FSA Crop Acreage Data. The information in these reports is widely followed by the market for clues about possible future revisions to the official USDA planted acreage estimates. Based on recent history, this report is expected to provide a strong indicator for overall cotton acreage in 2025. 


    Stiles, H. Scott. “Examining August FSA Data to Forecast Final Cotton Acreage.” Southern Ag Today 5(32.3). August 6, 2025. Permalink