Blog

  • Navigating U.S. Sugar Imports From 70 Countries

    Navigating U.S. Sugar Imports From 70 Countries

    The United States (U.S.) is the fifth largest sugar producing country in the world, but also the third largest sugar importer (U.S. Department of Agriculture (USDA) Foreign Agricultural Service (FAS), 2024). Last year, the U.S. imported sugar from more than 70 countries and met roughly 29% of demand through preferential-access imports and high-tier (also known as tier-2) imports. When domestic production rises, the U.S. will import less sugar and vice-versa. An important aspect of the U.S. trade in sugar are the Suspension Agreements[1] on sugar with Mexico, which went into place in 2014 and were revised in 2017 (USDA Economic Research Service (ERS), 2024). 

    As part of U.S. sugar supply, preferential access is granted to trading partners through the World Trade Organization (WTO) or through free trade agreements (FTAs). Sugar that enters under those agreements arrive under a tariff-rate quota (or TRQ), which effectively allows sugar to enter the U.S. duty-free (USDA ERS, 2024). Those who import sugar into the U.S. above the quota are required to pay a duty to the U.S. government (tier-2 duty), which was established in 1994 at the rate of 15.36 cents/pound for raw sugar and 16.21 cents per pound for refined sugar (USDA ERS, 2024). The U.S. is projected to import an average 425,000 tons of tier-2 sugar per year (USDA, 2024).

    Administratively, the USDA Secretary announces the minimum quantity of sugar under its WTO commitments that may be imported at the in-quota tariff rate prior to the start of the fiscal year and may increase that amount of preferential-access sugar as the year progresses depending on the amount of sugar that Mexico (the largest U.S. trading partner for sugar) is anticipated to export to the U.S. and depending on the U.S. supply and demand situation. 

    For fiscal year 2023/24, total sugar imports into the U.S. are estimated at 3.42 million short tons raw value (STRV), down from last year’s estimate of 3.61 million STRV (henceforth we will refer to STRV as tons) (Figure 1). The USDA recently increased the raw sugar TRQ by 137,789 STRV after determining that additional supplies of raw cane sugar were required in the U.S. market (announced March 7th, Federal Register, 2024).

    While the overall amount of sugar imported into the U.S. has not changed dramatically from year to year, it is notable to consider the period post-free trade with Mexico as well as several anomalous years (Figure 1). Under NAFTA, Mexico had the ability to send unlimited amounts of sugar to the U.S. market if that sugar was not subsidized by the Mexican government or dumped on the U.S. market.  Following the more than 2 million tons of sugar exports to the U.S. in fiscal years 2012/13 and 2013/14, the U.S. sugar industry sued Mexico at the International Trade Commission, which found Mexico guilty of subsidizing and dumping sugar in the U.S and causing significant damage to American sugarbeet and sugarcane farmers.  The two countries negotiated Suspension Agreements to manage that trade (both with respect to quantity and price) following 2014 (U.S. International Trade Administration, 2024). More recently, Mexico has suffered drought, and thus the amount of sugar they supply to the U.S. market has been sharply constrained. As a result, the amount of tier-2 sugar entering the U.S. market has been increasing (Figure 1). 

    Figure 1. Total U.S. sugar imports by source. USDA, 2024.

    While Mexico is still the largest foreign supplier of sugar to the U.S., over the past few years the crop in Mexico has been limited due to drought conditions and high fertilizer costs.  As a result, and as mentioned above, there have been large amounts of sugar arriving, both under preferential access (e.g., WTO and FTA trade agreements) and through tier-2 imports. As reported by USDA (2024), in fiscal year 2022/23 Mexico was still the largest exporter to the U.S. with more than 1.1 million tons of sugar shipped to the U.S.  Other countries exporting more than 100,000 tons of sugar to the U.S for the period included Brazil, Guatemala, Dominican Republic, Columbia, El Salvador, Costa Rica, and Argentina (U.S. Census Bureau, 2024). Overall, in fiscal year 2022/23 the U.S. imported 3.61 million tons of sugar from more than 70 countries (USDA, 2024).

    Given forecast sugar use in the U.S. of 12.56 million tons and exports of at least 197,000 tons, the carryover this year is expected to be 1.72 million tons of sugar, or roughly 3.44 billion pounds of sugar (Deliberto and DeLong, 2024; updated for April WASDE). That brings the forecast of stocks-to-use to 13.5%. Of course, throughout the remainder of this year, there will be adjustments to both supply and demand that will typically result in a stocks-to-use that will likely fall within the USDA target range of 13.5% to 15.5% by the end of the year.

    Based on the production of 9.22 million tons relative to demand – plus total use of closer to 12.75 million tons – the U.S. will likely import about 3.42 million tons of sugar this year, or 26.8% of total use. That would keep the U.S. as the fifth largest sugar producer and the third largest sugar importer in the world.  

    [1] For more on the Suspension Agreements with Mexico, see this previous article in Southern Ag Today.

    References

    Deliberto, M. and K.L. DeLong. 2024. “The 2024 Sugar Market Domestic Supply and Outlook.” Southern Ag Todayhttps://southernagtoday.org/2024/04/01/the-2024-sugar-market-domestic-supply-and-outlook/

    Office of the U.S. Trade Representative. 2024. USTR Announces FY 2024 Allocation of Additional TRW Volume for Raw Cane Sugar. Retrieved from: https://ustr.gov/about-us/policy-offices/press-office/press-releases/2024/march/ustr-announces-fiscal-year-2024-allocation-additional-tariff-rate-quota-volume-raw-cane-sugar

    U.S. Census Bureau. 2024. USA Trade Online. Retrieved from: https://usatrade.census.gov/

    USDA. 2024. World Agricultural Supply and Demand Estimates. Retrieved from: 

    https://www.usda.gov/oce/commodity/wasde/wasde0424.pdf

    USDA, ERS. 2024. Sugar and Sweetener Policy. Retrieved from: https://www.ers.usda.gov/topics/crops/sugar-and-sweeteners/policy/

    USDA, FAS. 2024. Sugar: World Markets and Trade. Retrieved from: https://apps.fas.usda.gov/psdonline/circulars/sugar.pdf

    U.S. International Trade Administration. 2024. Enforcement and Compliance. Retrieved from: https://enforcement.trade.gov/agreements/sugar-mexico/#:~:text=Suspension%20Agreement%20on%20Sugar%20from,845%2C%20C%2D201%2D846&text=Description%3A,investigation%20on%20sugar%20from%20Mexico

    Federal Register. 2024. Fiscal Year 2024 Raw Cane Sugar Tariff-Rate Quota Increase. 89, Fed. Reg. 16524.  March 7, 2024. Retrieved from:  https://www.federalregister.gov/documents/2024/03/07/2024-04903/fiscal-year-2024-raw-cane-sugar-tariff-rate-quota-increase


    Deliberto, Michael, Karen DeLong, and Bart L. Fischer. “Navigating U.S. Sugar Imports From 70 Countries.Southern Ag Today 4(16.4). April 18, 2024. Permalink
  • The Costs and Benefits of Mechanization: A Look at the Dairy Sector

    The Costs and Benefits of Mechanization: A Look at the Dairy Sector

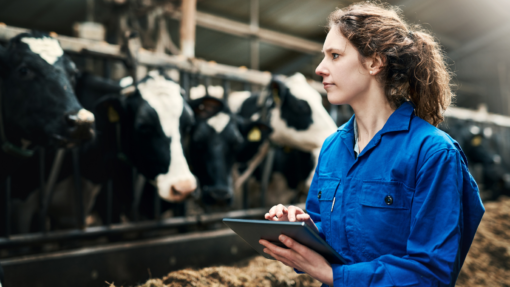
    American agriculture has been experiencing labor shortages for many years. Domestic workers left the sector for higher-paying opportunities, and farmers constantly struggle to find people for multiple tasks. While H-2A visas and importing food products from other countries (especially Mexico) are viable alternatives in the short-term, automation is seen as a long run solution to persistent farm labor shortages (Gutierrez-Li, 2021). Machines can be developed to mimic harvesting tasks currently performed by human beings. In addition, robots can tolerate wider weather conditions (like heat waves, smoke from fires, droughts, or excess rain) and operate for longer hours. Drones and other technologies can harvest fruits and vegetables, apply pesticides, water crops, and transport and pack commodities. If mechanization offers so many benefits, why have farmers not automated more production processes? The answer is simple: costs. Designing, creating, and testing machines involves high R&D investments, meaning the price tag for automation is often cost prohibitive for small and medium-sized farmers. 

    One major limitation of the current H-2A program is that its use is restricted to seasonal agriculture, putting year-round sectors, like dairy, at a disadvantage. For this reason, dairy farmers have had more incentives to invest in automation, given their inability to access foreign legal labor. To better understand the unique needs and challenges of dairy farmers related to labor, we surveyed dairy producers in Wisconsin and Minnesota, two important milk-producing states. We were interested in learning about the use of automatic milking systems (AMS). AMS use robotic arms to attach teat cups using sensors, yielding a “hands-free” milking process. These technologies are more prevalent in other regions (particularly Europe), where dairy farmers have more readily adopted robots capable of conducting some of the tasks previously performed by humans. 

    Our survey targeted 2,000 dairy farmers and received 650 responses in January 2023. Of those, only 39 farmers were already using AMS. Most adopters of this technology considered their investment in AMS worthwhile. Some of the benefits mentioned include increasing productivity, reducing the workload of existing workers, allowing owners and workers to plan more efficiently, cows being more comfortable, and farmers not being under the constant stress of finding and managing crews. However, not all comments were positive. Some producers mentioned constant issues with robots breaking down and high maintenance costs. The size of the operation (number of cows) and availability of skilled labor (or the lack thereof) also determined the net value of AMS. A selected sample of comments (each from a different respondent) is included at the end.

    In summary, tight agricultural labor markets, political divisions complicating the passing of immigration reforms, and a growing population to feed emphasize the importance that mechanization will play in U.S. agriculture. However, the transition to automated food production processes is complex. Technologies take time to be developed, do not entirely eliminate the need for labor, and are costly to maintain and repair. Farmers’ decisions to mechanize their practices will depend on the feasibility of realizing increases in productivity that will outweigh the costs of automating. Other considerations such as commodity prices, availability of specialized labor, animal welfare, environmental concerns, and farm succession to the next generation also play a role.

    Farmers’ Perceptions about Using Automatic Milking Systems

    Positive Experiences
    “Yes, it was well worthwhile. it made improvements in all parts of our operation. It’s only been a year and a half, but we are seeing better production, breeding, health, and much easier handling of the cows. We remodeled our existing free stall barn for dry cows and heifers so now we have all animals in 2 barns. So much more efficient and can do all the work in less time. Don’t regret doing it at all!”
    “Yes, because the cows are more relaxed and comfortable. The workers are also more relaxed and get more free time.”
    “The stars all lined up for this project. -Stall pipes needed to be replaced anyways, so it was a good time to redo the barn. – Milking is hard on a lot of bodies especially during cropping. – Finding people to help milk wasn’t getting easier. – This project was money well spent.”
    “Yes, I do. It often is a different type of flexibility than a traditional parlor, but it also ties you down more. Tough to leave further than 30 minutes away because it is difficult to find qualified people to be “on call”. In the last 11 years we have gone from 4 to 8 robots.”
    “For our farm it was either sell the cows or put in an AMS system. My husband’s knees and shoulders are shot, and he’s not old enough to retire, with the AMS he is able to do the other chores (mixing feed, cleaning barn, and feeding calves). It was a big investment, but it is serving us well and it allows me to continue to work full time off the farm. The cows do really well with it, the information you get on each cow is amazing. It also has improved our heat detection and insemination rate.”
    “Yes. Before AMS, we were milking 180 cows in a D8 parallel. All labor included was 18-man hours/day. That’s everything. Breeding, feeding, bedding, milking calves, heifers, everything! After Ams, it’s 12-man hours for same work plus 80 more cows on milk and 10x more milk.”
    Negative Experiences
    “Had robots from 2001 to 2007. Anything and everything went wrong. Robots called house almost every night for problems. Spent hours trying to fix robots. In summer 2006 a new update was put into computer causing virus to get into the system which made cows 2 and 3 titers. Had 30 rows come down with Mastitis in 2 weeks’ time before we figured out where the problem was coming from. The decision was made to pull the robots out and put a herringbone parlor in place of the robots. now we milk 2x per day and can walk away when milking is done and can sleep thru the night without a robot calling us to come to the barn for another problem.”
    “We’ve had robots for 9 years. Certainly, we cannot milk all cows ourselves (just me and my husband) But the monthly bill is extreme. We can fix some things ourselves, but they have to come a lot always something wrong. We find them very frustrating. Would I recommend them? After 9 years I’m still not sure.”

    References

    Gutierrez-Li, A. (2021). The H-2A visa program: addressing farm labor scarcity in North Carolina. NC State Economist. North Carolina State University.


    Gutierrez-Li, Alejandro, Cesar Escalante, and Shree Ram Acharya. “The Costs and Benefits of Mechanization: A Look at the Dairy Sector.Southern Ag Today 4(16.3). April 17, 2024. Permalink

  • Data Delivers Market Transparency, For Now

    Data Delivers Market Transparency, For Now

    USDA, National Agricultural Statistics Service (NASS) has recently proposed to eliminate some data reports.  Reports for both livestock and crop sectors would be impacted.  Livestock and meat economists would consider some of the affected reports to be particularly important to market efficiency.  The article looks at a few of those and describes how they are used and why they are important to farmers and ranchers.  

    July Cattle Inventory

    USDA conducts two cattle inventory surveys per year.  The January report is the most comprehensive and includes state level cattle numbers.  The July report is smaller (it does not breakout numbers by state), but it provides a few valuable pieces of supply information: number of beef cows, heifers held for replacement, and calf crop.  One of the biggest questions in the cattle market today is when will the cattle cycle turn and expansion begin.  The beginning of herd expansion will drive calf prices even higher, will signal how long high prices will last, and how long until beef production begins to grow.  

    This report will be very valuable over the next several years.  If this report had to be discontinued, now is the worst time to do it.

    Cattle Inventory (January)

    The proposed changes include dropping beef cow inventory in a number of states.  Total, or all, cattle would still be reported. The proposed discontinued states include Louisiana, Mississippi, North and South Carolina, and Virginia.  The South is cow-calf country and is a major supplier of feeder cattle to feedlots across the Plains.  

    The number of beef cows in these states is critical to the estimation of feeder cattle supplies and the projection of prices to use in planning.

    County Estimates

    USDA’s announcement included the elimination of the annual county estimates of beef cows and cattle.  These county estimates allow for the analysis of natural disaster impacts on agriculture such as the recent Panhandle wildfires, hurricanes, and drought in Texas.  Following hurricane Harvey, the county level data allowed us to know with some certainty that there were 1.1 million beef cows at risk in the impacted counties.  From there, upper bounds on lost cattle and grazing losses could be estimated.  This Spring, wildfires across the Texas Panhandle, including the Smokehouse Creek Fire, burned more than 1 million acres.  The county level beef cow estimates allowed for the estimation and validation of estimated cattle losses due to the fires.  

    Other Livestock Data

    Some other changes proposed including dropping Virginia and Maryland from state level estimates in the Chickens and Eggs report.  This state level data is important in doing research on the impact of animal diseases and the effectiveness of alternative disease controls.  Virginia and Maryland remain important poultry producing states as part of the Delmarva (Delaware, Maryland, and Virginia) region.

    On Balance…

    We all know USDA often faces budget cuts and they must judiciously use taxpayer resources. It is also true that USDA reports are valuable to market participants and reducing the available information will result in varying degrees of negative impacts on market efficiency.   The reports mentioned here, – including the July Cattle, County Estimates, and state level breakouts of beef cow inventory in the South – have tangible benefits to farmers and ranchers.  A good argument can be made that these reports should be kept.  If you are interested in providing comments to USDA on these, or other reports, contact your NASS State Statistician.

    Anderson, David, and Josh Maples. “Data Delivers Market Transparency, For Now.Southern Ag Today 4(16.2). April 16, 2024. Permalink

  • December 2024 Corn Option Premium Movement from October 2023 to April 2024 

    December 2024 Corn Option Premium Movement from October 2023 to April 2024 

    December 2024 corn futures declined 10% from October 5, 2023, to April 9, 2024 ($5.20/bu to $4.68/bu; Figure 1). As expected over the same period, call option premiums have declined and put option premiums have increased. For example, on October 20th, a $5.50 call option traded for 32 cents/bu and a $4.20 put option traded for 8 cents/bu (Figure 1). On April 9th, put and call option premiums, for those same strike prices, traded for 12 cents per bushel. The change in December corn options premiums indicates the markets have factored in less upside potential and slightly more downside risk in December 2024 corn futures than six months ago. Part of the change can be attributed to markets digesting additional information over the past six months, such as South American corn production, U.S. planted acreage estimates, export sales, and projected United States (US) and global corn carryover into next year (USDA WASDE Report). 

    Figure 1. December Corn $5.50 Call and $4.20 Put Option Premiums and Daily Futures Contract Close, October 5, 2023- April 9, 2024

    Data Source: Barchart.com

    The change in call and put option premiums over the past six months indicates the importance of timing when looking at implementing a price risk management strategy. Figure 2 shows scenarios for a hypothetical strategy of fencing in a corn futures price using the sale of a $5.50 call option and the purchase of a $4.20 put option at different points in time (approximately 30-day increments). The difference in the seven lines in Figure 2 is the change in the price of the sold call option premium and the price of the purchased put option premium. The strike prices for both the call and put options do not change; only the net premium received changes (the premium collected from selling the call option less the premium paid for the put). For example, on October 9th the $5.50 call option could have been sold for 30 cents/bu and the $4.20 put option purchased for 8 cents/bu. This would have resulted in a net premium gain of 22 cents/bu, shifting the fenced in futures price to $4.42 to $5.72 (Figure 2). On April 9th, a call option could have been sold for 12 cents/bu and a put option purchased for 12 cents/bu, resulting in a net premium of 0 cents/bu, setting the fenced in futures price at the put and call strike prices of $4.20 and $5.50. This example illustrates the importance of timing when executing an option strategy to mitigate futures price risk.  It is important to note that this example does not consider the increased risk of entering the strategy on October 9th versus on April 9th when more information is known about the December corn futures underlying fundamentals and associated price direction. 

    This article is for information and education purposes and does not constitute a trading recommendation.     

    Figure 2. A December Corn Futures Fence Example: Selling a $5.50 Call Option and Purchasing a $4.20 Put Option at Seven Points in Time from October 5, 2023, to April 9, 2024.

    References

    Barchart.com. December Corn Futures Contract Close. Accessed at: https://www.barchart.com/futures/quotes/ZCZ24/price-history/historical

    Barchart.com. December Corn Options Prices, Option Price History. Accessed at:  https://www.barchart.com/futures/quotes/ZCZ24/options?futuresOptionsView=split

    USDA World Agricultural Supply and Demand Estimates (WASDE). Accessed at https://www.usda.gov/oce/commodity/wasde


    Smith, Aaron. “December 2024 Corn Option Premium Movement from October 2023 to April 2024.Southern Ag Today 4(16.1). April 15, 2024. Permalink

  • A View of Commercial Banks in the Southern Region

    A View of Commercial Banks in the Southern Region

    Commercial banks play an important role in the agricultural sector and communities. These financial institutions not only accept deposits but also provide relationship-based and information-intensive banking services to small businesses, including some family farms, and depositors of low to moderate wealth (Kgoroeadira et al., 2019; Keeton et al., 2003; Cole, 1998; Berger and Udell, 1995). Community banks are often more flexible in tailoring their loan policies to small business customers (Yeager, 1999). The banking sector’s involvement in agriculture has grown significantly, from providing about 8% of real estate loans in the 1980s to over 30% in 2023, second only to the Farm Credit System’s 49%. Commercial banks also serve as the largest lenders to agricultural producers for non-real estate loans (43%), compared to 38% from the Farm Credit System. Additionally, commercial banks have positive impacts on community development by providing capital to new and existing businesses for expansion or growth purposes, thereby fueling local economic growth and employment. Despite their increasing role in the community and the agricultural sector, the development and application of advanced information technologies are altering the finance market, leading to a reduction in the presence of local branches in both urban and rural areas (Dahl et al., 2021).

    The number of banks across the southern states has decreased over time (see Figure 1). Since the 1980s, we have observed the consolidation of banks contributing to this trend, with large banks merging with other large banks and acquiring smaller regional banks (Gilbert, 2000). However, while the number of branches increased between 1980 and 2010, a downward trend followed thereafter (see Figure 2). The more recent closure of branches across the states is primarily attributed to the growing acceptance and use of online or mobile banking. Branch closures, for the most part, were concentrated in areas with branch duplication rather than those dependent on a single branch (Dahl et al., 2021). One of the economic impacts of these closures has been the reduction in employment and multiplier effects in five of the thirteen southern states (Alabama, Georgia, Kentucky, South Carolina, and Texas). Georgia experienced a significant drop of 61% in employment over the past decade, from 42,302 employees in 2014 to 16,329 in 2023. Additionally, Dahl et al. (2021) found that the median extra distance traveled to the nearest branch following a closure is 0.18 miles in urban areas and 0.64 miles in rural areas.

    Bank closures have also been found to have a lasting and significant impact on credit supply to local small businesses, remaining depressed for up to 6 years (Nguyen, 2019). However, Nguyen (2019) noted that these effects were very localized, dissipating within six miles of the area where the closure occurs. Furthermore, bank closures or consolidations have a greater impact on the more vulnerable members of society. Although online banking is gaining popularity due to its cost-effectiveness and potential to reach a larger customer base, many rural areas still lack broadband access or may not be technologically savvy enough to participate in online banking. Hence, physical banking continues to play a crucial role for many consumers, especially lower-income, rural, older, and disabled individuals (Dahl et al. 2021). Therefore, the lack of nearby bank branches could disrupt access to banking services for some of the most vulnerable groups in our communities. This lack of access can, in turn, limit opportunities to improve financial health and build wealth, ultimately impacting community economic development. Thus, it is important to pay attention to potential bank mergers and acquisition strategies and their associated effect on community bank trends, as changes in this sector can strengthen access to financial services in communities affected by closures.

    Figure 1: Total Insured Commercial Banks

    Source: R output using Federal Depository Insurance Corporation data

    Figure 2: Total Branches of Commercial Banks

    Source: R output using Federal Depository Insurance Corporation data

    References

    Berger, Allen N., and Gregory F. Udell. 1995. The Journal of Business. 68(3): 351-381. https://www.jstor.org/stable/2353332

    Cole, Rebel A. 1998. The importance of relationships to the availability of credit. Journal of Banking & Finance, 22(6–8): 959-977.

    Dahl, Drew, Michelle Franke, and James Fuchs. 2021. How Branch Closures Affect Access to Banking Services. Regional Economist, Federal Reserve Bank of St. Louis (January 2021). https://www.stlouisfed.org/publications/regional-economist

    Gilbert, R Alton. 2000. Big Fish, Small Ponds: Large Banks In Rural Communities. Regional Economist, Federal Reserve Bank of St. Louis (July 2000). https://www.stlouisfed.org/publications/regional-economist

    Keeton, William, James Harvey, and Paul Willis. 2003. The Role of Community Banks in the U.S. Economy. Federal Reserve Bank of Kansas City Economic Review (Q2):15–43

    Kgoroeadira, Reabetswe, Andrew Burke, and André van Stel. 2019. Small Business Economics. 52(1): 67-87. https://www.jstor.org/stable/48701893

    Nguyen, Hoai-Luu Q. 2019. American Economic Journal: Applied Economics. 11(1): 1-32. https://www.jstor.org/stable/26565512

    Yeager, Timothy J. 1999. Down, But Not Out: The Future of Community Banks. Regional Economist, Federal Reserve Bank of St. Louis (October 01, 1999). https://www.stlouisfed.org/publications/regional-economist