Blog

  • Panama Canal Traffic Delays Threaten Southern Ag Global Supply Chains

    Panama Canal Traffic Delays Threaten Southern Ag Global Supply Chains

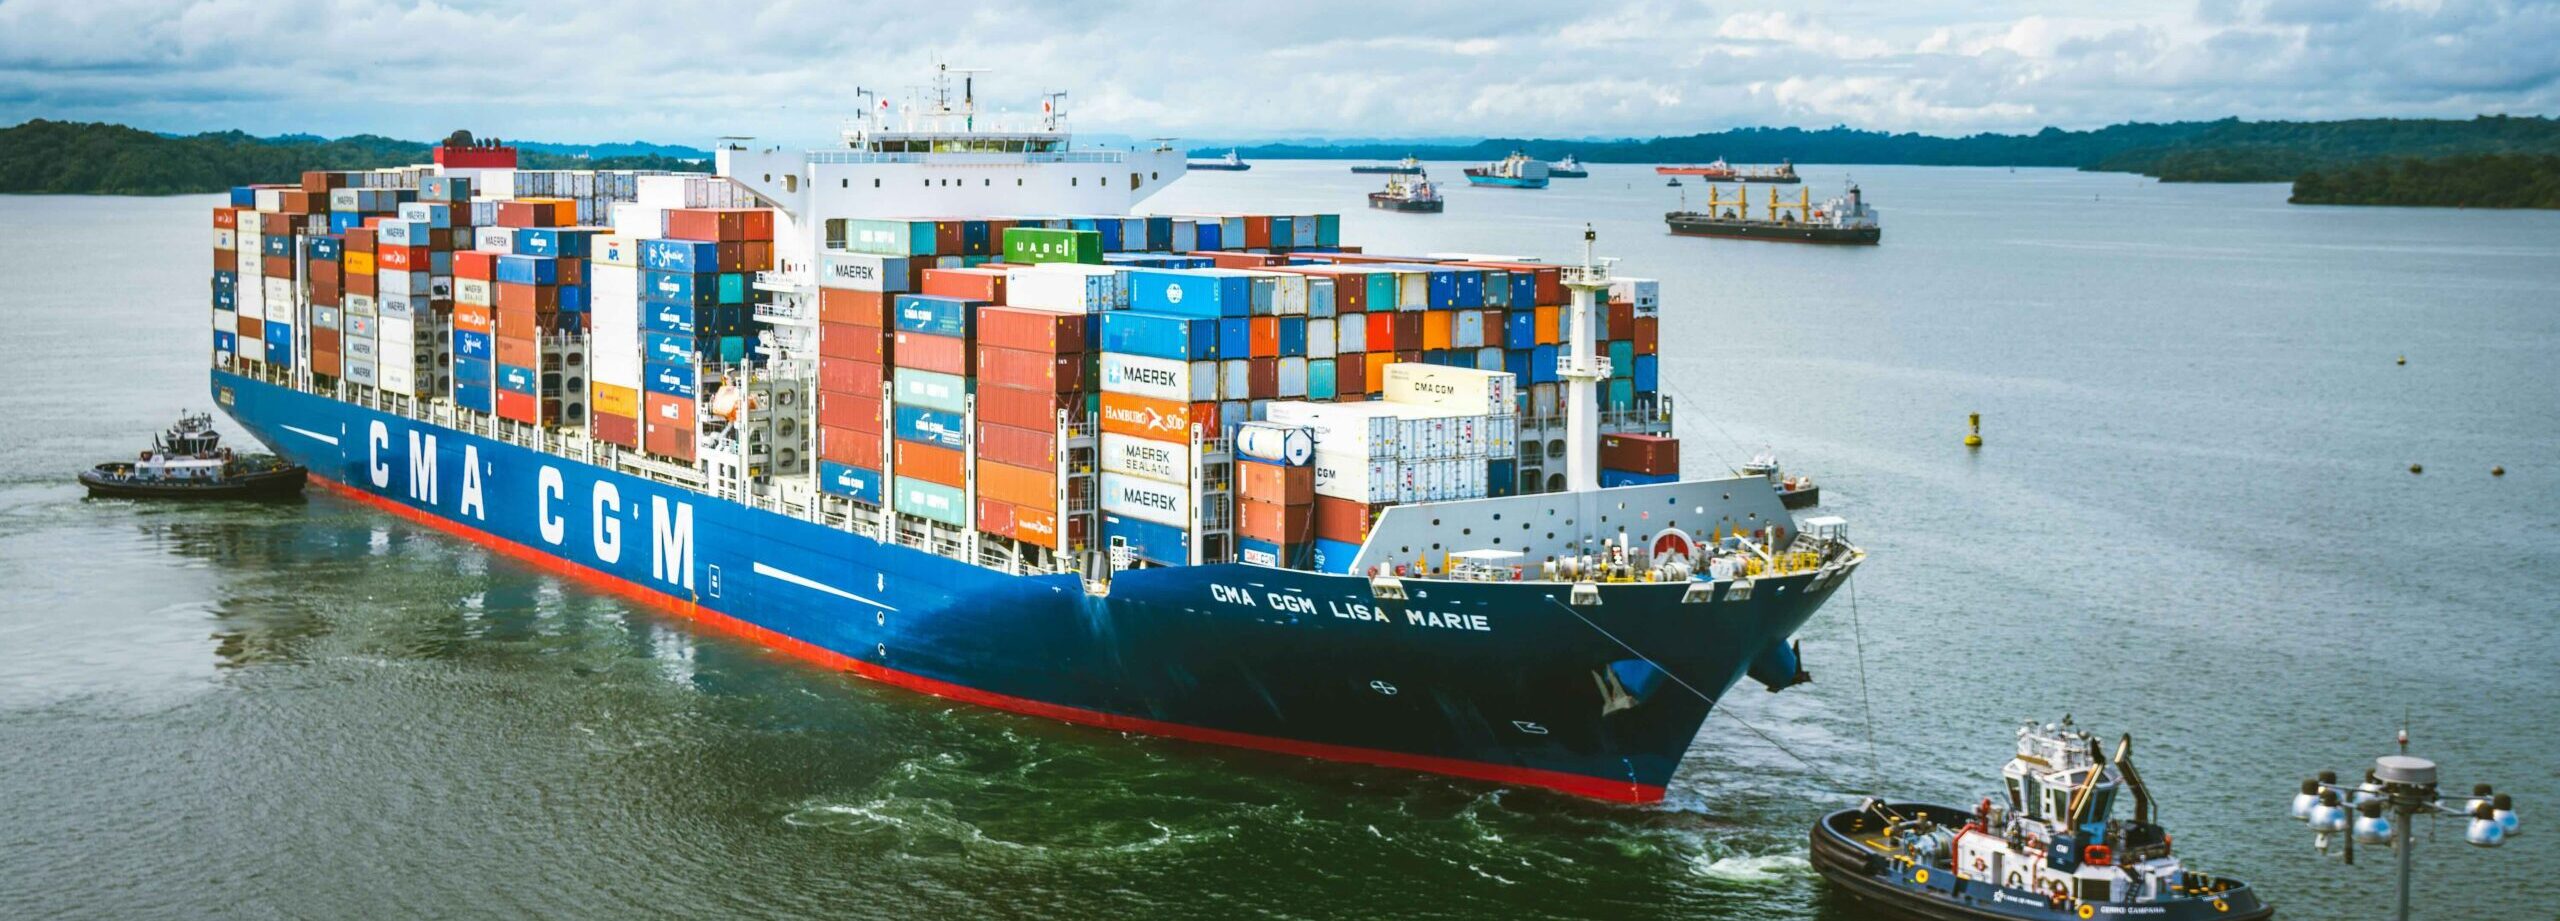
    The Panama Canal, a linchpin of global maritime trade, faces its most severe drought in history, resulting in unprecedented restrictions on vessel transits. Currently, hundreds of cargo vessels and tankers are stuck in front of the channel, with average wait times exceeding three weeks. This crisis is a major engineering challenge and a stark reminder of how vulnerable the global trade system is to weather shifts. At the heart of the Panama Canal drought lies the El Niño weather phenomenon, exacerbated by the broader issue of climate change. El Niño induces substantial weather anomalies, including reduced rainfall in Central America, directly affecting the water levels crucial for the canal’s operation. Climate change amplifies these effects further, resulting in more frequent and severe drought conditions.

    Under normal circumstances, the Panama Canal can accommodate about 35 ship crossings daily. However, the drought has caused a more than 30 percent reduction in vessel transits, limiting daily crossings to around 24 ships, as shown in Figure 1. This reduction is not just a logistical challenge but a substantial economic setback for Panama. Canal administrators anticipate a staggering loss of $500 million to $700 million in revenue for fiscal year 2024. The first quarter of fiscal year 2024 alone witnessed a 20 percent decrease in cargo volume, leading to 791 fewer ships than the previous year.

    Figure 1: Daily vessel transit through the Panama Canal plummets by 30 percent.

    Note. Daily average Panama Canal transits by vessel type obtained from the Panama Canal Authority (2024). Data is current as of January 18, 2024. Panamax and Neopanamax refer to vessel size limits at the Panama Canal. Panamax dimensions are set by the original locks, allowing vessels up to 110 feet in width, 1,050 feet in length, and 41.2 feet in depth. Neopanamax, on the other hand, is defined by the newer locks, accommodating ships up to 180 feet in width, 1,401 feet in length, and 60 feet in depth.

    The United States heavily relies on the Panama Canal for its agricultural exports, especially to Asian markets, facing profound repercussions due to this crisis. Figure 2 shows that grains and oilseeds are the major agricultural transit goods in volume. Last year, about 26 percent of U.S. soybean and 17 percent of corn exports passed through the Panama Canal. Due to the disruptions, U.S. agricultural exporters grapple with rising shipping costs and extended transit times. These additional expenses will translate into higher prices for agricultural products in Asian markets. For some perishable goods, shipping delays can impact market value due to compromised quality.

    Figure 2: Panama Canal handles over 26 percent of U.S. soybean and 17 percent of corn exports.

    Note. Agricultural transit volume data for fiscal years 2021 to 2023 come from Panama Canal Authority (2024). The fiscal year runs from October 1 to September 30. The figure shows the major agricultural exports by tonnage for the shipments on the Atlantic to Pacific route.

    The trajectory of the Panama Canal’s operational capacity in 2024 hinges mainly on environmental factors that are out of human control. While the impending rainy season might offer temporary relief, broader concerns surrounding climate change and the persistence of El Niño suggest the possibility of recurring droughts. In response, the Panama Canal Authority started to explore different water management techniques and new water sources to sustain both the canal’s functionality and Panama’s domestic needs.

    Looking into the future, U.S. agricultural exporters may need to reassess their logistical strategies, including exploring alternative shipping routes, adjusting shipping schedules, and potentially diversifying export markets to mitigate risks associated with the canal’s reduced capacity. The situation unfolding in the Panama Canal shows the vulnerability of global trade to environmental changes. It underscores the necessity for resilience and adaptability in international trade practices in the face of climatic challenges. This challenge calls for collaboration among global trade stakeholders to alleviate the impacts of these disruptions and strengthen the resilience of the international trading system.


    Lim, Sunghun, Sandro Steinbach, and Xiting Zhuang . “Panama Canal Traffic Delays Threaten Southern Ag Global Supply Chains.Southern Ag Today 4(8.4). February 22, 2024. Permalink

  • Dairy Revenue Protection Historical Performance for Component Price

    Dairy Revenue Protection Historical Performance for Component Price

    Dairy Revenue Protection (Dairy-RP) is an insurance policy available to dairy producers to guarantee revenue every quarter. Dairy-RP was designed to help producers combat the high volatility in the fluid milk market. There are five terms producers must agree to when purchasing a policy, however, the most important decision is the pricing option of either class or component pricing. Since the introduction of Dairy-RP, over 82,000 policies have been purchased. From these policies, 253 billion pounds of milk have been insured, generating $1.72 billion in premiums, which resulted in $1.26 billion in indemnities. The number of Class Pricing policies has increased from 5,000 in 2019 to 11,300 in 2023. Alternatively, Component Pricing policies have decreased from 2,800 policies in 2019 down to 2,300 in 2023. For the producer selection terms and added information, see the previous article, Dairy Revenue Protection Historical Performance for Class Price, as this publication covers producer options.

    The loss ratio is one method of measuring the performance of Dairy-RP. The loss ratio is calculated as total indemnity payments divided by the total premiums, thus representing a ratio of the total money paid back to the producers relative to the premiums paid (in total) for the policies. We often focus on a loss ratio of one, which means all money paid for the policy (insurance premiums) was distributed back to the producers in protection (indemnities).

    We analyzed the performance of Dairy-RP by state under the component pricing option. Figure 1 shows the weighted average loss ratio for Dairy-RP (component pricing option) by state. Compared to the class pricing option, policies purchased under component pricing as a collective have had historically lower loss ratios. There are 40 states that are currently enrolled in Dairy-RP, and none of the states have loss ratios greater than or equal to one. California accounts for 22.8% of the milk declared under the component pricing option, but even though being the most declared, it ranks twelfth with the highest loss ratio of 0.75. Wisconsin is the second most declared, accounting for 15.1% of the milk declared under the component pricing option, and ranks fifth for the highest loss ratio at 0.82. Idaho has the largest loss ratio of 0.91 and accounts for 14.4% of the component priced milk declared. Three states, New Hampshire, Delaware, and Massachusetts are not listed as producers in these states have not purchased any component pricing policies. The southeast is expected to see lower participation in component price due to the federal milk marketing order. However, Texas ranks second with a loss ratio of 0.84 and accounts for 9.1% of the milk declared under the component pricing option. 

    Data Source: USDA RMA Summary of Business Dairy Revenue Protection Participation
  • Ag Census Reveals Fewer Beef Cow Farms

    Ag Census Reveals Fewer Beef Cow Farms

    In the previous SAT livestock article, Dr. Griffith asked about the girls’ whereabouts. Last week, the USDA/NASS released the 2022 Agricultural Census. Every five years, the Census takes a snapshot of U.S. agricultural operations. There is a wealth of interesting insights in the census data.  The data also sheds light on the structural changes in beef cow operations. The decrease in beef cow ranches could slow future herd expansion. 

    Figure 1 highlights the decline in beef and milk cow farms. Between 2017 and 2022, 106,844 beef cow ranches disappeared, a 15 percent drop. In the same period, milk cow farms decreased by 34 percent. In contrast to the 2012 drought, we have fewer beef cow ranches to rebuild the herd, making it more challenging to find our girls. The contractions in cow farms are steeper than the overall number of farmers, which has declined by 6.9 percent, according to USDA/NASS. 

    Figure 1 – Number of Cow Farms: 2002 – 2022.

    Source: 2022 USDA/NASS Census

    Although there has been a decline in beef cow farms, the Census has reported an increase of 1,034 ranches with more than 500 head (Fig. 2). From 2017 to 2022, the beef cow herd has decreased by 2.5 million head. However, there has been an increase of 839,603 head in farms with more than 500 head. It indicates industry consolidation, providing insights into where we may find our girls.   

    Figure 2 – Number of Beef Cow Farms by Herd Size: 2017 – 2022.

    Source: 2022 USDA/NASS Census

    Beef cow farms shrunk across all farm size categories (Fig. 3). Most beef cow ranches are between 10 and 49.9 acres. Between 2017 and 2022, this category displayed the smallest drop, 9 percent, showing its resilience. But, during this period, the extremes recorded the most significant declines, producers with 1 to 10 acres declined by 23 percent, and 1000 to 2000 acres ranches declined by 20 percent. Regardless of the production scale, environmental, and economic factors affected beef cow ranches’ survivorship.

    Figure 3 – Number of Beef Cow Farms by Herd Size: 2017 – 2022.

    Source: 2022 USDA/NASS Census

    The 2022 USDA/NASS Agricultural Census reported a decline in beef cow operations from 2017 to 2022.  The census also reported some growth in larger operations.  The effect of fewer total operations on the speed of herd rebuilding remains to be seen.


    Calil, Yuri. “Ag Census Reveals Fewer Beef Cow Farms.Southern Ag Today 4(8.2). February 20, 2024. Permalink

  • Soybean Option Strategies

    Soybean Option Strategies

    Since the start of 2024, soybean futures prices have declined dramatically (Figure 1). The March and November contracts have declined 88 cents and 57 cents, respectively. The primary reason for the decline in soybean prices has been the projected large crop in South America. The February USDA WASDE report estimated soybean production in Argentina and Brazil at 1.84 and 5.73 billion bushels, respectively, compared to last year’s record Brazilian crop of 5.95 billion bushels and Argentina’s drought-stricken crop of 0.92 billion bushels. In aggregate, the two South American soybean production powerhouses are projected to increase year-over-year production by 700 million bushels. Increased production with moderate global demand will continue to weigh on futures market prices in 2024. Prices could be pushed higher if China increases soybean purchases or drought impacts US soybean production.

    Figure 1. Daily Closing Futures Prices for March (ZSH24) and November (ZSX24) Soybeans, January 2 to February 13, 2024

    Producers may want to consider using options to help mitigate price risk during the production or marketing year. Options can be a useful tool to manage price risk during specific time intervals. Past articles have examined mitigating price risk between the time when inputs were purchased and projected crop insurance prices were determined (Duncan, 2024). This article examines two option strategies for the start of the 2024 crop.

    Strategy #1: Purchase a put option. Purchasing a put option establishes a futures price floor for the selected strike price (Table 1). For example, a producer could purchase a $10.20 put option for 16.5 cents and set a $10.03 ½ futures floor. Strike prices and premiums can be selected to reflect the purchaser’s risk preference. No margin is required for strategies that purchase put options.

    Table 1. Strike price and premium for November soybean put options, February 14, 2024

    Strike (cents/bu)Premium (cents/bu)
    1000-0P12.9
    1020-0P16.5
    1040-0P20.9
    1060-0P26.0
    1080-0P32.1
    1100-0P39.1
    1120-0P47.0
    1140-0P55.9
    1160-0P65.8
    1180-0P76.5
    1200-0P88.1

    Strategy #2: Purchase a $10.60 November put option for 26 cents and sell a $13.00 November call option for 26 cents. This strategy fences in a futures price between $10.60 and $13.00 for a net zero premium. The strategy protects against futures prices declining below $10.60 at the cost of forgoing price increases above $13.00. This strategy relies on maintaining margin requirements.

    There are two primary concerns that producers voice when examining options 1) premiums are too high and 2) options often expire worthless. These two factors are interrelated as options should be used for a defined period of risk and then the position liquidated if the option is out-of-the-money, before the option expires. This avoids having the option expire worthless and can assist in recouping part of the premium. If options are in the money, then the position can be exercised, and financial gains realized. For experienced users of options, there are near infinite variations in strategy to consider (contract month, strike price, buy/sell puts or calls). Developing knowledge on using options adds another tool producers can use to manage their price risk.

    References and Resources

    Barchart.com. November Soybean Options Price Quotes.   https://www.barchart.com/futures/quotes/ZSX24/options.  

    Duncan, W.H. 2024. “Bridging the Price Risk Gap.” Southern AgToday. https://southernagtoday.org/2023/11/27/bridging-the-price-risk-gap/

    USDA World Agricultural Supply and Demand Estimates (WASDE) Report. Office of the Chief Economist. February 2024. https://www.usda.gov/oce/commodity/wasde


    Smith, Aaron. “Soybean Option Strategies.” Southern Ag Today 4(8.1). February 19, 2024. Permalink

  • Part 1: Cultivating Resilience and Innovation in US Specialty Crop Economics: Navigating Market Dynamics, Labor Challenges, and Global Realities

    Part 1: Cultivating Resilience and Innovation in US Specialty Crop Economics: Navigating Market Dynamics, Labor Challenges, and Global Realities

    The economics of the ever-evolving landscape of the US specialty crop industry demands a comprehensive understanding of the factors influencing competitiveness. In this article, the author identifies key economic drivers impacting the sector and emphasizes the imperative for resilience, innovation, and strategic choices as opportunities available that may improve sustainability of specialty crop stakeholders in the United States.

    Distinct Economic Factors Shaping US Specialty Crop Industry Competitiveness

    Dynamic Market Windows

    The market for specialty crops is characterized by its fast-paced nature and a continuous narrowing of windows for product availability. Compounded by a widening gap between processed and fresh produce prices, growers face the additional challenge of meeting retailer demands for product homogeneity and year-round supplies. This underscores the need for agility and responsiveness in the face of evolving market dynamics.

    Labor Costs and Dynamics

    A significant demand for farm workers in the production, harvesting, and packing of fresh, higher-valued crops is evidenced by the increase in H2A certifications from approximately 48,000 in FY 2005 to 370,000 in FY 2022 (Figure 1). Despite this shift, total employment across produce operations has seen minimal growth in recent years. The surge in H2A certifications, particularly in southern states, highlights the industry’s dependence on seasonal labor. Addressing labor challenges continues to be a critical factor for maintaining economic viability.

    Perishable and Seasonal Challenges

    Limited access to land and water suitable for high-value fruit and vegetable production poses a substantial challenge. Genetic packages for many fresh vegetables prioritizing shipping and storage needs and disease and pest pressure reductions, and while crucial concerns, may come at the cost of product quality and nutritional value, further reducing consumer demand.

    Consumption Trends and Health Implications

    US consumers’ declining consumption of fruits and vegetables over the past two decades, coupled with a shortfall in meeting recommended dietary guidelines, raises concerns for public health (Figure 2). Strategies to bridge this gap involve not only production considerations but also consumer education to expand palates and encouragement to add produce to their diets to support health and wellness.

    Global Network Exposure:

    The heightened supply chain risks, driven by regulatory changes and increasing costs related to carbon emissions, underscore the industry’s vulnerability. The lag in grower adoption of automation technologies highlights the need for the industry to embrace innovation for increased efficiency and competitiveness. Researchers and educators need to find ways to improve knowledge of the value added from tech solutions and, more importantly, function as intermediaries to bring producer and market needs back to the tech developers.

    Figure 1. The number of H-2A jobs certified increased more than sevenfold from fiscal years 2005 to 2022.

    Figure 2. Estimated average U.S. consumption compared to recommendations, 1970 to 2018.

    Stay tuned for Part 2: Economic Choices for US Specialty Crop Industry Success!