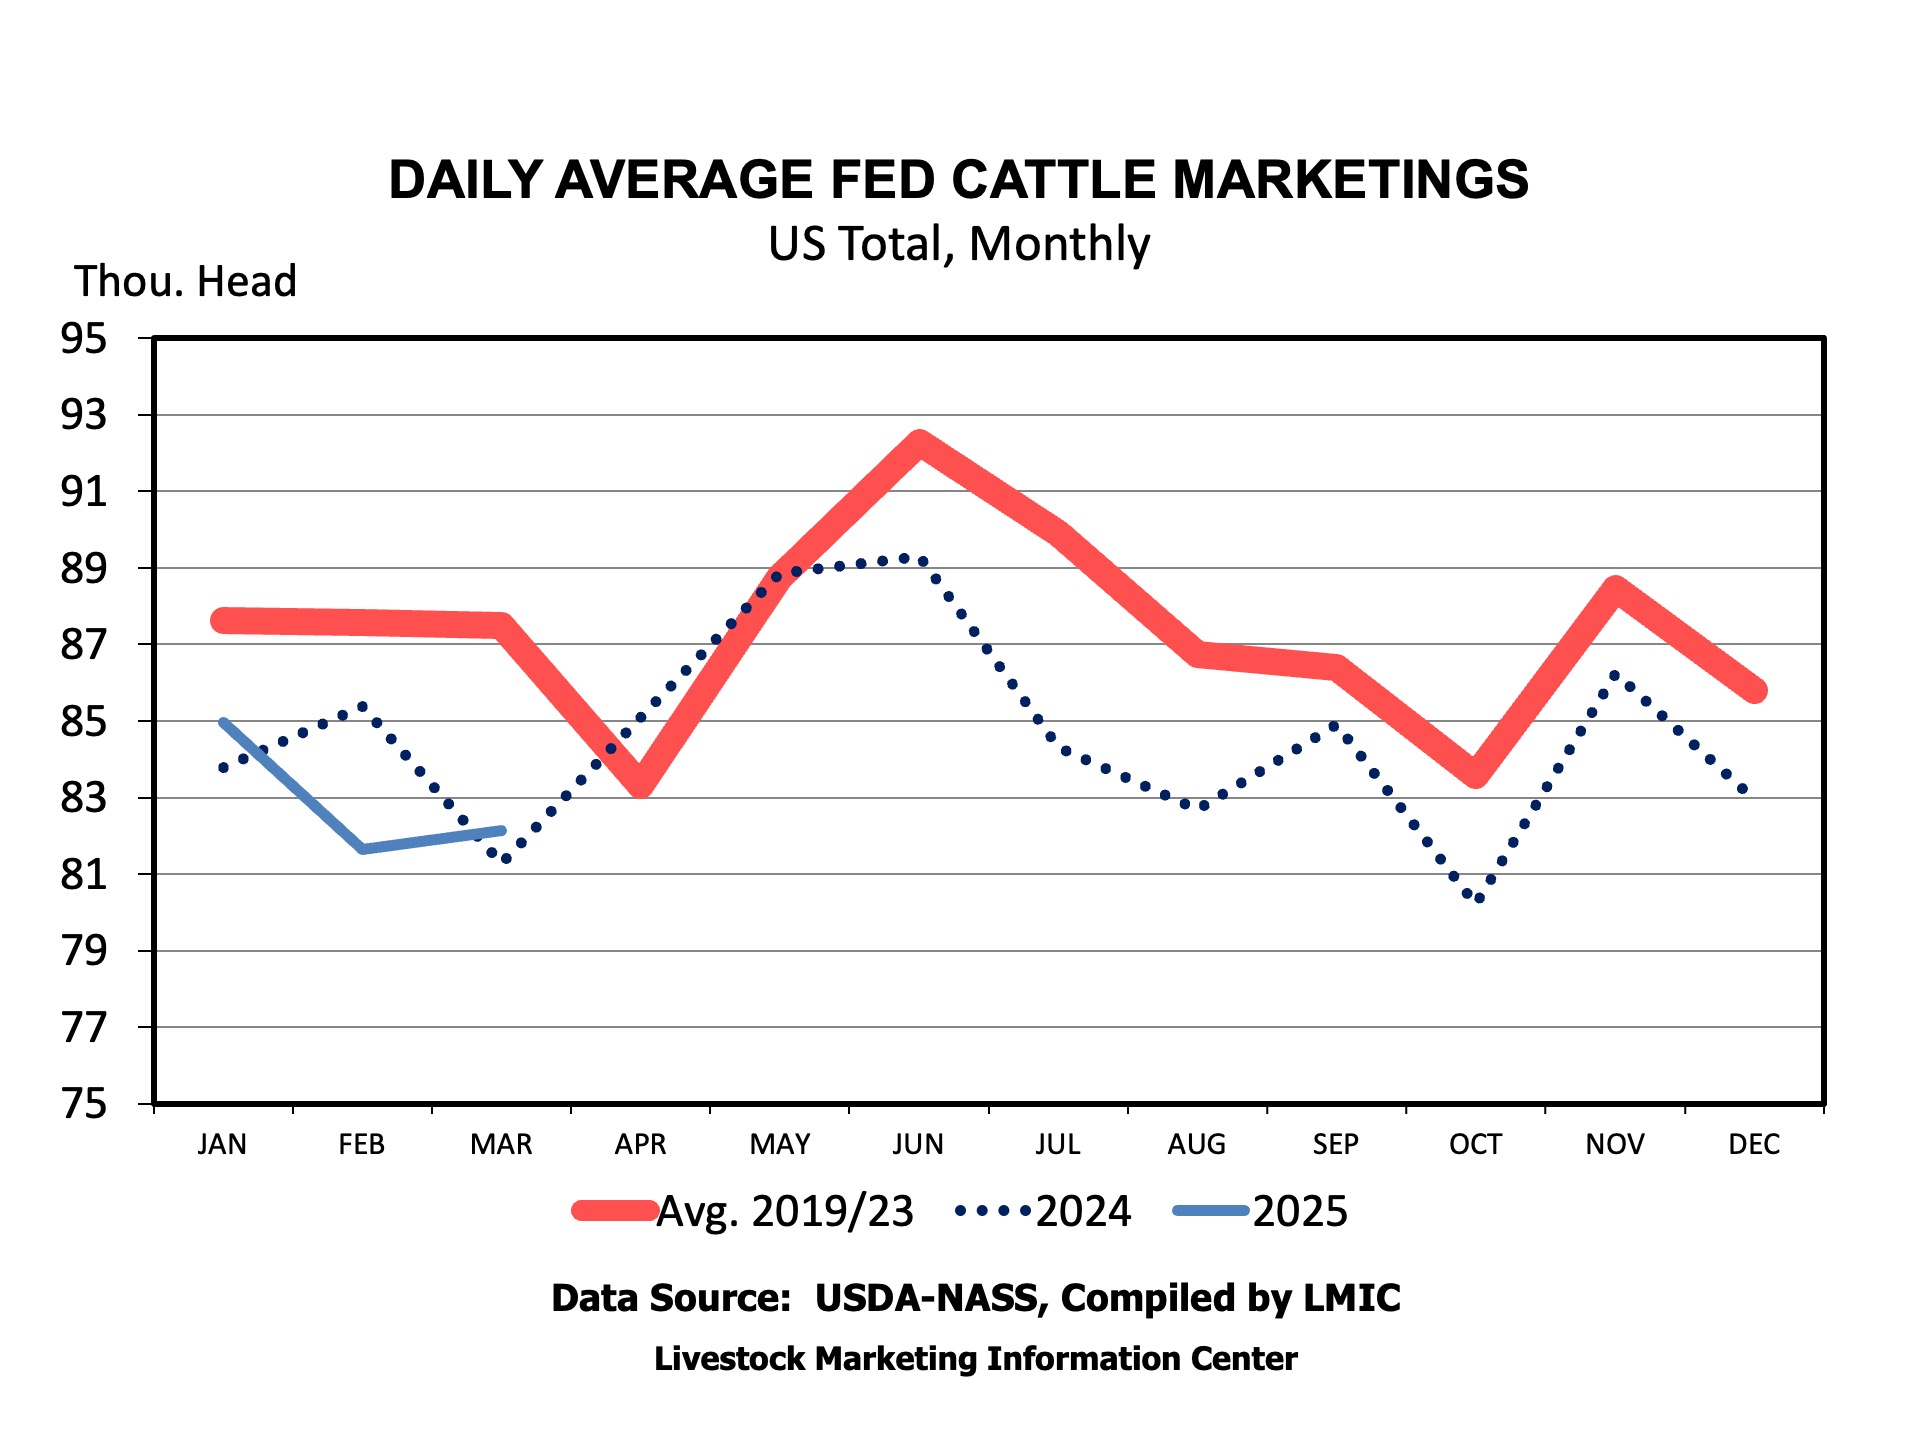
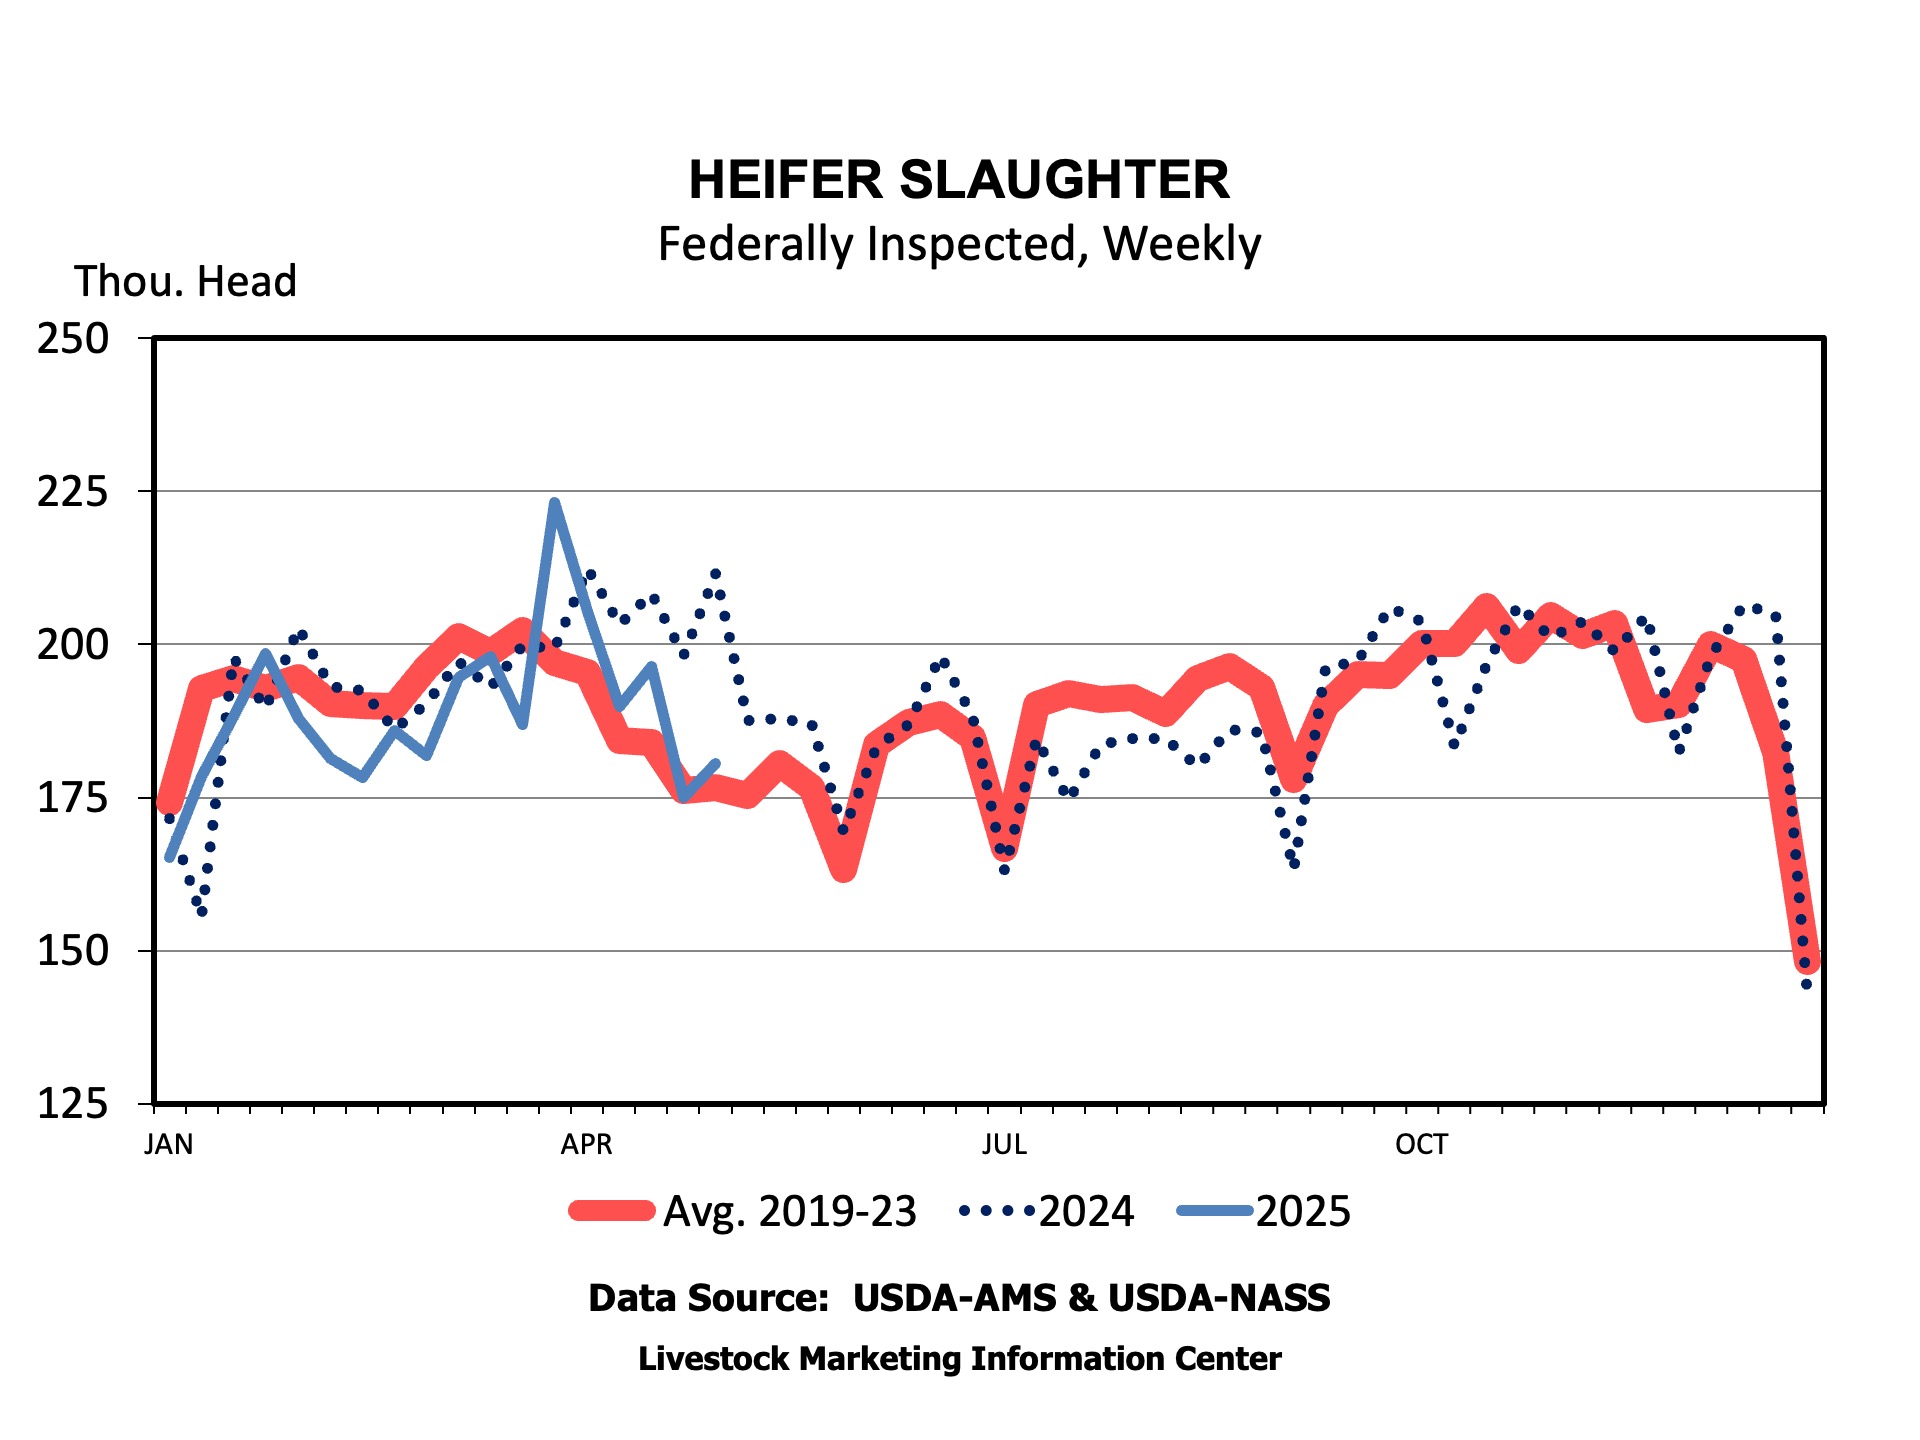
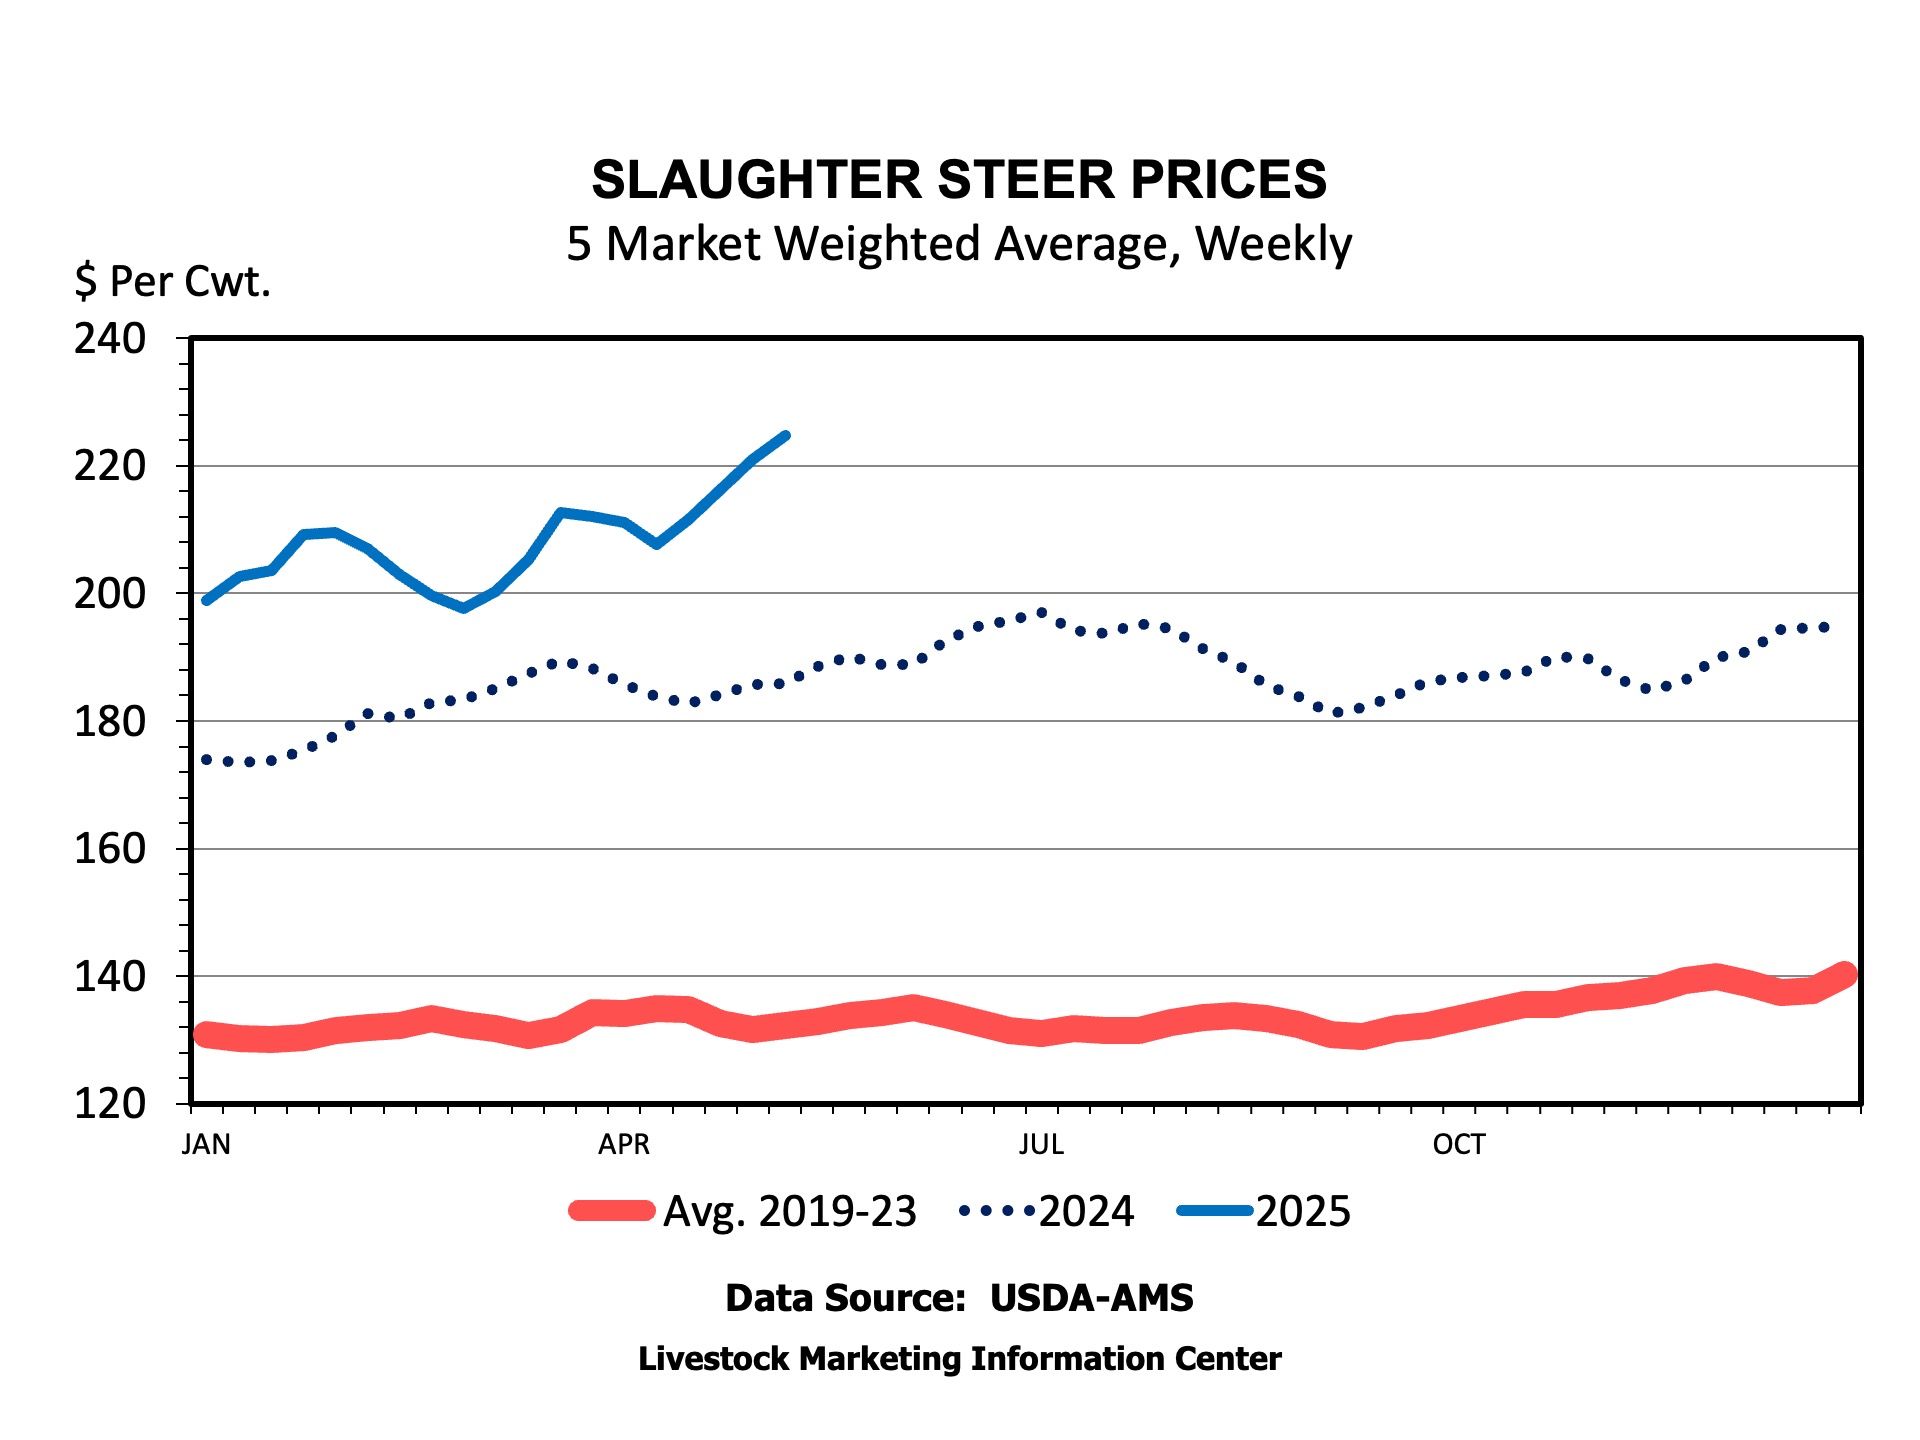
Friday, May 23rd, brings us the next USDA Cattle on Feed report. Most analysts anticipate April’s feedlot marketings to be more than 3 percent smaller than last year, with the same number of working days in April 2025 compared to April 2024. Fed steer and heifer slaughter has declined dramatically, more than 5 percent from year-ago levels, over the last six weeks.
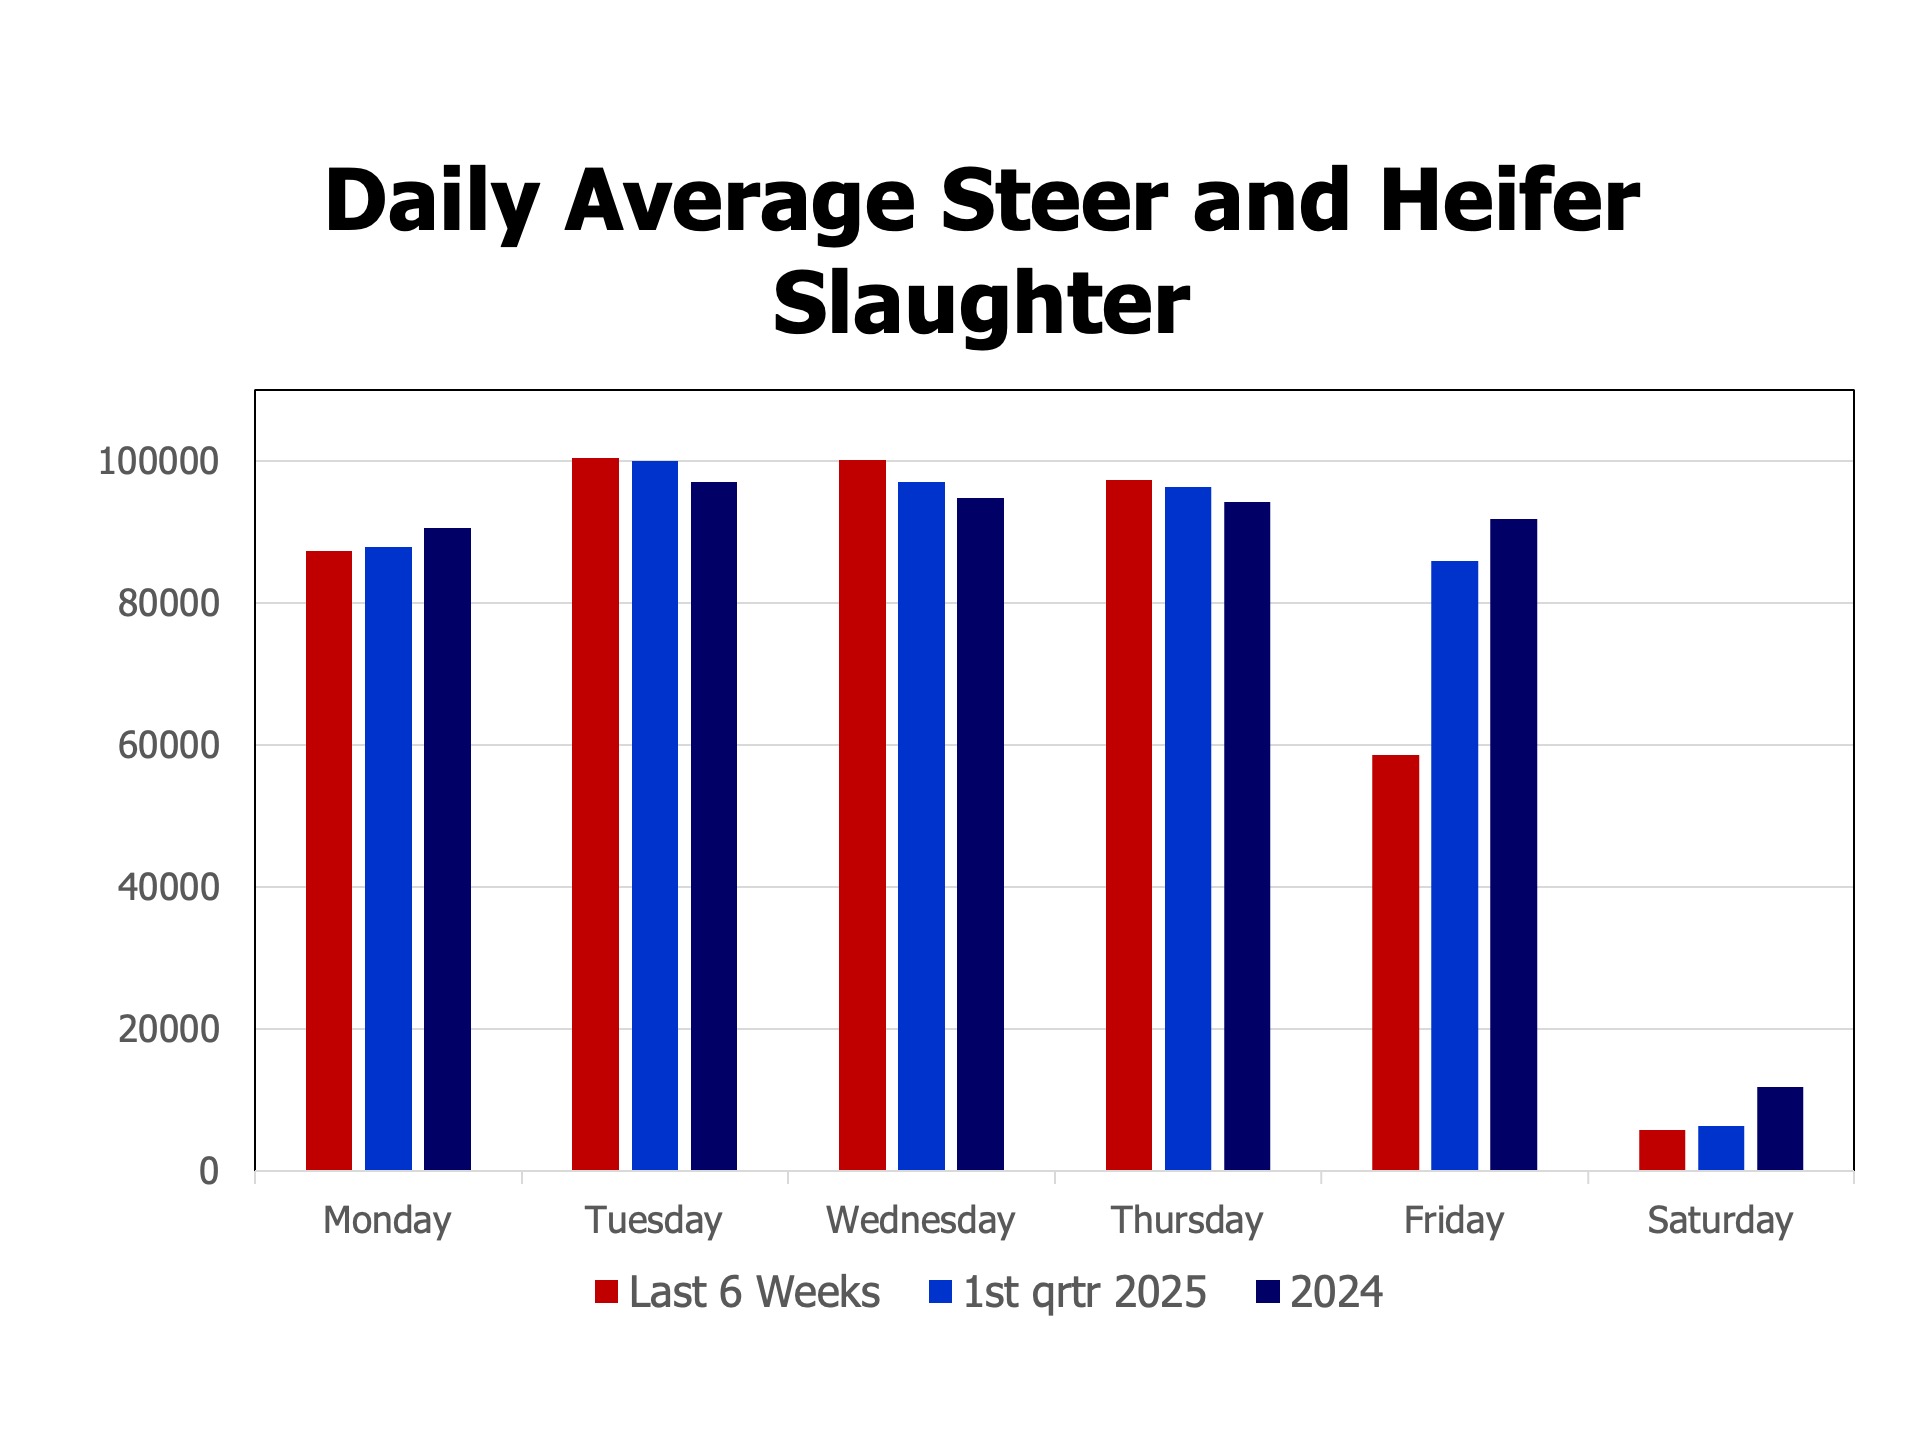
Saturday slaughter is often used as a measure of capacity utilization. Fewer animals processed on Saturdays indicates declining capacity utilization or over capacity. Declining cattle numbers mean that fewer may be processed on other days of the week. Daily slaughter should suggest some thoughts about the ability of current packing plants to remain open in future months as cattle numbers contract.
Over the last 6 weeks, steer and heifer slaughter has averaged 58,671 head on Fridays, down from 85,958 head during the first quarter of the year. Other days of the week have remained relatively close to the average during the first quarter of the year and compared to all of 2024. It appears that overall, packers are dealing with fewer cattle numbers by maintaining capacity on Monday through Thursday, even increasing head per day in the middle of the week, while sharply cutting back on Friday.
The decline in fed steer and heifer slaughter, even combined with historically heavy dressed weights, has certainly supported fed cattle prices to new record highs in recent weeks. Grilling season beef demand has pulled the market even higher. Feeder cattle and calf prices have gone along for the ride. The cattle on feed report will provide another indication of how tight fed cattle supplies will be in the next few months. Fewer cattle on feed will continue the trend of reduced Friday slaughter and may lead to reductions on other days, as well.
Pasture, Rangeland, and Forage (PRF) insurance has become a key risk management tool for ranchers and forage producers looking to protect themselves against the unpredictability of rainfall. However, like all insurance products, PRF comes with its own set of risks. In this article, we explore the risk associated with producer interval selection and its potential downsides and upsides.
A unique risk with PRF insurance is that rainfall during a particular two-month interval does not necessarily lead to forage growth during that interval. Rainfall is obviously crucial for forage production, but the impact of precipitation on forage is not instantaneous. Often, rain that occurs during one interval may contribute to forage growth in the following months more than the month in which the rain occurred. Therefore, choosing a PRF interval that aligns directly with your critical forage production interval could potentially be a mismatch.
A downside of this timing mismatch is that a producer may not receive an indemnity payment when needed. For instance, if the insured interval experiences average rainfall but the interval prior had low precipitation or the rain came towards the end of an interval, the forage growth may still be insufficient. Unfortunately, since the payment is based strictly on the rainfall during the insured interval, producers might not receive any payout despite facing significant challenges. The chance of this outcome occurring is considered a False Negative Probability (FNP). False in the sense that the signal (rainfall) did not correspond with the underlying production need (forage production), and negative in that the outcome provided no protection when you needed it.
On the flip side, this same mismatch can work in favor of producers. Suppose the insured interval experiences low rainfall, but the previous interval had good precipitation. In that case, sufficient forage growth can occur in the insured interval, and the insured can still receive an indemnity payment. The likelihood of the PRF policy providing a payment even when forage conditions are favorable is the False Positive Probability (FPP).
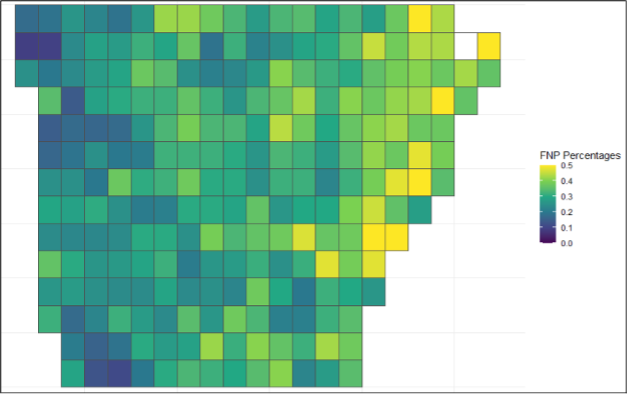
Figure 1 below illustrates this potential downside risk through the prevalence of FNPs in grids in Arkansas. These values were calculated by creating a forage/vegetation index to match the Rainfall Index used by the PRF program. Using Normalized Difference Vegetation Index (NDVI) values, we found the FNP percentages for each grid and each interval. Figure 1 highlights the June-July interval, telling us the percent chance that the forage/vegetation index would indicate a need for an indemnity based on the coverage level when the policy using the rainfall index has not been triggered (Keller & Saitone, 2022). This shows the prevalence of this issue and that producers in certain regions should be more wary of this type of risk.
A unique risk with PRF insurance is tha
Figure 1: False Negative Probability Percentages in Arkansas Grids for the June-July Interval (1981-2023)
Note: These values were calculated using an assumed 90% coverage level
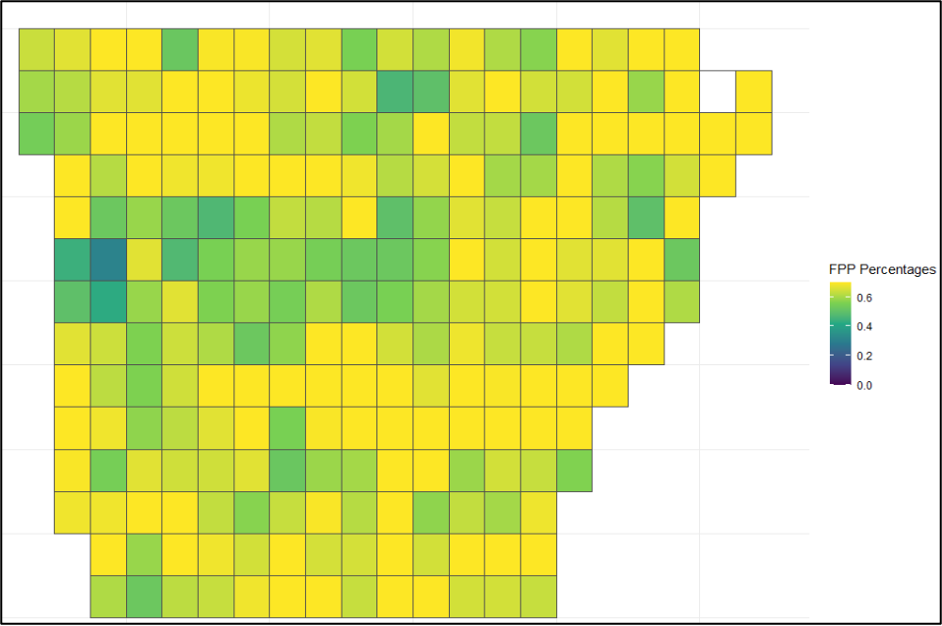
Inversely, Figure 2 presents the frequency of FPPs showing the upside risk. Reversing the methodology, these were calculated as the percent chance that the rainfall index indicates an indemnity should be issued based on the coverage level when the forage/vegetation index says an indemnity should not be issued. This scenario tends to be more prevalent, which is good for the policyholder. Certain grids exhibiting high FPPs also tend to show high FNPs, indicating they might frequently receive unwarranted payments while simultaneously facing situations where they do not receive payments when needed. This raises an issue with the producer, causing them to change how they manage their finances to protect themselves instead of the program doing so properly.
Figure 2: False Positive Probability Percentages in Arkansas Grids for the June-July Interval (1981-2023)
Note: These values were calculated using an assumed 90% coverage level.
While these figures only highlight the prevalence of FNP and FPP in Arkansas, these risks are inherent in PRF and are just as likely in the other southern states. To counter this risk, producers should consider not only the months when forage is most needed, but also the months when moisture and precipitation are most important. Using this information, they can choose their PRF intervals appropriately and reduce the risks involved in the program.
References
Keller, James B., and Tina L. Saitone. 2022. “Basis Risk in the Pasture, Rangeland, and Forage Insurance Program: Evidence from California.” American Journal of Agricultural Economics 104 (4): 1203–23.
If you have been following the national agricultural news lately, beyond discussions on policy, there has been a focus on states’ legislatures considering “Crop Protection” legislation. This liability protection would extend to companies producing federally approved pesticides.
We have all seen the news of large settlements from users of federally approved pesticides claiming linkages between their use and cancer. The biggest of these lawsuits is the Roundup litigation. To date, Bayer has paid roughly $10 billion to settle claims that Roundup has caused cancer. At the same time, class actions have been filed against Syngenta, the manufacturer of Paraquat, for claims that the product causes Parkinson’s Disease. Finally, AMVAC Chemical Corporation has been sued due to claims that Dacthal (DCPA) has caused birth defects.
The debate on Crop Protection legislation concerns this type of litigation. Under the legislation being proposed in several states, as long as the federally approved pesticide includes a label with the most recent human health assessment required under the Federal Insecticide, Fungicide, and Rodenticide Act (FIFRA) or a label containing consistent with the Environmental Protection Agency’s (EPA) carcinogenicity classification for the pesticide required under FIFRA this would be a sufficient warning label. Under the legislation, this label would be enough to meet the duty to warn under state law. This would severely limit the ability for users to sue later for alleged health issues (such as cancer or Parkinson’s Disease).
This legislation has been signed into law in North Dakota, and as of the writing of this article, it has passed the Georgia legislature and has not been signed by the Governor. Similar legislation is currently before the legislatures in Florida, Iowa, Missouri, Oklahoma, and Tennessee.
The global rice market in the last two years has been a rollercoaster driven mostly by India’s export restrictions and, since October of last year, by its massive rice crop. India’s production performance has been remarkable, breaking a new production record every year for the last ten years. USDA (2025a) estimates that production in marketing year 2024 (still in progress in India with the smaller rabi crop) will reach 147 million metric tons (MMT), milled basis, and exports could go as high as 24.5 MMT, significantly above the record 22 MMT exported in 2021.
Indonesia is also contributing to the bearish tone of the global rice market. While total rice consumption and production have followed a downward trend in the last decade, consumption rebounded in 2023 and 2024 while production kept falling, which created a surge in imports. Indonesia was the second-largest rice importer in 2023 and the largest in 2024, when imports reached 4.7 MMT. Weather is supporting the growth of production in 2025, which, together with ample stocks bought at competitive prices, suggests that Indonesia will need less than 1 MMT of imports this year (USDA, 2025a).
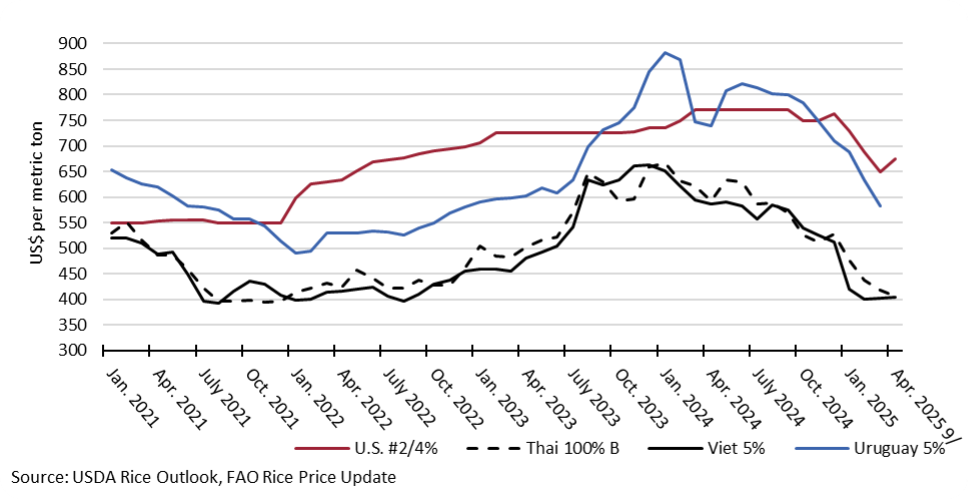
From the above, we can infer why long-grain rice prices have been under pressure since last October (Figure 1). Export prices out of Thailand and Vietnam have decreased by over $160/MT or 29% in the last six months, although they seem to have found a floor at around $400/MT in the last few weeks. Export prices out of Mercosur (Argentina, Brazil, Paraguay, and Uruguay) have also decreased sharply; for example, the export price of Uruguayan 5% long-grain rice averaged $582/MT in March relative to $800/MT in October, according to FAO (2025). The export price of U.S. long-grain #2/4% decreased but to a smaller extent (12%) over the last six months and seems to have found a floor at around $650/MT. Interestingly, amid decreasing long-grain prices across the board, U.S. export prices remain more resilient, even when the low milling quality of the U.S. crop has been a significant concern. Of particular concern for the milling industry is the fact that U.S farm prices have remained mostly unchanged: USDA average farm price decreased only 3% from $14.5/cwt in August to $4.2/cwt in April (USDA, 2025b). Lower export prices and steady domestic paddy prices put the squeeze on milling margins.
Nine months into the 2024/25 marketing year, the U.S. has exported 2.29 MMT (paddy basis) of long-grain rice, a 21% smaller amount relative to last year, driven by a decrease in paddy exports to all major markets (Mexico, Central America, and Colombia). Paddy rice from Mercosur continues to gain market share in core U.S. paddy markets. Exports of long-grain milled rice are at par with the previous year’s performance, thanks to the growth of exports to Iraq, which helps offset a sizable market loss in Haiti. U.S. exports will face higher competition from Mercosur in 2025, driven by a significant increase in production in Brazil and, to a lesser extent, Argentina, Paraguay, and Uruguay, which will result in more rice available for export.
Given the global and regional situation described above, what can we expect for the upcoming marketing year? USDA’s March 2025 prospective plantings (USDA, 2025c) suggest a similar crop than last year (2.24 million acres in 2025 relative to 2.28 million in 2024). Excessive rains in Arkansas early April have complicated crop establishment and caused significant infrastructure damage. Despite that, as of May 4th planting progress was almost 80%, but with a mix of situations depending on location (UADA, 2025a). The USDA projects the 2025 long-grain rice production at 167.2 million cwt, around 3% below the 2024 crop, and exports at 68 million cwt, slightly higher than in 2024. As discussed earlier, lower export prices have not caught up with farm prices so far, but a bearish global market will indicate that farm prices will adjust downward. For example, FAPRI (2025) projects that long-grain farm prices will drop below the reference price in 2025/26 to $13.28/cwt, while USDA’s WASDE report (USDA, 2025b) estimates an average farm price of $12/cwt for long grain rice. Looking at the University of Arkansas Rice Enterprise Budgets (UADA, 2025b) with those farm prices, the picture that emerges is worrisome, as all budgets yield negative returns above operating costs.
Figure 1. Monthly average export price of long-grain rice from selected exporters.
The May 2025 World Agricultural Supply and Demand Estimates (WASDE) is a highly anticipated report as it offers the first official USDA estimates of the new crop marketing year (USDA, 2025). For 2025/2026, the estimates show a divergence of fundamental factors in the U.S. grain markets. Estimated days of use on hand at the end of the marketing year (a stocks-to-use ratio calculated by dividing ending stocks by average daily use) are projected to increase in 2025/2026 compared to 2024/2025 for corn, wheat, and rice. Conjointly, the season average farm price is projected lower for these three grains. For soybeans, days of use on hand are forecast to decrease and the farm price is forecast to increase compared to last year.
Based on the Prospective Plantings report back in March, corn acres for 2025 are projected at 95.3 million, up from 90.6 million in 2024. USDA’s yield estimate for 2025 is a record high 181.0 bushels per acre. This combines for a record corn crop of 15.820 billion bushels. Add in 1.415 billion bushels of beginning stocks and the corn supply in the 2025/2026 marketing year is a record 17.206 billion bushels, up 3.6% from last year.
U.S. corn use is projected at record levels as well with increases in feed and exports. However, the increase in corn supply exceeds the increase in use, resulting in an increase in ending stocks. Days on hand increased by an 8.6-day supply, and the season average farm price is down from $4.35/bu last year to $4.20/bu. With a PLC reference price in 2025 of $4.26/bu, that would earn a 6-cent-per-bushel payment.
Soybean acres for 2025 are estimated at 83.5 million, down from 87.1 million in 2024. But with a record forecast yield of 52.5 bushels per acre, production in 2025 is down only 26 million bushels from 2024. Soybean use is forecast to increase by 31 million bushels on increased domestic crushings. Ending stocks are expected to decrease by 55 million bushels, and days of use on hand are expected to decline by 4.8 days. The season average farm price is projected to increase by 30 cents per bushel to $10.25.
U.S. wheat production is estimated to be little changed from the 2024 crop with the decrease in acres mostly offset by a higher yield estimate. Impacting the wheat supply for 2025/2026 is an increase in beginning stocks and a decrease in projected imports (-30 million bushels). Wheat use is projected lower on a decrease in exports of 20 million bushels. This raises the wheat ending stock estimate by 82 million bushels, increases carryover to a 172-day supply, and lowers the season average farm price from $5.50/bu last year to $5.30/bu. With a $5.56/bu reference price, this would generate a PLC payment of 26 cents per bushel.
The U.S. rice supply in 2025/2026 is projected higher, as an increase in beginning stocks offsets a small decline in production. Use is up 1 million hundredweight with an increase in domestic use and a decrease in exports. This leaves ending stocks up 3.5 million hundredweight and days on hand higher by 3.2. The farm price is down $2 per hundredweight to $13.20, below the PLC reference price of $14.00.
Of course, much can change between these early season estimates and final crop production and use numbers. Weather, trade policies, the economy, global grain fundamentals, and other factors foreseen and unforeseen, will evolve and emerge to shape grain prices. The May WASDE is an important benchmark to assess and estimate the impact of these changes and forces as the season unfolds.
Table 1. May 2025 WASDE Numbers for U.S. Grains (corn, soybeans, and wheat in millions of bushels; rice million hundredweight) and 2025 PLC Reference Prices and Estimated Payment Rate.
Crop
Corn
Soybeans
Wheat
Rice
mil bu
change*
mil bu
change*
mil bu
change*
mil cwt
change*
Beginning Stocks
1,415
-348
350
+8
841
+145
45.0
+5.2
Production
15,820**
+953
4,340
-26
1,921
-50
219.3
-2.8
Total Supply
17,260**
+605
4,710
-24
2,882
+64
313.5**
+3.5
Total Use
15,460**
+220
4,415
+31
1,959
-18
266.0**
+1.0
Ending Stocks
1,800
+385
295
-55
923
+82
47.5
+2.5
Days on Hand
42.5
+8.6
24.4
-4.8
172.0
+16.7
65.2
+3.2
Price $/bu or $/cwt
Farm Price
$4.20
-$0.15
$10.25
$0.30
$5.30
-$0.20
$13.20
-$2.00
PLC Reference Price
$4.26
$9.26
$5.56
$14.00
PLC payment rate
$0.06
$0.00
$0.26
$0.80
*change 2025/26 marketing year compared 2024/25 marketing year.