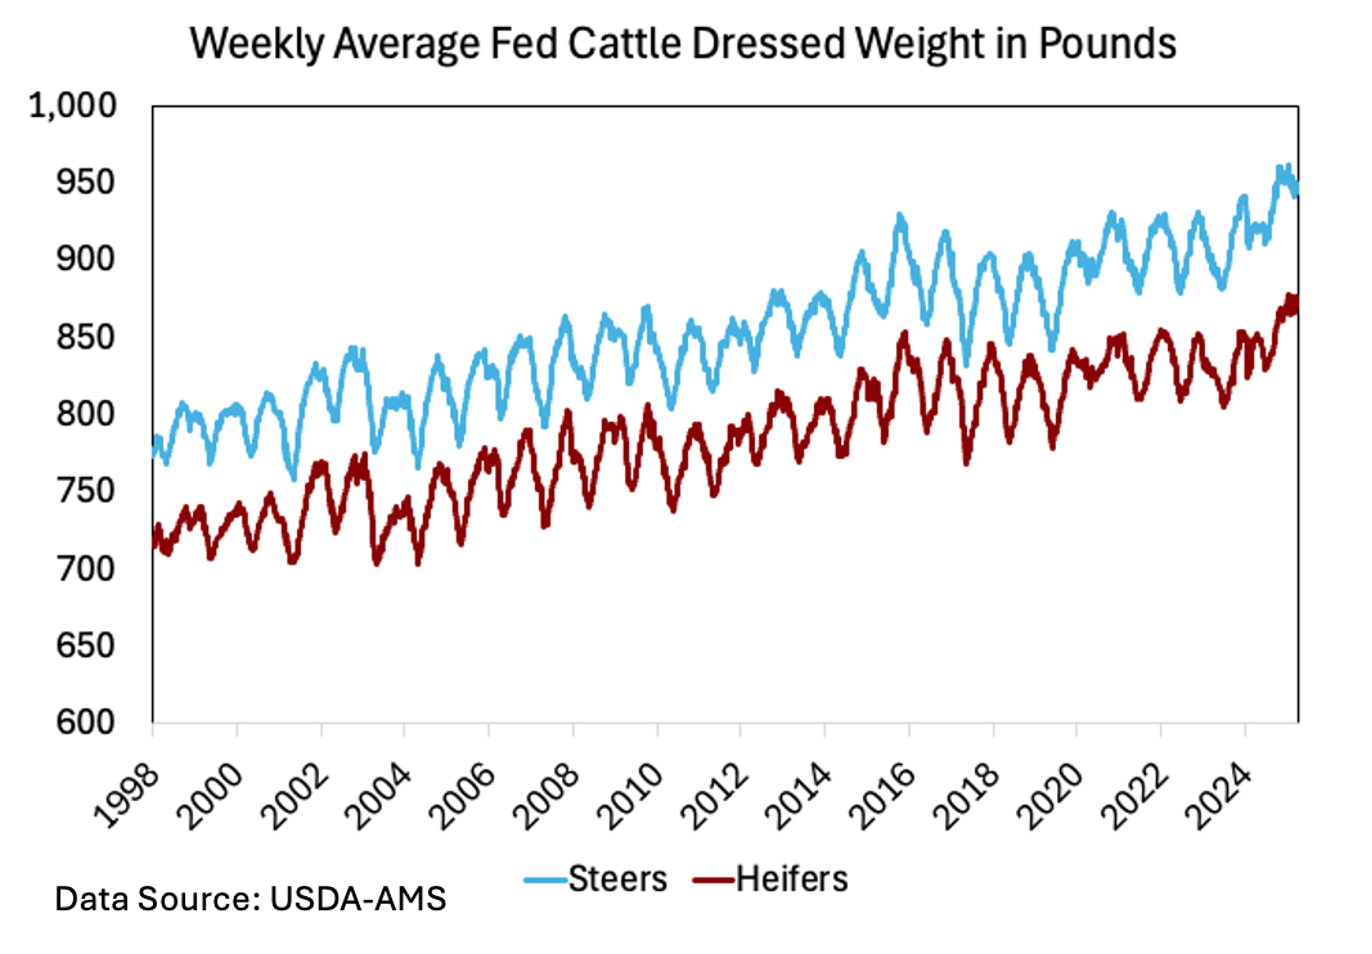
Last week, the 5-area market weighted average fed steer price topped $220 per cwt for the first time on record. This was a $35 increase from a year ago and up $20 per cwt since the start of the year. The CME June Live Cattle futures contract closed above $213 per cwt on Monday – also a record high for that contract. Looking across a longer time frame, the trends of fed cattle weights and beef quality grades over time are interesting. As shown on the dressed weight chart, fed cattle dressed weights have increased over time. Technological advances in raising cattle have allowed the sector to produce more beef per head. The chart shows a few years of declining weights and seasonal patterns within years, but the general trend is increasing fed steer weights over time. Assuming a 62.5 percent average dressing percentage, a 950-pound dressed weight would equal a 1,520-pound live weight. Larger weights in 2024 boosted beef supplies to offset fewer head processed.
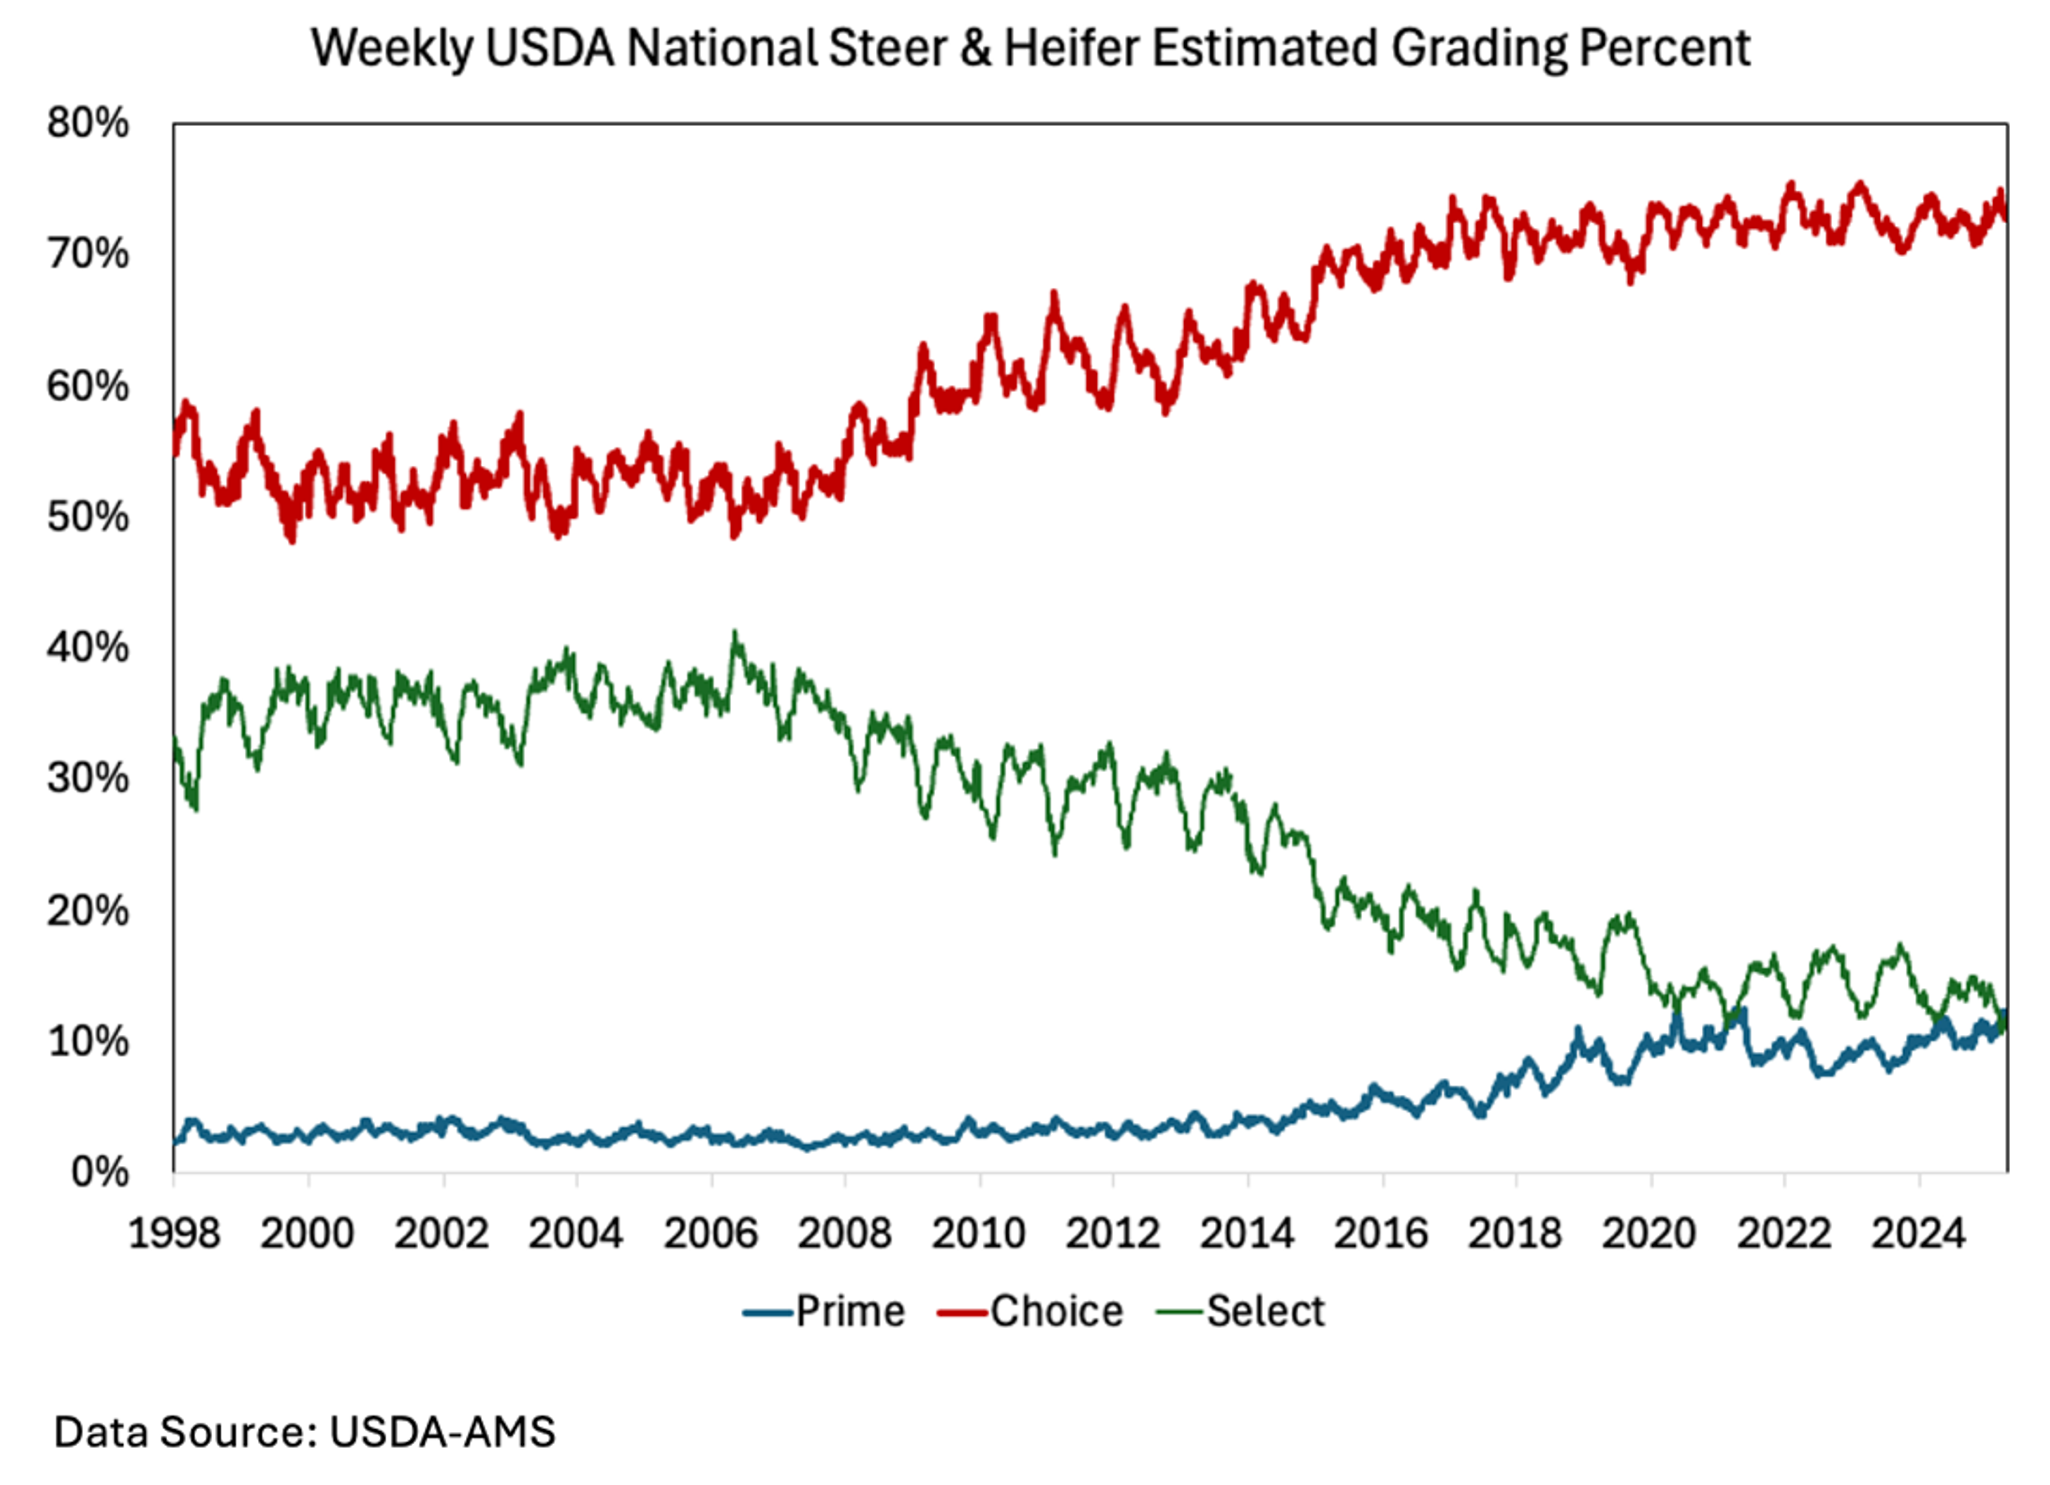
Another interesting (and related) trend is that of quality grades over time. The grading percent chart shows the percentages of fed cattle grading Prime, Choice, and Select weekly since 1998. Choice carcasses represented about 50-55 percent of the cattle in the 2000s but have more recently been hovering in the 75 percent range. Meanwhile, the percentage of cattle grading select has declined from roughly 35 percent in the early 2000s to less than 15 percent in recent years. Genetic improvements, cow-calf and stocker management practices, and feedlot technologies have played roles in this increase. It is also worth noting the more recent increase in carcasses grading prime. For the past few weeks, more cattle have graded prime than select. About 3-4 percent of cattle graded prime in the 2000s compared to 10-12 percent in recent years.
Limited labor availability has been a constant challenge for many American farmers. While labor shortages impacting the agricultural sector have been well documented by economists and highlighted by the popular press, the focus has been on the need for workers in labor-intensive sectors, like the production of fruits and vegetables. The emphasis on these industries is well deserved. According to data from the USDA, labor costs can be as high as 35% for fruit and nursery farmers, and their dire need for workers has been reflected in their growing reliance on foreign temporary workers coming under H-2A visas. Less attention has been paid to the labor demand of other producers, like animal sector farmers.
To better understand the specific workforce needs of livestock farmers, we conducted a survey last year of cattle and dairy producers in Wisconsin, Georgia, and North Carolina. Unlike the case of specialty crop producers, labor inputs represent a significantly smaller share of total production costs for dairy and cattle farmers (Table 1). Almost half of the survey respondents (46.86%) indicated that labor accounted for less than 5% of their total costs. Moreover, almost 96% said labor costs were no more than 25% of their aggregate bills. Animal feed, land, transportation, and fuel likely account for a larger share of total costs. Although dairy and cattle farmers might not be relying on many workers in their current operations, we wanted to know more about their plans and if they were foreseeing a subsequent jump in their need for additional workers. Nearly 60% of farmers indicated they were planning to employ about the same number of workers going forward (Table 2). Only 4.31% said they would hire more people, but 27.59% were not sure about their short-term future labor demand.
Our survey also asked farmers about their preferences towards potential modifications to the H-2A program. Under current rules, only growers of seasonal crops (commodities whose production processes take less than a year) can hire H-2A workers. This has been cited as a major limitation for dairy producers and farmers of agricultural commodities with operations running year-round. Likewise, the increasing minimum wages of H-2A laborers are a major concern among current and potential users of this program, and hiring gaps between sectors have been associated with wage disparities arising from such costs (Escalante et al., 2025). The Farm Workforce Modernization Act has been introduced in Congress multiple times but has not been passed. The proposed legislation would make several changes to the rules of the H-2A program. We shared some of the changes with respondents and asked them to indicate which was the most important for them. Interestingly, about a third cited having the government cover or subsidize housing costs (Table 3). Another third said that creating a yearly quota of H-2A workers allocated specifically to non-seasonal sectors like dairy (which would imply giving access to such farmers to the program) was their top choice. The proposed change chosen the least was legalizing currently undocumented workers (as only 5.88% of the sample selected this option).
Altogether, we document that labor represents a relatively small fraction of total costs for dairy and cattle producers. In addition, most farmers are not planning to hire many more workers in the foreseeable future. These findings suggest that access to labor is less of a constraint to animal sector producers compared to their fruit, vegetable, and indoor plant counterparts. However, the results also show that livestock producers would welcome updates to the H-2A program that would allow them to access this source of foreign legal agricultural workers. This is likely the case, as labor is still a crucial input for these farmers, given the complementarities between labor and capital. Even if labor costs represent a smaller share of their total production costs, dairy and cattle farms still need dependable workers to operate.
Table 1. Labor Costs as a Percentage of Total Production Costs
Freq.
Percent
Cum.
Less than 5%
209
46.86
46.86
5% – 6%
29
6.50
53.36
7% – 10%
61
13.68
67.04
11% – 15%
65
14.57
81.61
16% – 20%
37
8.30
89.91
21% – 25%
26
5.83
95.74
26% +
19
4.26
100.00
Total
446
100.00
Table 2. Plans to Hire Foreign Workers in the Future
Freq.
Percent
Cum.
More
5
4.31
4.31
About the same
68
58.62
62.93
Less
11
9.48
72.41
Don’t know
32
27.59
100.00
Total
116
100.00
Table 3. Top Hypothetical Changes to the H-2A Program
Freq.
Percent
Cum.
Modify rules for determination of minimum hiring wages for H-2A workers
21
6.50
6.50
Allowing H-2A workers to stay year-round
24
7.43
13.93
Allowing H-2A workers to work for multiple employers
52
16.10
30.03
Providing govt support to build and maintain workers’ living facilities
106
32.82
62.85
Legalizing undocumented farm workers
19
5.88
68.73
Creating yearly quota of workers’ visas for non-seasonal sectors like dairy
101
31.27
100.00
Total
323
100.00
References
Gutierrez-Li, A. (2024). Feeding America: How Immigrants Sustain US Agriculture. Research Paper. Center for the U.S. and Mexico. Baker Institute for Public Policy. Rice University.
Escalante, C., Gutierrez-Li, A., and Bhuiyan, N. (2025). Relating crop and livestock H-2A labor decisions to AEWR and sector wage gaps. Southern Ag. Today. Forthcoming.
Farm Labor. (2025). Economic Research Service. U.S. Department of Agriculture. Accessed online in April 2025.
This year Tennessee celebrates 31 years of partnership with the AgrAbility Project, a national initiative that continues to change the lives of farmers and ranchers with disabilities. Since its establishment in the 1990 Farm Bill and initial federal funding in 1991, AgrAbility has expanded to 21 states—including Tennessee, which launched its program in 1994. In Tennessee alone, AgrAbility has supported more than 1,300 farmers whose physical conditions have limited their ability to farm—offering them new tools, resources, and, most importantly, hope. However, Tennessee is but one of several AgrAbility programs in the South. Other Southern AgrAbility programs include Georgia, South Carolina, Florida, and Texas. Together, these programs help Southern farmers continue to farm in the face of disability.
The core vision of AgrAbility is simple but powerful: to enhance the quality of life for those in agriculture who face disabling conditions. That vision is realized through access to assistive technology, gainful employment opportunities in agriculture, and evidence-based information to help individuals manage and overcome challenges. Tennessee’s program is a collaborative effort among the University of Tennessee Extension, Tennessee State University Extension, the STAR Center (a nonprofit disability organization in Jackson, TN), and the USDA National Institute of Food and Agriculture.
What makes AgrAbility unique is its inclusivity—its services are available to any farmer in the state, regardless of farm size or income. With the average age of farmers steadily increasing, there’s a growing demand for adaptive technologies to address issues such as mobility limitations, hearing and vision impairments, arthritis, and other age-related conditions.
Over time, assistive technologies have become more advanced, and so have the farmers AgrAbility serves. The program’s reach now includes veterans, women, and older farmers in the south —each bringing their own strengths and stories to the field. AgrAbility works with agricultural partners to connect farmers with essential resources and to foster open conversations about farm stress and mental health—topics once left in the shadows.
At its heart, AgrAbility is about resilience, independence, and the unwavering spirit of farmers. With a dedicated team, strong partners, and ongoing support from organizations like the Tennessee Department of Human Services/Vocational Rehabilitation Services, AgrAbility is not just a program—it’s a lifeline.
Here’s to 30 plus years of making farming possible for all.
The Tomato Suspension Agreement (TSA) between the U.S. and Mexico, first established in 1996, was designed to regulate the importation of Mexican tomatoes. This agreement emerged from an antidumping investigation aimed at determining whether imports of fresh tomatoes from Mexico were being sold at less than fair market value. Under the TSA, Mexican tomato producers agreed to sell fresh tomatoes in the U.S. market at set reference prices, and in return, the U.S. suspended the antidumping duty investigation. The first suspension agreement became effective in November 1996. Over the years, the U.S. Department of Commerce and Mexican signatories have entered into revised suspension agreements in 2002, 2008, and 2013, with the most recent becoming effective in September 2019 (Federal Register, 2019).
On April 14, 2025, the U.S. Department of Commerce announced its intent to withdraw from the 2019 Agreement, citing its failure to protect U.S. producers from “unfairly” priced Mexican tomatoes. Upon termination—effective in 90 days—antidumping duties of around 21% will be imposed on most Mexican tomatoes (Spiegelman, 2025). This decision could have a significant impact on imports, benefiting domestic producers. However, these duties (i.e., tariffs) could also reduce the economic activity associated with tomato supply chains and increase consumer prices.
The basic premise of an antidumping investigation is to determine whether imported goods are being sold in the U.S. market at less than fair value, often referred to as “dumping.” This practice can harm domestic producers by depressing local prices and causing financial distress. Concerns about imports of Mexican tomatoes have been driven by a significant surge in imports over the last two decades. Since 1995, imports from Mexico have grown by nearly 700% in value, from $406 million in 1995 to $3.1 billion in 2024. In terms of quantity, imports from Mexico have increased by around 220% (USDA-FAS, 2025).
What is even more concerning is that this growth occurred even as U.S. production declined, and per capita availability increased. In 1995, the year prior to the agreement, domestic tomatoes accounted for over 70% of the total U.S. supply. This situation has now completely reversed, with imported tomatoes accounting for 70% of the total U.S. supply in 2025 (USDA-ERS, 2025a). Almost all imports come from Mexico, which accounted for around 90% of U.S. tomato imports in 2024 (USDA-FAS, 2025). Despite the surge in imports, is there evidence to suggest that domestic prices have been depressed, impacting U.S. tomato growers?
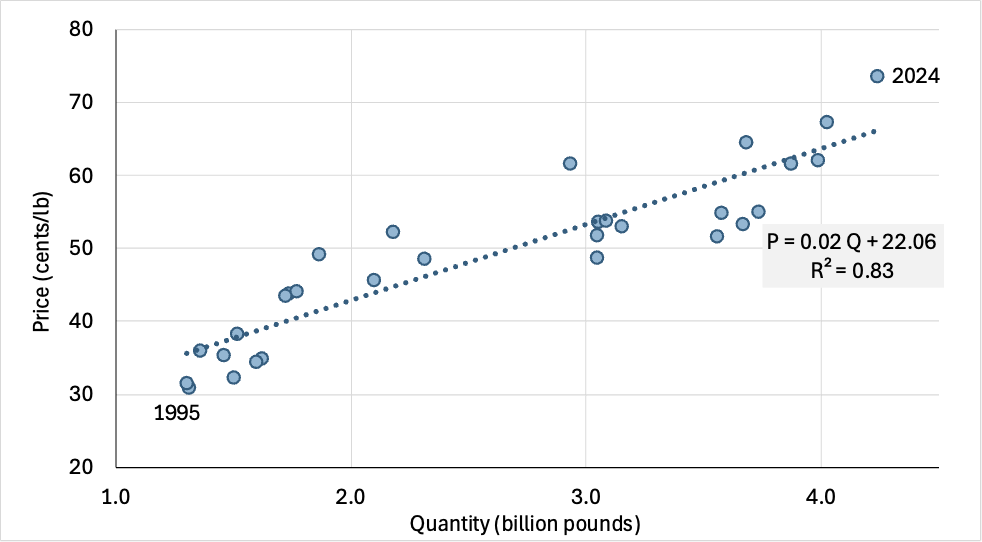
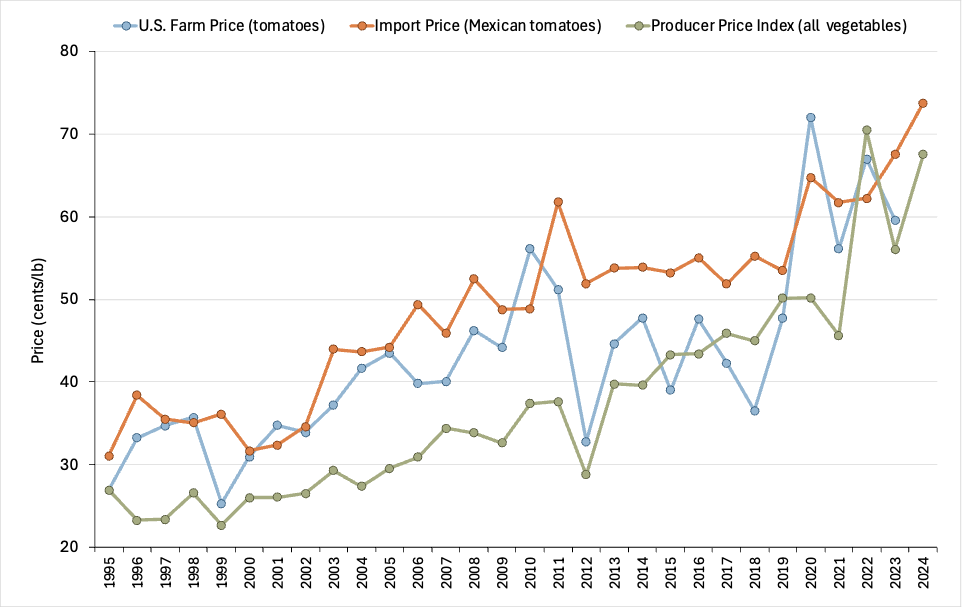
From 1995 to 2024, the U.S. saw a significant rise in the importation of Mexican tomatoes (Figure 1). The quantity of tomatoes imported from Mexico surged from approximately 1.3 billion pounds in 1995 to over 4.4 billion pounds in 2024. Alongside this rise in quantity, import prices also increased, starting at about 31 cents per pound in 1995 and reaching nearly 74 cents per pound in 2024. This upward trend in prices could be the result of the suspension agreements where Mexican signatories agreed to sell at increasingly higher prices. However, various factors, such as increased demand, changes in production costs, and market dynamics, likely contributed to this high correlation. Comparing Mexican tomato import prices to U.S. tomato farm prices and the U.S. Producer Price Index for all fresh vegetables shows little evidence of domestic price depression from imports (Figure 2). There is a positive correlation between import prices and U.S. farm prices, with a consistent upward trend. While it could be argued that prices would have grown at a faster rate without the surge in imports, overall vegetable prices suggest that this is not the case. In fact, import prices often exceeded both U.S. farm prices and overall vegetables prices.
In closing, while increased barriers on Mexican tomatoes might benefit U.S. tomato producers, there are other factors to consider. In 2024, the U.S. imported almost 2.0 million metric tons (over 4.0 billion pounds) of fresh tomatoes from Mexico, valued at more than $3.0 billion. According to a recent study by Texas A&M University, these imports generated an estimated $8.3 billion in total economic impact, including $3.6 billion in direct effects and $4.7 billion in indirect and induced effects, supporting approximately 47,000 U.S. jobs (Ribera et al., 2025). This suggest that there is more at stake if the U.S. eliminates the suspension agreement.
Figure 1. Import price and quantity of Mexican tomatoes: 1995–2024
Source: USDA-FAS (2025)
Figure 2. Comparison of import and domestic prices: 1995–2024
Source(s): The U.S. farm prices was obtained from USDA-ERS (2025b); import prices from USDA-FAS (2025); and the producer price index from BLS (2025), which was adjusted to for comparison purposes.
References
Bureau of Labor Statistics (BLS) (2025). Inflation and Prices, Prices – Producer, Commodity Data. https://www.bls.gov/data/
Farmers decide what crops to plant based on factors like crop rotations, expected profits, input costs, and other financial trade-offs. Annual predictions of planted acreage for a crop help agribusiness suppliers plan for seed, fertilizers, pesticides, and equipment needs. Prices of crops and how they compare to competing crops, like corn and cotton, influence planting decisions. In many southern states, corn competes with cotton for land, and the cotton-to-corn price ratio is a key factor in predicting how much land will be dedicated to cotton. Additionally, past planting decisions impact future choices due to crop rotation, which helps manage pests, diseases, and soil health while enhancing yield potential.
To estimate how much cotton farmers will plant in 2025, we built a model that looks at past cotton and corn prices, along with historical cotton acreage data. Data was obtained from the U.S. Department of Agriculture (USDA) National Agricultural Statistics Service (NASS) for 1990 to 2024. One of the most important factors in our model is the cotton-to-corn price ratio, which is calculated by dividing the cotton price (in cents per pound) by the corn price (in dollars per bushel).
By analyzing historical patterns, our model estimates how much cotton (total upland and Pima cotton acreage) will be planted next year based on three main factors: (1) last year’s cotton acreage; (2) the cotton-to-corn price ratio from the previous year; and (3) the expected cotton price for the upcoming year.
Simulated Cotton Planted Acreage in 2025
Using recent estimates from the USDA, we applied our model with a cotton-to-corn price ratio of 14.48 (based on a cotton price of 63.0 cents per pound and corn prices of $4.35 per bushel) as currently estimated by the April 2025 WASDE Report for the 2024 crops. A cotton price of 67.60 cents per pound for the 2025 crop is projected based on the February 2025 reported cotton price by USDA NASS.
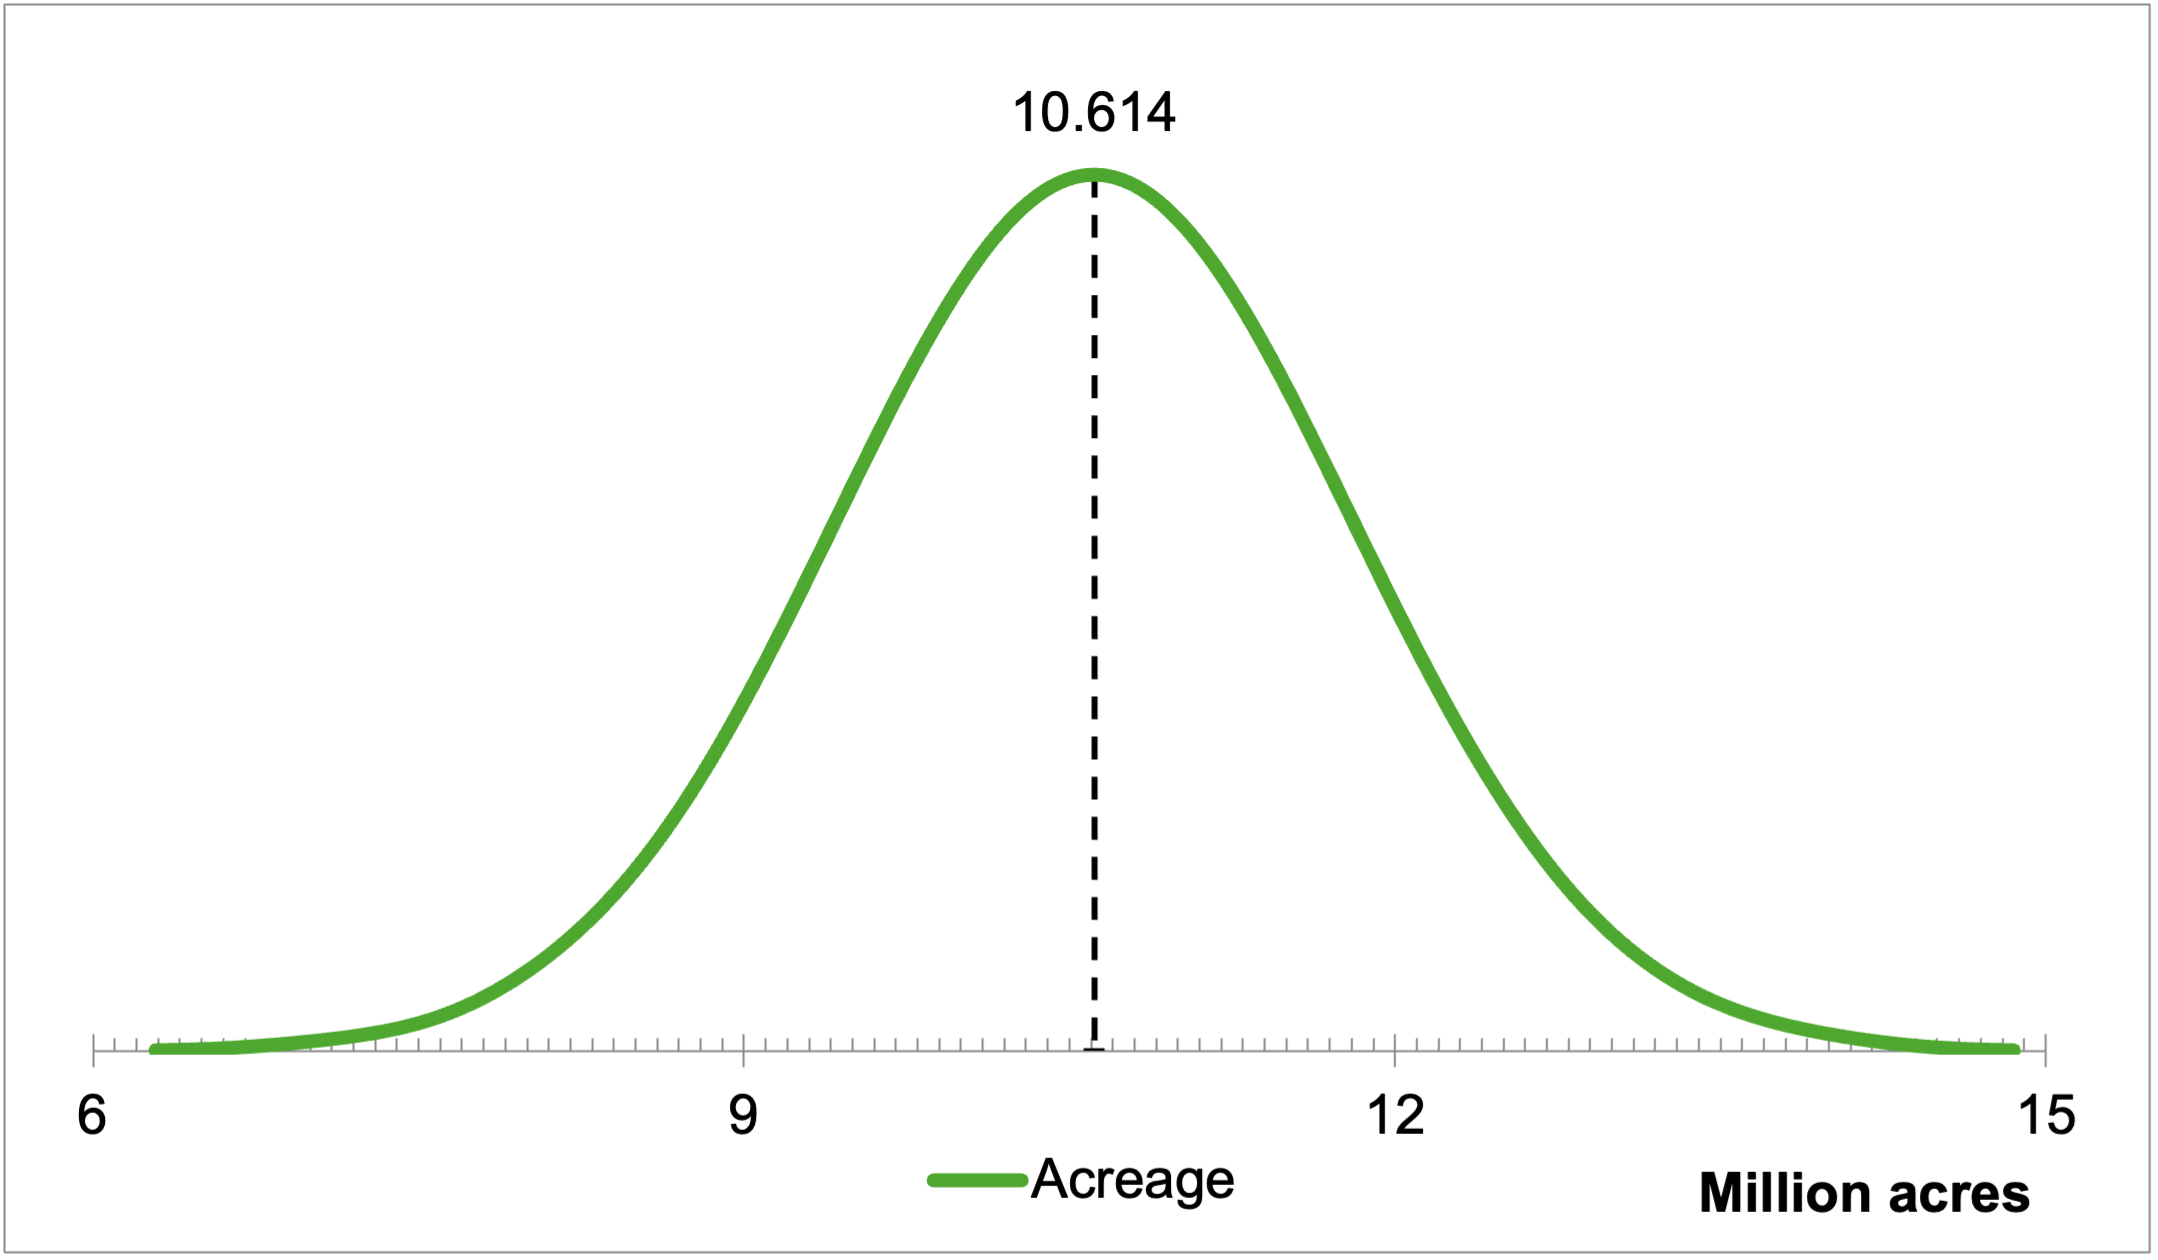
Our model predicts that farmers will plant approximately 10.524 million acres of cotton in 2025 (Figure 1), a 5.88% decrease from 2024 (when 11.182 million acres of upland and Pima cotton were planted in total). This is higher than the 9.87 million acres forecast by the USDA Prospective Plantings report published on March 31, 2025. These projections, while containing a degree of uncertainty, help farmers and agribusinesses prepare for the upcoming season by anticipating cotton plantings and allowing adjustments in strategies accordingly.
Figure 1: Projected Probability of Total Upland Cotton and Pima Cotton Planted Acreage for 2025. Higher Points Indicate More Likely Acreage Outcomes for 2025 Based on Simulation Results.
The Ordinary Least Squares (OLS) regression results (Table 1) show that the previous year’s cotton acreage, the previous year’s cotton-to-corn price ratio, and the current year’s cotton price significantly impact current-year planting.
Table 1: Impact of Historical Cotton Acreage and Cotton-to-Corn Price Ratio on Future Cotton Planting Decisions
Independent variable
Coefficient
t-ratio
0.404*
3.491
256.451*
5.812
31.223***
1.828
272.209
0.117
F-test
22.092
0.688
34
*, **, *** indicates significance at the 99%, 95% and 90%, respectively.