Blog

  • Breakeven Curves Under Different Midsouth Rental Agreements

    Breakeven Curves Under Different Midsouth Rental Agreements

    Farmers in the Midsouth region are faced with several choices when planting and marketing their crops. The type of rental agreement can have a variety of impacts on a Midsouth farmer, particularly in terms of returns to cash operating expenses (or variable costs). For example, a farmer operating under a crop share agreement may require higher yields to cover variable costs than one operating under a cash rent agreement. This article highlights the breakeven potential for rice, corn, and soybeans under three land ownership scenarios: cash rent, 75-25 crop share agreement, and fully owned land. Understanding breakeven curves allows farmers to evaluate the minimum yield (or price) needed to cover costs under each agreement, an essential step in managing economic risk and optimal crop choice. The analysis aims to help Midsouth farmers understand their cost structure and to support more informed marketing decisions within the context of alternative rental agreements. 

    The assumptions used to calculate breakeven values are given in Table 1 below. The listed Midsouth expenses represent estimated production expenses per acre for each crop; operating expenses do not include fixed overhead and other non-cash expenses such as depreciation. Breakeven combinations that exceed operating expenses do not include non-cash costs such as depreciation. Crop share agreements are assumed to follow a 75-25 split, with the landowner receiving 25% of the revenue and not contributing to production expenses. The cash rent value is an average derived from county-level estimates for irrigated farmland across the Midsouth region. We assume no associated land costs for the owned land scenario.  

    Table 1. Breakeven Curve Assumptions

    CropEstimated Cash Operating ExpensesCrop Share Cash Rent2025 USDA-RMA Harvest Price
    Corn$80675-25$152$4.65
    Soybean$51075-25$152$10.51
    Rice$99375-25$152$6.35

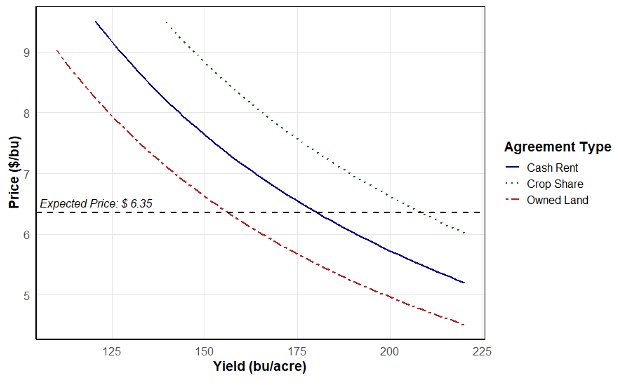
    Figures 1 – 3 show the breakeven curves for Midsouth corn, soybean, and rice production. These curves plot the price and yield combinations necessary to cover total cash operating expenses, as defined in Table 1. Any price and yield point below the curve indicates a crop revenue that does not cover cash operating expenses, while points above the curve indicate positive returns above cash operating expenses.  To provide context for current market expectations, the 2025 USDA-RMA expected harvest price for Arkansas is plotted on each graph. Across all three crops, the owned land scenario consistently requires the lowest price/yield combination to break even, while crop share requires the highest combination. For instance, Figure 1 shows the breakeven curves for Midsouth corn production. At the expected harvest price of $4.65, the target breakeven yield under full ownership, cash rent, and crop share is 173 bu/acre, 206 bu/acre, and 231 bu/acre, respectively.  In simple terms, land tenure arrangements with higher expense obligations require either higher yields, higher market prices, or a combination of both to cover variable costs (Mills, 2023). The implication is that cash rent and land ownership are progressively more profitable than crop share.  However, it is important to remember that there are things to consider beyond cash operating expenses.  Specifically, both cash rent and owned land require the producer to bear a higher level of production risk, and land ownership requires the cost of capital investment.  

    Figure 1. Midsouth Corn Breakeven Curves at an estimated $806/acre cash operating expense.

    Figure 2. Midsouth Soybean Breakeven Curves at an estimated $510/acre cash operating expense.
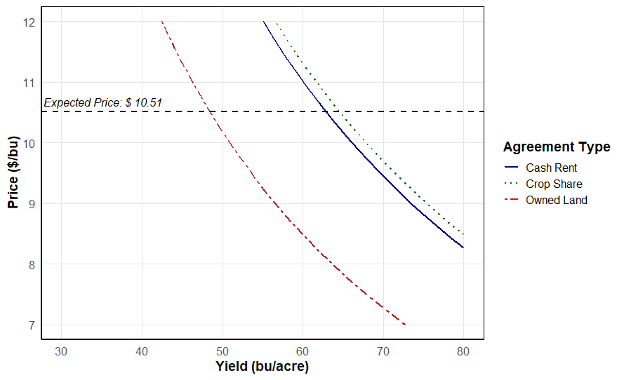
    Figure 3. Midsouth Rice Breakeven Curves at an estimated $993/acre cash operating expense.
    References

    Mills, Brian. “Forage Cost of Production and Breakeven Curves.” Southern Ag Today. July 19, 2023. https://southernagtoday.org/2023/07/19/forage-costs-of-production-and-breakeven-curves/

    United States Department of Agriculture. (2024). Cash Rents County Estimates. Retrieved April 3, 2025, from https://www.nass.usda.gov/Surveys/Guide_to_NASS_Surveys/Cash_Rents_by_County/

    United States Department of Agriculture – Risk Management Agency. (2025). Harvest Price Discovery. Retrieved April 7, 2025, from https://public-rma.fpac.usda.gov/apps/PriceDiscovery


    Loy, Ryan. “Breakeven Curves Under Different Midsouth Rental Agreements.” Southern Ag Today 5(17.1). April 21, 2025. Permalink
  • Rising State Minimum Wages in Specialty Crop-Producing States: Insights for Fresh Produce Growers

    Rising State Minimum Wages in Specialty Crop-Producing States: Insights for Fresh Produce Growers

    Raising state minimum wage rates to more than twice the federal minimum wage rates is expected now or in the near future in many specialty crop-producing states, posing significant financial challenges to U.S. fresh produce growers. With Florida’s basic minimum state wage rates set to reach $15 per hour by September 2026 and California already at $16.50 per hour (United States Department of Labor, 2022)—and farm wages potentially climbing to $19 per hour— labor costs, already a substantial portion of production expenses, are expected to increase considerably. This exacerbates competition with Mexican growers, who benefit from significantly lower wages—roughly one-tenth of U.S. rates—enabling them to price strawberries more competitively, particularly during the U.S. winter season.

    As of 2020, Florida’s minimum wage was $8.56 per hour and is expected to reach $15 per hour by 2026 (United States Department of Labor, 2022). In contrast, the increasing wage disparity between the U.S. and Mexico provides Mexican producers a consistent competitive edge, evident by Mexico’s substantial market share—approximately 60% of all U.S. fresh produce imports and 98% of strawberry imports. Higher U.S. labor costs are projected to reduce domestic strawberry supplies by as much as 37%, causing domestic prices to rise by 14% to 30%. Consequently, Mexican strawberry exports to the U.S. are expected to increase significantly, further intensifying competition.

    Recent research highlights the financial implications: if the minimum wage increases to $15 per hour, the U.S. strawberry industry could lose $93 million (-5.5%) in revenue (Table 1). Should wages climb to $19 per hour, losses may escalate to $304 million (-17.9%) (Table 2).

    To address these challenges, Southeastern U.S. growers are encouraged to proactively adopt strategies to remain competitive. Short-term measures may include advocating for equitable trade policies addressing wage disparities. Long-term solutions require investments in automation, mechanization, and artificial intelligence to reduce labor dependency. Embracing technological innovations, reassessing pricing strategies, diversifying into niche markets, and seeking governmental support or favorable trade policies will be critical to ensuring the long-term sustainability and profitability of Southeastern U.S. strawberry producers in an increasingly competitive global market.

    Table 1. Pre- and Post-Policy Minimum Wage Increase: $15/hour Wage Scenario (Lower Bound) 

    Pre-Policy valuesPost-Policy valuesDifference%Change 
    RUSP ($/lb.)0.971.100.1414.1%
    RMXP ($/lb.)1.411.560.1510.6%
    MXQ (M. lbs.)374.89454.1079.2021.1%
    USQ (M. lbs.)1,765.601,460.76-304.84-17.3%
    U.S. Revenue (M.$)1,699.391,606.25-93.14-5.5%
    MX revenue (M.$)532.02712.41180.3933.9%
    Notes: RUSP: Real U.S. price for strawberry in $/lb.; RMXP: Real Mexican import value of strawberry in $/lb.; USQ: U.S. strawberry (non-organic) shipments in Million lbs.; MXQ: Mexican strawberry shipments in Million lbs. Pre-policy values are calibrated by averaging pre-policy data (2017-2019). 
    In this scenario, farmers would pay their crews at the lower bound set by state law—a minimum of $15/hour.
     

    Table 2. Pre- and Post-Policy Minimum Wage Increase: $19/Hour Wage Scenario (Maintaining the Same Margin)

    Pre-Policy values Post-Policy valuesDifference%Change
    RUSP ($/lb.)0.971.260.2930.5%
    RMXP ($/lb.)1.411.740.3223.0%
    MXQ (M. lbs.)374.89546.30171.4045.7%
    USQ (M. lbs.)1,765.601,108.48-657.12-37.2%
    U.S. Revenue (M.$)1,699.391,395.08-304.31-17.9%
    MX revenue (M.$)532.02952.59420.5679.0%
    Notes: RUSP: Real U.S. price for strawberry in $/lb.; RMXP: Real Mexican import value of strawberry in $/lb.; USQ: U.S. strawberry (non-organic) shipments in Million lbs.; MXQ: Mexican strawberry shipments in Million lbs. Pre-policy values are calibrated by averaging pre-policy data (2017-2019). Retrieved from USDA-AMS (2021) and USD-FAS (2021)
    In this scenario, farmers would maintain the same margin difference relative to the increasing minimum wage, resulting in a wage of $19/hour when the minimum wage rises to $15/hour.

    References:

    United States Department of Labor [USDL]. 2022. Wage and Hour Division. Washington, DC: USDL. https://www.dol.gov/agencies/whd/minimum-wage/state. 

    United States Department of Agriculture, Foreign Agricultural Service [USDA‐FAS]. 2022. Global Agricultural Tradesystem. https://apps.fas.usda.gov/gats/default.aspx . 

    United States Department of Agriculture, Agricultural Marketing Service [USDA‐AMS]. 2022. Run a Custom Report, Specialty Crops. https://www.ams.usda.gov/market-news/custom-reports

    The full research paper can be accessed at: 

    Hammami, A. Malek, Tian Xia, Zhengfei Guan, and Xiurui Cui. “Rising Minimum Wages: Challenges to the US Produce Industry.” Agribusiness (2025). https://onlinelibrary.wiley.com/doi/full/10.1002/agr.22031


    Hammami, A. Malek, Tian Xia, Zhengfei Guan, and Xiurui Cui. “Rising State Minimum Wages in Specialty Crop-Producing States: Insights for Fresh Produce Growers.” Southern Ag Today 5(16.5). April 18, 2025. Permalink

  • High Tariffs Could Halt U.S. Beef Exports to China

    High Tariffs Could Halt U.S. Beef Exports to China

    After numerous rounds of reciprocal tariff hikes, the tariffs between the U.S. and China have escalated to 145% and 125%, respectively. This raises a critical question: Can U.S. agricultural exports to China withstand such steep retaliatory tariffs? To delve deeper into this issue, let’s examine the impact of prohibitively high tariffs on U.S. beef exports, a significant component of U.S. agricultural trade with China.

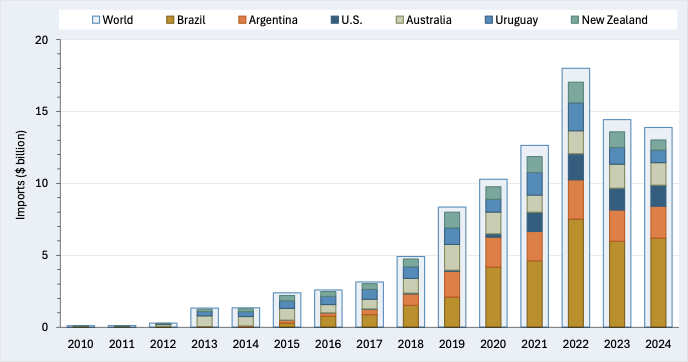
    As noted in a previous article, China has emerged as a major player in global beef trade. Although once a minor importer, China is now the largest beef importing country in the world. In 2010, Chinese beef imports were only $84 million, but by 2022, they increased by 21,000% to nearly $18 billion (See SAT: https://southernagtoday.org/2022/12/01/china-emerges-as-a-leading-destination-for-u-s-beef-exports/). This remarkable rise can be attributed to several factors, including economic growth, urbanization, and changing preferences for quality protein sources. The increase in imports was further accelerated by the outbreak of African Swine Fever in 2018, which decimated pork supplies and led to a significant shift towards beef. Due to rising demand and imports, coupled with lifting the import restriction on U.S. beef in 2017, China is now the third largest foreign market for U.S. beef behind South Korea and Japan (USDA, 2025).

    Since 2017, the U.S. has significantly increased its beef exports to China. In 2018, U.S. beef exports were valued at around $64 million, but by 2024, increased to approximately $1.5 billion (See Figure 1). As the figure shows, Brazil is the leading exporter of beef to China, reaching approximately $6.2 billion in 2024 (45% of total Chinese imports). Other noted suppliers include 

    Argentina, Australia, New Zealand, and Uruguay. 

    The figure underscores the competitive landscape of imported beef in China, with the U.S. emerging as a key player alongside Argentina, Australia, Brazil, New Zealand, and Uruguay. We can assess the impact of tariffs on these countries using price elasticity estimates from previous research (Hossen and Muhammad, 2025). The price elasticity refers to how the quantity imported responds to changes in import prices (own or competitor’s). Based on estimates from previous research, U.S. beef exports to China could decline by more than 77% in the short run, amounting to more than $1.0 billion in lost export sales. In the long run, U.S. beef exports to China will likely fall to zero if the high tariff persists. Interestingly, competing beef exports from Brazil and other countries could also decline (although by much smaller values) due to complementarities in importing. However, our estimates suggest that Uruguay could possibly benefit, but the benefit would be a fraction of U.S. losses. The U.S. has managed to capture a substantial share of the Chinese beef market (11% in 2024). Challenges posed by recent tariffs and trade barriers could cause the U.S. to lose it all.

    Figure 1. Chinese Beef Imports: 2010 – 2024

    Source: Trade Data Monitor® (2025)

    For more information:

    Hossen, M.D. and Muhammad, A. (2025). “Assessing the Impacts of Maritime Freight Rates on Global Beef Trade” Agribusiness. https://doi.org/10.1002/agr.22030

    USDA (2025). Global Agricultural Trade System. Foreign Agricultural Service. https://apps.fas.usda.gov/gats/default.aspx


    Muhammad, Andrew, and Md Deluiar Hossen. “High Tariffs Could Halt U.S. Beef Exports to China.” Southern Ag Today 5(16.4). April 17, 2025. Permalink

  • April WASDE Updates Old Crop Estimates Before Shifting Focus to New Crop Forecast in May

    April WASDE Updates Old Crop Estimates Before Shifting Focus to New Crop Forecast in May

    The April World Agricultural Supply and Demand Estimates (WASDE) report released Thursday, April 10, made a few updates to the 2024/25 balance sheets for major row crops that were generally minor adjustments to old crop estimates for the United States (U.S.).  The Crop Production report was also released on April 10thwith no new data reported for row crops.  Thus, the adjustments in the WASDE report were made on the use side of the balance sheet.  The U.S. corn balance sheet was viewed as the most bullish with a sizable increase in the export forecast of 100 million bushels due to strong sales. The increase was partially offset by a 25-million-bushel reduction in feed and residual use due to slower disappearance, as indicated in the March 31 Grain Stocks report.  The net effect was ending stocks adjusted down 75 million bushels from March to 1.5 billion bushels, while and the season-average corn price was left unchanged at $4.35 per bushel.   The futures market responded on April 10 with a 9-cent increase in nearby futures to $4.82 per bushel. 

    Soybeans saw U.S. ending stocks tighten up a little bit with an increase in crush of 10 million bushels due to higher meal domestic use and oil exports. Imports of soybean oil were adjusted up 5 million bushels resulting in a net increase in ending stocks of 5 million bushels. The season average price for soybeans remained unchanged at $9.95 per bushel.  Nearby soybean futures increased $0.16 per bushel closing at  $10.29 per bushel on April 10, continuing a rally after the initial shock of the April 4 tariff announcement. 

    The global rice market is experiencing increased production due to India’s consecutive record crops, surpassing China as the largest world rice producer.  U.S. exports were adjusted down due mainly to medium grain export reduction, while the average season price stayed the same at $15.60 per cwt.   

    Cotton and wheat saw the most bearish adjustments to their balance sheets.  Lower sales of hard red wheat led to a decrease in U.S. wheat exports by 15 million bushels, while imports increased by 10 million bushels.  Wheat ending stocks were lowered by 27 million bushels, but the average price stayed the same at $5.50 per bushel. Nearby futures dropped 5 cents to $5.38 per bushel on April 10.  The only change made to U.S. cotton was the export forecast being lowered by 100,000 bales.  However, if realized, the reduced exports would result in the largest ending stocks since 2008 other than the 2019 crop when a large crop and a drop in domestic mill use led to 7.45 million bales in ending stocks.  The season average price for cotton remained at $0.63 per pound. Nearby cotton futures rallied back to $0.66 per pound before the WASDE report and did not move much immediately after the WASDE report was released.  

    The market appears to be reacting to the uncertainty of tariffs and potential planted acres.  The USDA will shift its focus from old crop to new crop in the May WASDE report with new 2025/26 supply and use forecasts.

    Table 1:  USDA Changes to U.S. Balance Sheets in April WASDE Report, April 10, 2025. 

     CornMil. Bu.CottonMil. BalesRiceMil. CwtSoybeansMil. Bu.WheatMil. Bu.
    Beginning Stocks—————
    Imports——-1+5+10
    Domestic Use-25—+3+10-2
    Exports+100-0.1-1.5—-15
    Ending Stocks-75+0.10-2.5-5+27
    Avg. Price—————
    Data Source: USDA April 2025 WASDE
    Note: — indicates no change from the prior month.

    Smith, Nathan. “April WASDE Updates Old Crop Estimates Before Shifting Focus to New Crop Forecast in May.” Southern Ag Today 5(16.3). April 16, 2025. Permalink

  • 2025 National Feeder and Stocker Receipts and Heifer Percentage

    2025 National Feeder and Stocker Receipts and Heifer Percentage

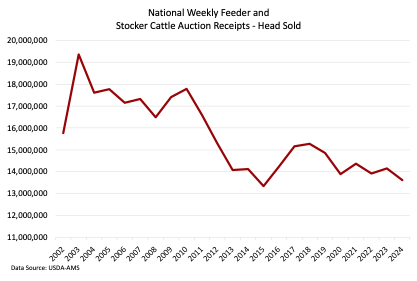
    Tighter cow numbers over the past few years have led to smaller calf crops and fewer cattle to sell. According to data from the USDA-AMS National Feeder and Stocker Cattle Summary, the number of feeder and stocker cattle sold during the first 14 weeks of 2025 totaled 3.72 million head which was 9.5 percent below the number sold during the same period in 2024. Receipts so far in 2025 are down 9 percent year to date when compared to the 4-year average from 2020-2023. 


    2018 was the peak in sales for the current cattle cycle as shown in the chart above. The 2024 total was 11 percent below 2018 and 4 percent below 2023. It is still early in 2025, but the current trend, and general lower cattle supply, suggest that 2025 sales will be lower again. This dataset includes auction, direct, and video/internet sales reported to USDA. It is not a comprehensive dataset as it does not capture all feeder and stocker cattle transactions, and the report notes that “receipts vary depending on the number of auctions reported.” However, given the similar methodology over time, comparisons are useful in comparing market dynamics to previous years.  

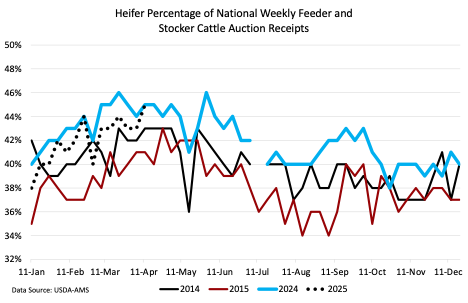
    The report also gives information about the mix of steers and heifers. It is interesting to compare 2024-2025 to 2014-2015 in the context of heard expansion. As shown in the chart below, the percentage of heifers has been higher in 2024 and 2025 than it was in 2014 and 2015. When herd expansion begins, we’d expect the share of heifers in the feeder cattle mix to decline as producers begin to retain more heifers. This is another indicator that producers have not yet started retaining heifers in the same way that they were in 2014-2015 when that herd expansion period began. 


    Maples, Josh. “2025 National Feeder and Stocker Receipts and Heifer Percentage.” Southern Ag Today 5(16.2). April 15, 2025. Permalink