Blog

  • Before Starting a Farm Transfer: A Farm Family Pre-Agreement

    Before Starting a Farm Transfer: A Farm Family Pre-Agreement

    Often, when speaking to groups of young farmers looking to return to the family farm, the first question I am asked is, “What is the best way to start a farm transfer?”  In most circumstances, I typically recommend a trial period for both generations. Instead of jumping into a farm business partnership, the junior generation (future owners) and the senior generation (current owners) must agree on how they will work together and how rapidly the farm transfer process will progress. This is something I refer to as a “pre-agreement.”

    A pre-agreement should contain at least three parts: how to work together, how to develop the junior generation’s skills, and how long a trial period is necessary. Keep this agreement simple; it is not a legal agreement but a precursor to one. Treat this like an internship opportunity, where both sides must work together to improve the skills and employability of the junior generation and benefit the business for both generations.

    How to Work Together

    Get both generations’ expectations out on the table. It is better to air one’s concerns ahead of time than have difficult situations result. These “working together” guidelines should include basic things such as pay, time off, and when people are expected to show up and leave work. It is also wise to discuss how much autonomy or decision-making authority each person will have: will decisions be shared, or will the owner be the sole decision-maker?  Also, both parties need to be realistic about working together, even discussing how to part ways amicably if things don’t work out during this pre-agreement process. 

    How to Develop the Next Generation

    The next generation rarely has all the necessary skills and management ability to run the farm immediately. It is also just as rare that the senior generation will have all the necessary skills to be excellent trainers and teachers. The solution is to craft a development program that assesses the skills the junior generation needs and places the training responsibility on the senior generation. If training the next generation is too tricky, don’t be afraid to look to outside sources for farm manager training, such as college degrees, cooperative extension programs, trade schools and associates degrees, and Farm Bureau young farmer and rancher meetings.

    How Long of a Trial Period

    The junior and senior generations must agree on how long this pre-agreement trial period will last. At the end of the trial period, plan to make a decision: continue farming together; modify the working relationship and progress the farm transfer process; or part ways in a friendly manner. Both parties must always be open to voicing and hearing concerns.  For longer agreement periods, it’s a good idea to schedule routine checkpoints (at least annual, if not more frequent) to discuss how each generation is living up to their side of the bargain.

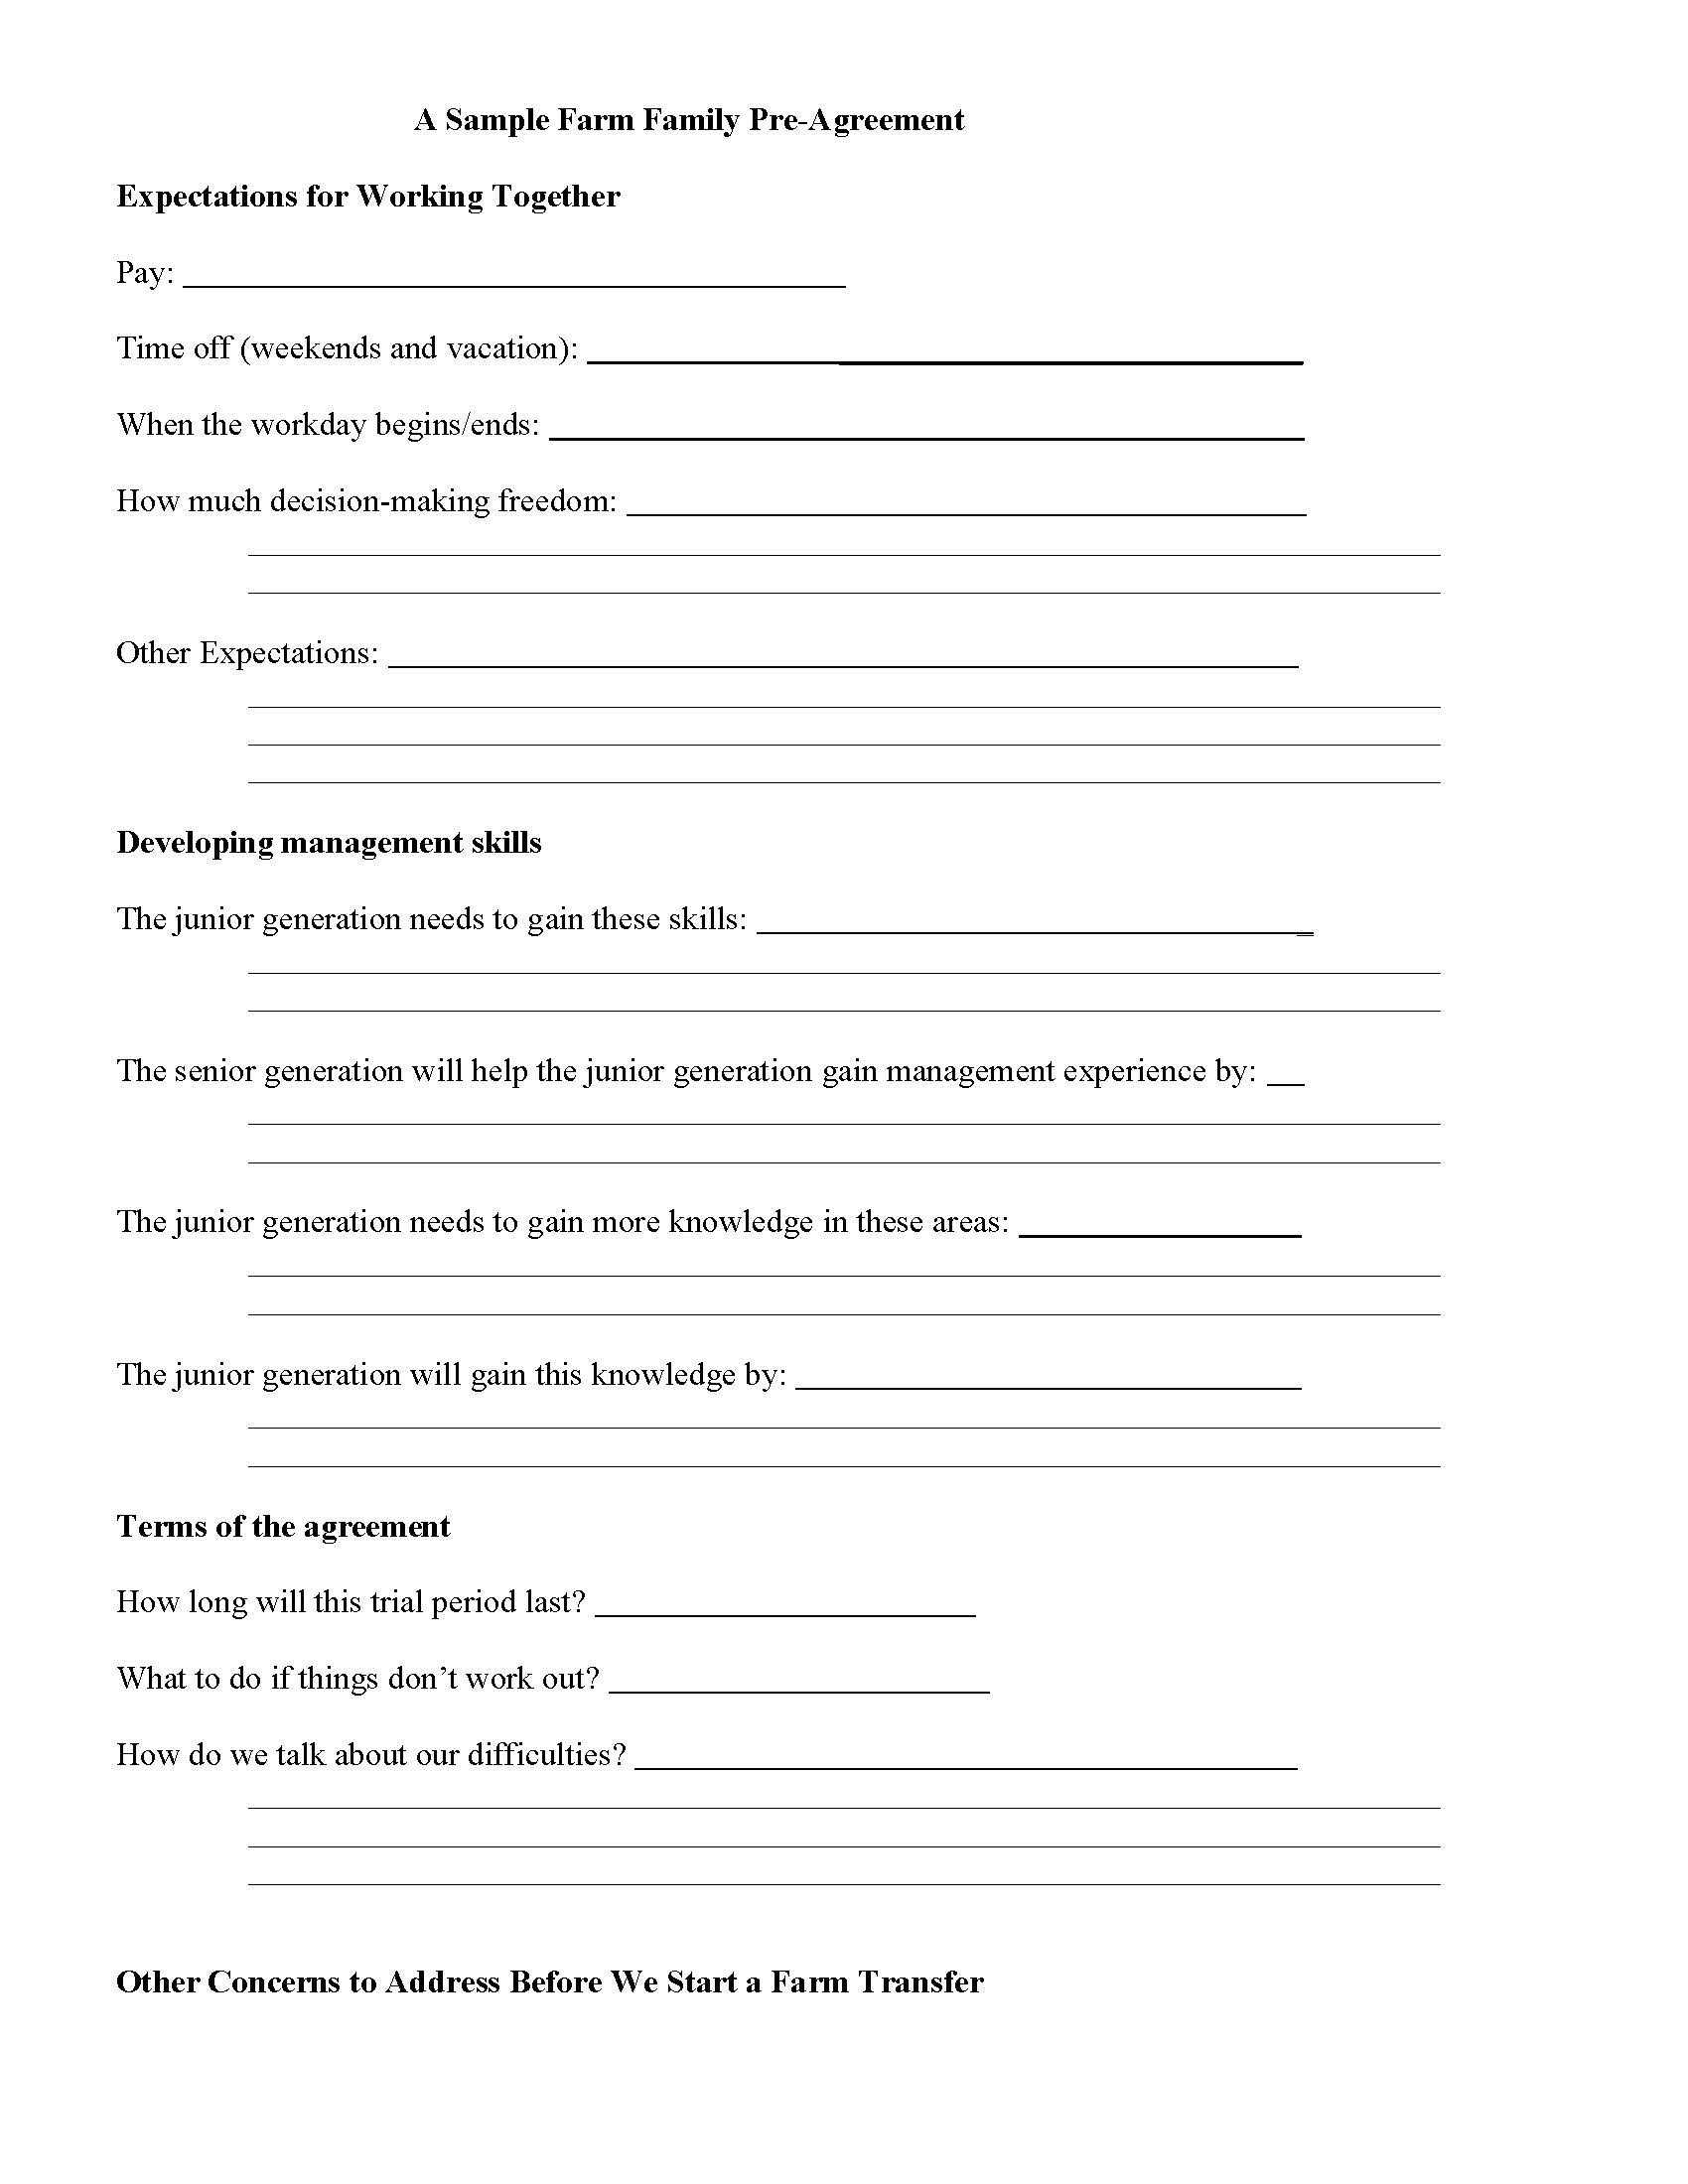
    A Sample Pre-Agreement

    A sample is provided here as an example of the types of things a pre-agreement could address.  Feel free to modify this sample to fit your farm’s circumstances.  If additional materials are needed, please talk to your local extension agent.  You may also find general business transfer guides at https://coopcenterSC.org


    Richards, Steven. “Before Starting a Farm Transfer: A Farm Family Pre-Agreement.Southern Ag Today 5(15.1). April 7, 2025. Permalink
  • Four Ways for Farmers to Avoid Estate Taxes in 2025

    Four Ways for Farmers to Avoid Estate Taxes in 2025

    Succession can be a very sensitive topic for farmers to discuss.  Some farmers want their children to take over the farm and operate it in the same manner.  Other farmers, either due to a lack of interested children or due to skyrocketing land prices, would rather sell the whole farm for a non-agricultural use such as neighborhood development.  Regardless of anyone’s farm succession plan, everyone has at least one similar goal: minimize (or, ideally, eliminate) their estate tax burden.  

    Tool #1: Estate Tax Exemption

                Generally speaking, an individual’s taxable estate includes all assets owned by that individual at the time of death, including assets owned through an LLC that the individual owns or through a revocable trust in which the individual is a beneficiary.  So, if a farmer establishes a revocable trust that owned the LLC that owns the farm (a common probate avoidance-liability protection strategy), the farmer’s estate would still be deemed to own the farm, including its land (measured at fair market value), equipment, livestock, buildings, and so forth.

                Unlike the other tools which will necessitate an attorney, the estate tax exemption is something that every taxpayer automatically utilizes at death.  The estate tax exemption in 2025 is $13.99 million for individuals and $27.98 million for married couples.  In other words, if an individual were to pass away in 2025 with less than $13.99 million in their estate, that individual’s estate would not be responsible for paying estate taxes.  While Congress may change the law for 2026 and beyond, the estate tax exemption for 2026 is set to revert to pre-2017 Tax Cuts and Jobs Act levels, putting the individual exemption at approximately $7 million and the married exemption at approximately $14 million.  

    Even at these lower amounts, most farmers have nothing to worry about.  Still, some farmers place estate taxes as their primary concern when conducting succession planning, so hopefully this first tool alleviates those worries.  

    Tool #2: Family LLCs

                The estate tax exemption is reduced by any reportable gifts made during the decedent’s lifetime.  In 2025, a donor must report to the IRS any gifts to individuals that are worth more than $19,000 and gifts to married couples that are worth more than $38,000.  As such, a farmer can gift shares of their farm LLC to their children that are under the gift tax reporting thresholds over a period of time, ideally decades, to reduce their taxable estate once the farmer does pass away.

                A few aspects of family LLCs are noteworthy.  First, the farmer should be gifting shares of the farm LLC that lack voting rights, which the IRS will view as less valuable than normal LLC shares, thereby allowing the farmer to gift a higher percentage of the LLC each year without exceeding annual gift tax limits.  Second, farmers with children who are married can conduct this strategy more efficiently than farmers with children who are not married.  Moreover, the children who receive shares are not necessarily obligated to retain the shares – the children can sell the shares, including amongst themselves.  

    Tool #3: Internal Revenue Code 2032A 

                At its core, IRC 2032A allows for an additional estate tax exemption of up to $1.42 million in 2025 (i.e., thus increasing an individual’s estate tax exemption to $15.41 million and a married couple’s estate tax exemption to $29.4 million).  Concisely, there are both pre-death and post-death requirements that must be met for the IRC 2032A increase to be utilized.  The State of Washington Department of Revenue has a very readable frequently asked questions page on IRC 2032A which more comprehensively details the requirements.  

                With respect to just the high points, the decedent must have been farming the land for five of the last eight years of his or her life.  Specifically, the decedent must have been providing ‘material participation’ on the farm, not just leasing land to third parties.  The land and equipment used on the farm must also constitute significant percentages of the farmer’s estate.  After death, the decedent’s ‘qualified heir’ (usually a child) must continue farming the land for the next ten years.  Like the decedent, the qualified heir must materially participate on the farm – not just lease it out to a third party.  If the qualified heir ceases farming operations at any point during those ten years, the qualified heir will be personally liable for the estate tax burden and must pay it within six months of the deviation.  

    Tool #4: Irrevocable Life Insurance Trusts (ILIT)

                For high-net-worth farmers who will not avoid the estate tax through the above tools, an irrevocable life insurance trust (ILIT) is an option.  While both assets in a revocable trust and some life insurance policies are included in a decedent’s estate, assets placed in an irrevocable trust more than three years before death are not included in the estate.  For an ILIT, a farmer would set up an irrevocable trust, purchase a life insurance policy, and place that policy within the trust.  When the farmer dies, the ILIT would receive life insurance proceeds that were excluded from the estate and distribute them to the surviving spouse or children in order to pay the estate taxes and otherwise provide liquidity to the farm.

                ILITs can be very expensive, however.  It will cost several thousand dollars for the initial document drafting to be done, and then anywhere from a few hundred dollars to tens of thousands of dollars for the annual life insurance premiums.  In short, farmers who will never approach the estate tax exemption levels should not invest in ILITs.


    Brown, Nicholas. “Four Ways for Farmers to Avoid Estate Taxes in 2025. Southern Ag Today 5(14.5). April 4, 2025. Permalink

  • Understanding Trade Barriers: Tariff and Non-Tariff Measures

    Understanding Trade Barriers: Tariff and Non-Tariff Measures

    Over the past few decades, international trade has undergone significant transformations as countries strive to lower barriers and create a more interconnected global economy. While reductions in tariff rates have been a welcome advancement, the complex landscape of non-tariff measures (NTMs) has added new layers of challenges to achieving freer trade. Understanding how these policies impact trade dynamics is essential for navigating the ever-changing world of global commerce.

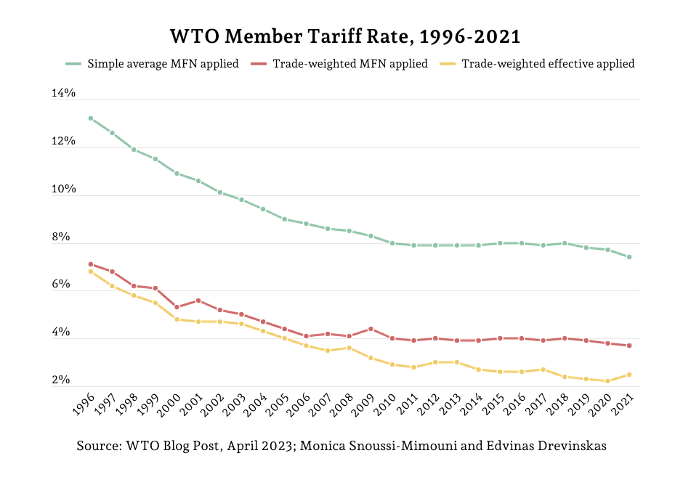
    Since 1996, the average most favored nation (MFN) tariff rate for World Trade Organization (WTO) member countries has fallen by nearly half, from 13.2 percent to 7.4 percent in 2021. MFN rates are given to all WTO members unless an agreement allows for a lower rate to be given, this would be the trade-weighted effective rate or preferential rate. When comparing simple average rate to the trade-weighted MFN rate there was a 3.7 percent spread in tariff rate during 2021. The trade-weighted effective rate brings the world average down even further, to 2.5 percent in 2021. While the overall reduction of tariff rates is good news for reducing trade barriers, non-tariff measures (NTMs) play a major role as well.

    Applied tariffs are the actual rates charged on products whereas bound tariff rates are the maximum upper bound that can be applied on a product without having to compensate the affected party. All rates discussed throughout this article are applied and include both ad valorem as well as ad valorem equivalents for non-ad valorem tariff rates. 

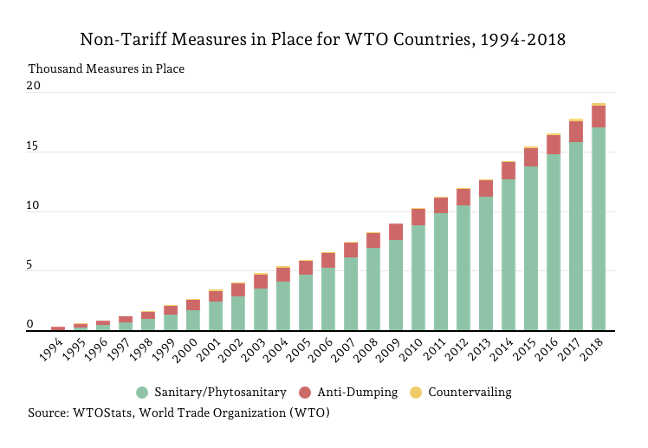
    NTMs are policy measures other than tariffs that can affect international trade such as regulations, standards, and procedures, impacting quantity traded, prices, or both. In 1994, a total of 293 NTMs were in place between all WTO countries. These included 264 anti-dumping policy lines and 29 countervailing lines. These have grown drastically over time with the largest increase being the growing number of Sanitary and Phytosanitary (SPS) policies. While SPS measures are tracked through 2021, limited data exist on NTM.  In 2021 a total of 20,726 SPS measures were in place for WTO markets, a 134 percent increase from 2010.  In addition, in 2018 there were 1,858 dumping reported. This rapid increasing trend of NTMs should be a concern for those of us that support freer trade.

    In recent decades, the reduction of tariffs has significantly opened up opportunities for U.S. trade. However, the increasing prevalence of NTMs highlights the need for continuous monitoring and policy adjustments to foster a truly free trade environment.

    Source

    Snoussi-Mimouni, Monica and Edvinas Drevinskas. “Tariffs applied by WTO members have almost halved since 1996”, World Trade Organization. April 2023.

    World Trade Organization. WTO Stats. https://stats.wto.org/. Online public database. Accessed March 2025.


    Ribera, Luis, and Landyn Young. “Understanding Trade Barriers: Tariff and Non-Tariff Measures. Southern Ag Today 5(14.4). April 3, 2025. Permalink

  • Key Takeaways of the 2025 Prospective Plantings Report and Revisiting Reliability

    Key Takeaways of the 2025 Prospective Plantings Report and Revisiting Reliability

    On Monday, March 31st, USDA released the Prospective Plantings report. These acreage estimates are based primarily on surveys conducted by the National Agricultural Statistics Service (NASS) from February 18 to March 18. Principal crop acres planted were projected nationally at nearly 310 million acres, down roughly 1.3 million acres compared to last year. Corn acres are estimated at 95.3 million, up 4.7 million from last year and the third highest in modern history. Soybean planted acres are estimated at 83.5 million, down almost 3.6 million from last year.  Cotton acres are projected to be down 12% from last year, at 9.867 million acres, the lowest since 2015. Peanut acreage is projected at 1.95 million acres, up 8% from last year, and rice acres are projected at 2.895 million, down 1% from last year. All wheat acreage is projected at 45.35 million, down 2% from last year. The forecasts in the Prospective Plantings report confirm recent projections released at the February USDA Outlook Forum which had 2025 corn acres increasing by 3.4 million, a 3.1-million-acre reduction in soybeans, and 1.18 million fewer acres of cotton. 

    In fact, the USDA indicated in the Prospective Plantings report an even larger increase in corn acres compared to last year. Throughout the first quarter of 2025, new crop corn-soybean futures price ratios heavily favored corn over soybeans ranging from 2.20 to 2.31, driven by tightening U.S. and World corn stocks.  In fact, the price ratio averaged 2.24 during the window of the 2025 March Prospective Plantings survey compared to 2.49 in the same time frame last year. Cotton was expected to cede acres this year due to struggling demand, intense export competition with Brazil, and lower prices compared to other commodities. All states except Arizona and Kansas are projected to reduce cotton acreage from last year. Rice acres are also expected to decline on lower prices, static input costs and fierce export competition from Asian origins.  Seed availability for long-grain rice is an additional factor reducing acres. Futures price reaction from the March 31 report was subdued, with the findings in the Prospective Plantings report mostly in agreement with pre-report industry estimates.  New crop (i.e., Fall 2025) corn settled one-half cent lower, soybeans 9 ¾ cents lower, cotton 17 points ($0.0017) lower, and rice 1 ½ cents per cwt. lower.

    We now provide a 2025 update to a 2023 Southern Ag Today article addressing the reliability of the Prospective Plantings report (Biram and Maples, 2023). The NASS planted acreage projections across the U.S. continue to hold well with low predictive error and hold especially well for corn and soybeans over the 2016-2024 time span (Figure 1). There still remains a relatively small predictive error for rice and cotton over the same time span. The larger variance can be due to (1) the smaller sample size of farms and (2) the alternative crops available to plant in place of corn and soybeans. Most of the U.S. corn and soybean acreage is grown in the upper Midwest but tends to take up acreage across the entire U.S. which allows for a larger sample of farmers and less variance. In the south, farmers rotate corn and soybean crops with cotton, peanuts, and even some vegetables.  This makes it more difficult to project acres that may shift based on rotational needs, commodity prices, input costs, and weather.  

    We re-investigate the difficulty in projecting acreage by choosing the subsample of southern states to see if 1) there is more variance across the changes in corn and soybean acreages given a smaller sample and 2) the pattern of acreage changes across cotton and rice still holds in the subsample. We find this to continue to hold (Figure 2). We see more differences each year between prospective and actual planted acreages in corn and soybeans across southern states, and the general pattern of differences each year for cotton and rice still holds between the full U.S. sample and the southern subsample. This implies that we should generally not expect any significant changes in harvest price expectations driven by differences in planted acreages but rather look to future market-moving events. The continuation of drought conditions in West Texas has implications for the cotton market, while prolonged drought in the western Corn Belt has implications for corn and soybean production, as evidenced in 2023 (Gardner and Biram, 2023). Looking globally, we turn to weather-related impacts to the second Brazilian corn crop, as well as a future path on trade talks with our top trading partners (i.e., Mexico, Canada, and China). 

    Figure 1. Comparison of Prospective vs. Actual Planted Acreage across the U.S. (2016-2025)

    Figure 2. Comparison of Prospective vs. Actual Planted Acreage across Southern[1] States (2016-2025)


    [1] States included are Alabama, Arkansas, Florida, Georgia, Kentucky, Louisiana, Mississippi, North Carolina, Oklahoma, South Carolina, Tennessee, Texas, Virginia.

    References:

    Biram, Hunter, and William E. Maples. “Key Takeaways and Reliability of the 2023 Prospective Plantings Report.” Southern Ag Today 3(14.1). April 1, 2023. Permalink

    Gardner, Grant, and Hunter D. Biram. “USDA Acreage Report Results: Price and Crop Insurance Impacts.” Southern Ag Today. July 3, 2023. Permalink

    NASS/USDA. Prospective Plantings. National Agricultural Statistics Service, U.S. Department of Agriculture, March 2025. Retrieved from: https://release.nass.usda.gov/reports/pspl0325.pdf


    Stiles, H. Scott, and Hunter Biram. “Key Takeaways of the 2025 Prospective Plantings Report and Revisiting Reliability.Southern Ag Today 5(14.3). April 2, 2025. Permalink

  • Record Cow Prices!  It’s Not April Fools! 

    Record Cow Prices!  It’s Not April Fools! 

    Spring is here and not only are calf and fed cattle prices record high, but cull cow prices have joined the action.  Cow prices typically increase from late in the previous year until about May-June.  Both supply and demand factors contribute to higher cull cow prices in the Spring.  On the supply side, total cow slaughter tends to decline until the middle of the year.  On the demand side grilling season is starting and that means more demand for ground beef.  

    Cull cow prices in the Southern Plains have increased from $121 to $145 per cwt since the first of the year.  Auction prices a year ago in those markets averaged $134 per cwt.  On the meat side, the cow-beef cutout climbed to $297 per cwt.  At the same time, wholesale 90 percent lean boneless beef hit $382 per cwt.  Pretty clearly tight supplies and Spring grilling season demands are sending prices higher.  

    On the supply side, cow slaughter, typically, slowly declines until mid-year.  That is about where we are through March, maybe a small downward trend in weekly average slaughter.  While the pattern of slaughter is pretty normal, the numbers going to slaughter are sharply lower.  Through mid-March, beef and dairy cow slaughter are down 20 percent and 6.6 percent, respectively.  The decline amounts to 16,000 fewer total cows going to packers per week than last year. 

    It’s worth noting that beef cow and dairy cow slaughter exhibit different seasonality throughout the year.  Beef cow slaughter tends to decline in Spring, have a mid-year increase, then a peak late in the year.  Dairy cow culling peaks early then declines to seasonal lows in mid-year.  Production systems across the country largely explain these seasonal peaks and valleys.

    While cow slaughter is lower than last year reducing lean beef supplies, imports are adding lean beef trimming supplies.  Beef imports in January totaled a monthly record of 608 million pounds.  Imports from Brazil were almost a third of total beef imports for the month at 198 million pounds.  Brazilian beef imports normally decline after January so total beef imports should decline over the next few months.  

    There is more room for cow prices to increase further over the next couple of months.  Grilling season is just getting started for a lot of the country.  Fewer cows going to market will keep prices above a year ago the rest of the year.  Higher fed cattle prices should help support cull cow prices.  


    Anderson, David. “Record Cow Prices! It’s Not April Fools!Southern Ag Today 5(14.2). April 1, 2025. Permalink