Blog

  • River Levels and Off-Farm Storage Disbursement

    River Levels and Off-Farm Storage Disbursement

    This article examines how low river levels impacted off-farm storage utilization last year for the five Southern states bordering the Mississippi River (Kentucky, Missouri, Tennessee, Arkansas, and Louisiana). In particular, we look at changes in corn held in off-farm storage. USDA-NASS (2023) reports off-farm stock numbers quarterly, including bushels stored on and off-farm. Net off-farm storage disbursement can be calculated by subtracting off-farm stocks in the previous quarter. For 2022/23, corn disbursements trailed the 5-year average in the five southern states bordering the Mississippi River. Lower net disbursement was likely caused by low river levels, which increased barge freight and caused the corn basis to widen (Gardner, Biram, and Mitchell, 2023). Once river levels returned to normal, elevators tended to barge soybeans as they have a higher value on a per-bushel basis, further delaying corn shipments (USDA-NASS, 2023). Figure 1 shows aggregate corn disbursement rates for all five states compared to the 5-year average. Figure 2 further breaks down the data by state. Typically, most corn is put in off-farm storage in Quarter 1 (Q1) of the marketing year, which consists of September, October, and November. Corn is then disbursed as the marketing year progresses. 

    Figure 1 indicates that in Q2 of last year, negative disbursement occurred. Negative disbursement percentages indicate that corn was added to off-farm storage. Additional corn storage in Q2 was likely driven by river level declines, which slowed corn shipments through the Mississippi River. The bulk of corn added to off-farm storage in Q2 occurred in Louisiana and Mississippi (Figure 2). As elevators in Mississippi could not move corn downriver, they filled their storage space and stopped taking delivery, causing producers to delay harvest and “store” corn in the field. Louisiana could still utilize the river for transport. Thus, the increase in off-farm supplies in Q2 was likely driven by producers in surrounding states delivering to Louisiana from more northern states. In Q3, the basis neared normal. On a percentage basis, the states disbursed 40% (-1% less 39%; figure 1) of the corn stored in Q1, the same as the 5-year average (10% less 50%). In Q4, producers disbursed 5% (39% compared to 34% on average) more off-farm corn than average, likely allowing some producers to capture the high June prices induced by drought fears on new crop supply. Q4 disbursement rates trailed 6% below the average, indicating that close to 23.5 million bushels were carried into the new marketing year. 

    Looking ahead to the 2023/24 marketing year, river levels have again caused the basis to decline, and off-farm storage will be an important risk management tool in these five states. As river levels improve, the basis should rise to normal levels. However, slow disbursement in the first quarter of the 2023/24 marketing year may hinder basis improvement. 

    Figure 1. Aggregate Net Off-Farm Storage Disbursement for Mississippi River Bordering Southern States by Marketing Year Quarter (2022/23 vs. 5-Year average)

    Notes: States include Arkansas, Kentucky, Louisiana, Mississippi, and Tennessee. Q1 includes the months of September, October, and November. Q2 includes December, January, and February. Q3 includes March, April, and May. Q4 includes June, July, and August. Disbursement Percentages calculated in comparison to Q1.

    Figure 2: Net Off-Farm Storage Disbursement for Mississippi Bordering Southern States by Marketing Year Quarter (2022/23 vs. 5-Year Average)

    Notes: Q1 includes the months of September, October, and November. Q2 includes December, January, and February. Q3 includes March, April, and May. Q4 includes June, July, and August. Disbursement Percentages calculated in comparison to Q1.

    Sources:

    Gardner, Grant, Hunter Biram, and James Mitchell. “Low River Levels, Barge Freight, and Widening Basis.” Southern Ag Today 3(39.1). September 25, 2023. Permalink.

    USDA-NASS. 2023. Washington, DC  


    Gardner, Grant, and William E. Maples. “River Levels and Off-Farm Storage Disbursement.” Southern Ag Today 3(43.1). October 23, 2023. Permalink

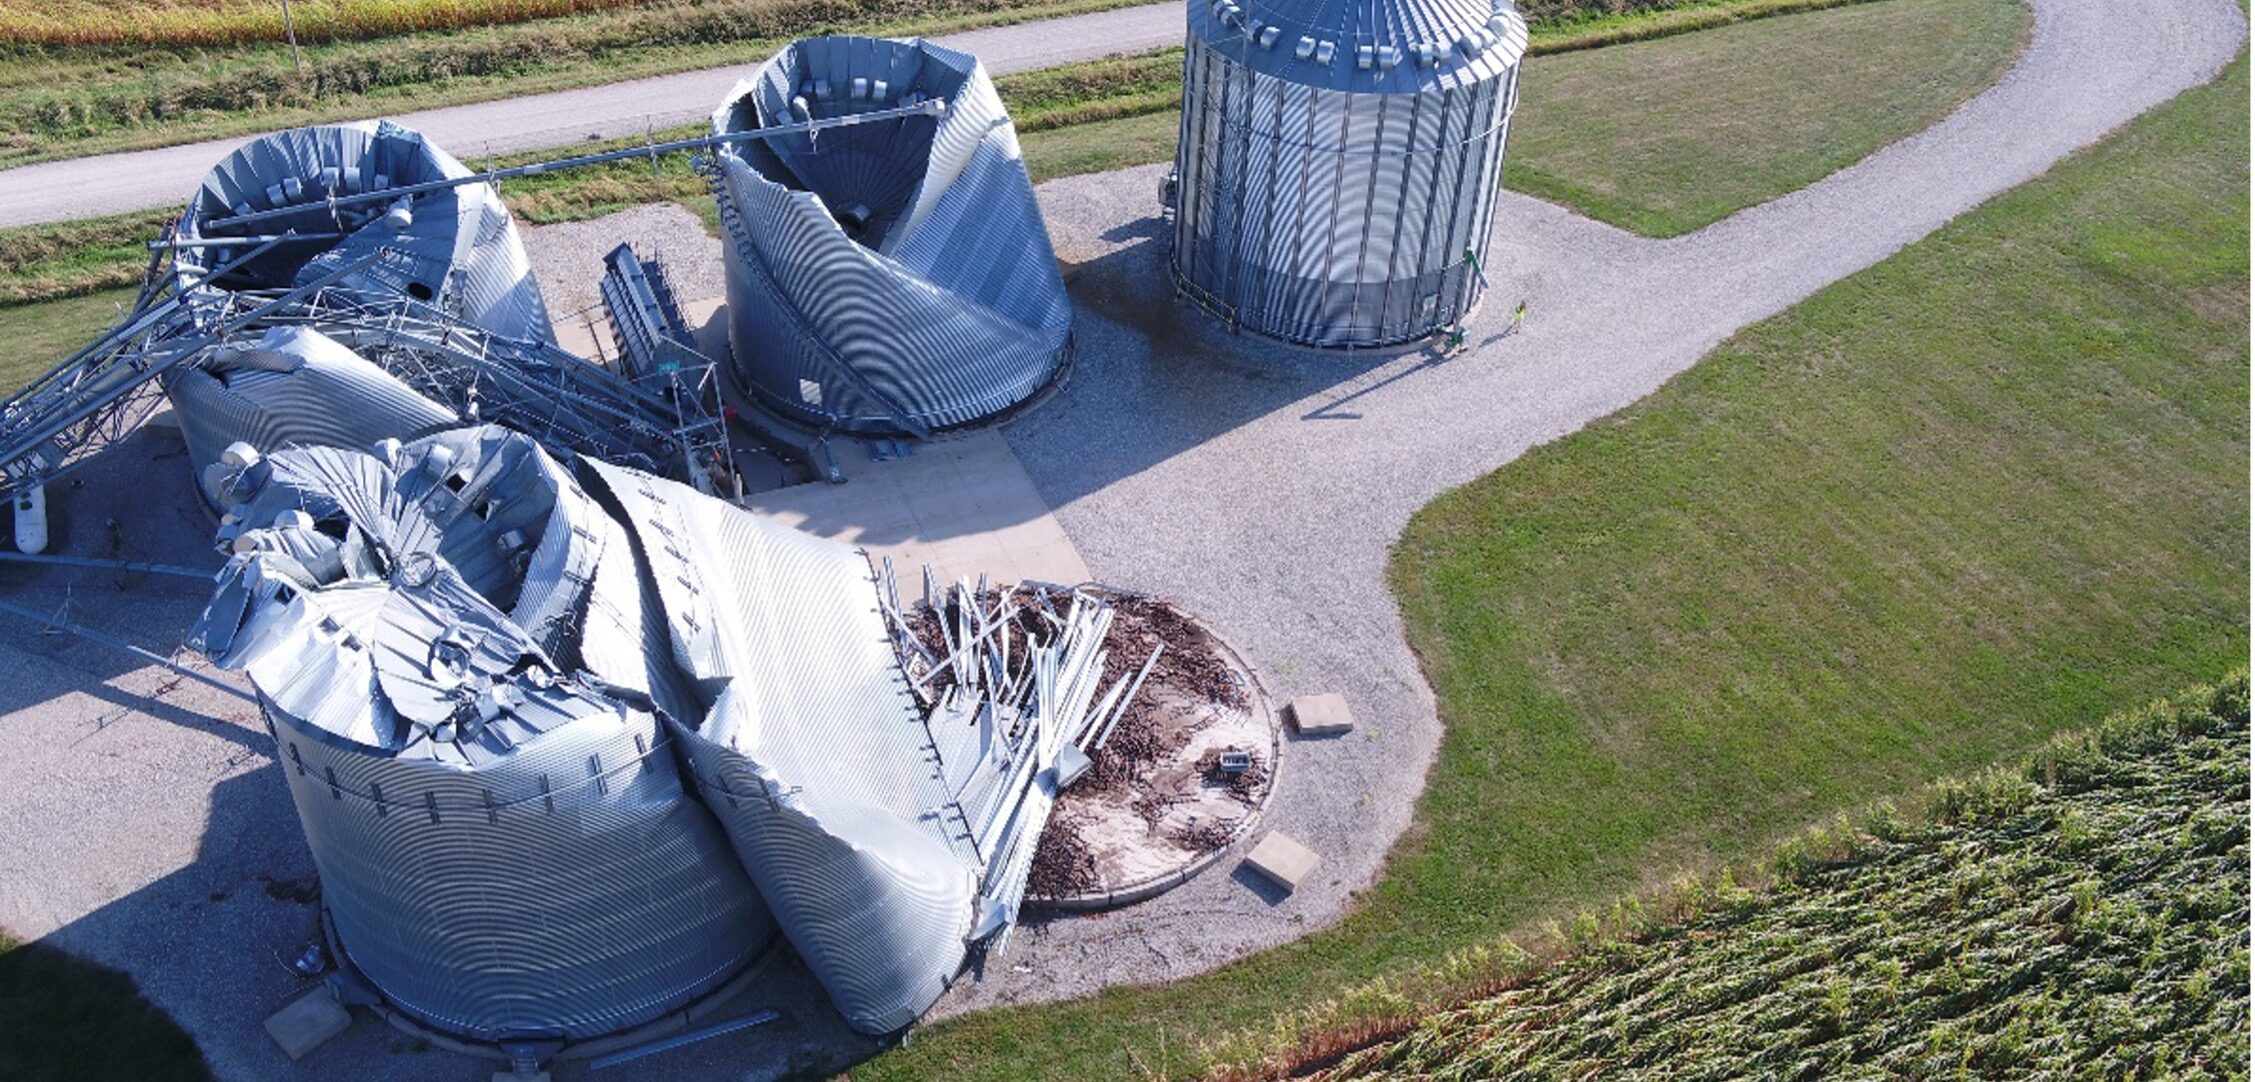
  • Improving Ag Structures’ Resilience to Wind Damage

    Improving Ag Structures’ Resilience to Wind Damage

    Severe weather has long threatened farms and ranches. Such incidents, including high winds, are expected to become more frequent and more intense. Fortunately, farmers and ranchers can take steps to reduce the vulnerability of their agricultural structures to windstorms. Tips for reducing the vulnerability of existing structures include:

    • Annual inspections should include areas that may be rusted to the point of needing to be replaced as well as cracks in foundations.
    • Prior to storms, check structures for loose elements and vulnerabilities. Loose fitting lids, vents, etc. should be secured.
    • Doors and windows should be shut tightly. If they cannot be closed, they should be latched in a secure open position (e.g., metal building and Quonset hut doors should be latched closed or fully open). 
    • Structures such as movable carports used for livestock shade should be anchored for their own protection and the protection of nearby structures as well as livestock, if they are not moved to safer environments. 

    Our 2020-2022 study of farm wind damage found that only 43% of respondents’ farms had fully recovered after two years. The availability of builders and materials were most often cited for delays in construction, followed by cost and insurance coverage. On the other hand, most respondents said they and their insurance adjusters largely agreed on the level of wind damage for agricultural buildings, center pivot irrigators, and steel grain bins. Still, farmers and landowners should review their insurance policies to make sure the coverage meets current business needs.

    Most farmers surveyed in 2022 said they intended to rebuild structures with enhanced wind resistance. However, observations of their replacement structures indicate less enhancement. When replacing structures, businesses are usually balancing multiple objectives including cost, capacity needs, and availability of construction materials. Steel grain bins provide an example of trade-offs between capacity and structural integrity. Findings from our assessment of bins, computational modeling of wind loading, and review of other studies finds:

    • Taller bins and bins more exposed to wind speed (i.e., not near other buildings or other windbreaks) are more vulnerable.
    • Bins are most resilient when full of product distributed evenly throughout the structure. However, even full bins can fail at the wall-roof connection (roof damage or tear off) or experience non-structural damage (e.g., stair damage).
    • Vented bins were more vulnerable than bins without vents.
    • Steel grain bins with vertical stiffeners tend to perform significantly better during wind storms than unstiffened bins.
    • Wind rings around bins do not appear to be significantly more resilient.

    Wittich, Christine, Maria Watson, Rebekka Dudensing, Steven Klose, and Dean Mc Corkle. “Improving Ag Structures’ Resilience to Wind Damage.Southern Ag Today 3(42.5). October 20, 2023. Permalink

  • Can Chinese Demand for U.S. Hides and Skins Recover?

    Can Chinese Demand for U.S. Hides and Skins Recover?

    Hides in the leather business typically refer to the skin of large animals while skins typically refer to smaller livestock. Raw cattle hides are generally grouped with offal items when discussing total animal value, but hides and skins are an important contributor to the total value of most cattle as the leather is commonly used for belts, shoes, wallets, jackets, car seats and interior, etc. Hide selections are grouped in several ways but are typically based on being branded or native (i.e., not branded), steers and heifers versus cows, dairy cows versus beef breeds, hides from mature bulls, and light versus heavy hides. The value of the hides is further based on the quantity of defects they contain as it relates to holes, cuts, lesions, or grain defects, often caused by injuries, horns, flies, ticks, grubs, and poor skinning and fleshing practices.

    Supplying its massive leather production industry, China has been the largest importer of hides and skins for both the U.S. and the world. However, imports over the past few years have been declining. In 2013, raw cattle hides and skins were a major agricultural export for the U.S., reaching $2.3 billion, with China accounting for 63%. However, as of 2022, U.S. exports were only $876 million, and it appears that exports in 2023 will be even lower (USDA, 2023). At first glance, it would not be unreasonable to think that raw hides and skins were affected by the U.S. trade war with China. Clearly, the tariffs the Chinese government imposed on U.S. hides and skins, on top of the tariffs that the U.S. government imposed on finished leather products resulted in direct and indirect negative impacts on U.S. exports of hides and skins to China. However, taking a longer view of the data, U.S. exports to China have been declining for nearly a decade.

    Figure 1 show Chinese imports of raw cattle hides and skins from the U.S., Australia, Canada, and all remaining countries combined (rest of world) since 2015. Note that Chinese imports exceeded $2.5 billion in 2015 but decreased to around $1.8 billion in 2016 and 2017. While imports fell even more in 2018 and 2019 during the trade war, this appears to be a part of an overall declining trend. For instance, imports from the U.S. fell by 66% during this period, but imports from Australia and the Rest of World also fell by 71% and 68%, respectively. According to USDA (2018), a combination of both internal and external factors has contributed to this reduced demand and has increased the cost of producing leather domestically. These factors include growing competition from synthetic materials, rising labor costs, and stricter environmental regulations. Although modest, import increases in 2021 and 2022 relative to 2020 may be a sign of a possible recovery.

    Figure 1. Chinese imports of raw cattle hides and skins: 2015-2022

    Note: Raw cattle hides and skins are defined according to the Harmonized System Classification (HS) HS 4101 raw hides and skins of bovine and equine animals (not tanned, parchment-dressed or further prepared)
    Source: Trade Data Monitor® (2023)

    References

    U.S. Department of Agriculture (USDA). 2018. Chinese Demand for Imported Hides Beginning to Weaken. Foreign Agricultural Service GAIN Report: CH186027.

    U.S. Department of Agriculture (USDA). 2023. Global Agricultural Trade System. Foreign Agricultural Service. https://apps.fas.usda.gov/gats/default.aspx


    Muhammad, Andrew, and Andrew Giffith. “Can Chinese Demand for U.S. Hides and Skins Recover?” Southern Ag Today 3(42.4). October 19, 2023. Permalink

    Photo by Pixabay: https://www.pexels.com/photo/colors-belt-skin-belts-65280/

  • Sectoral and Regional Concentration of H-2A Patronage

    Sectoral and Regional Concentration of H-2A Patronage

    Based on H-2A utilization trends over the past two decades, the increase in its patronage has been more significant in farms that are more labor-intensive and with high demand for seasonal labor. Specifically, these sectors include fruit, tree nut, vegetable, melon, nursery, tobacco, and greenhouse farms. According to USDA’s Economic Research Service (ERS), H-2A employment statistics across farm enterprises indicate that crop farms accounted for 80 to 90 percent of H-2A workers hired since 2010, while livestock farms accounted for only 4 to 8 percent (Castillo et al., 2021).  Table 1 presents figures from more recent years that validate the ERS estimates.  Focusing solely on more explicit farm job titles declared in H-2A applications, workers in crop farms, nurseries, and greenhouses accounted for 84.7 to 88.2 percent of certified H-2A workers from 2020 to the 3rd quarter of 2023.  The share of workers in livestock farms, ranches, and aquaculture/animal-based businesses ranges from 4.0 to 4.8 percent.

    The geographic distribution and growth of employment of H-2A workers in the country has been quite uneven since its inception. Recently, the Southeast posted larger swings in H-2A patronage than other regions.  In 2007, about a third (34%) of H-2A workers were hired mainly in 5 states–California, Florida, Georgia, North Carolina, and Washington.  These states now account for more than half (52%) of all H-2A jobs.  

    In Table 1, Southern states that rank among the Top Ten in H-2A employment account for 26.4 to 30.8 percent of all certified H-2A workers.  These states (especially Florida and Georgia) have large fruit, vegetable, nursery, and greenhouse sectors that account for the bulk of the demand for H-2A workers.  The composition of the usual Top Five H-2A state employers list and the regional trends (Table 1) only validate the program’s apparent crop sector bias.

    The low H-2A employment in livestock farms can be attributed to these farms’ production cycle and unique labor needs.  Compared to specialty crop farms, livestock operations are generally less labor intensive. Furthermore, livestock operations that do have more intense labor requirements typically have year-round labor needs that cannot be filled by seasonal, temporary H-2A work contracts.  The current H-2A model clearly emphasizes its role as a mechanism for hiring seasonal and temporary workers to fill a need only during short time segments of the production or growing cycle. Existing H-2A regulations allow for initial employment or extension of employment for a maximum duration of one year.  Therefore, farmers face the challenge of recruiting and training (often at a significant cost) new workers every year instead of retaining their workforce from year to year. Among livestock farms, this lack of farm labor continuity causes uncertainty and inefficiencies in farm management, which affects the viability of employing H-2A workers in those operations.  

    Table 1. Annual Industry and Regional Breakdown of H-2A Certified Workers, 2020 (3rd Quarter)

    Notes:  Source:  H-2A Disclosure Datasets, Department of Labor3.
     
    These workers’ shares were obtained from explicit job titles used in the H-2A applications. For crop workers, the job titles considered here are “Farm workers and laborers, crop, nursery, and greenhouse” and “First line supervisors of agricultural crop and horticultural workers.”  For livestock workers, the job title is “Farm workers, farm, ranch and aqua animal.”  Although it is possible that other job classifications used in the applications may also include crop and livestock workers (categories like Others, Agricultural Equipment Operators, Graders and Sorters, Helpers – Production Workers, and Packers and Packagers, Hand), our summary only considers the earlier worker categories that explicitly identify farm operations-specific job positions.
     
    The Southern States are Arkansas, Florida, Georgia, Louisiana, Mississippi, Alabama, Tennessee, South Carolina, Kentucky. 

    Escalante, Cesar L. “Sectoral and Regional Concentration of H-2A Patronage.” Southern Ag Today 3(42.3). October 18, 2023. Permalink

  • Balance of Trade Has Shifted as Beef Production has Decreased

    Balance of Trade Has Shifted as Beef Production has Decreased

    While the vast majority of beef produced in the U.S. is consumed domestically, international markets are a significant piece of the U.S. beef system. For perspective, the U.S. exported the equivalent of about 12.5% of its beef production during 2022, while importing roughly 12%. This was a fairly typical balance of trade, especially for a year with high beef production levels like last year. However, as beef production is on track to see a significant drop in 2023, trade patterns are also being impacted.

    Through August, exports of U.S. beef are down by 14% from the first eight months of 2022. A drop of that magnitude certainly warrants some question but is largely a case of year-over-year comparison being a little misleading. For the first two quarters of 2023, beef production was about 4% lower than 2022. With lower production levels, a larger share of U.S. production will be consumed domestically. Additionally, high price levels are also making imports of U.S. beef less attractive in many countries. For example, exports to our three largest destinations (South Korea, Japan, and China) are all down sharply so far this year.

    The same factors that have led to lower export levels have also led to an increase in U.S. beef imports. Through the first eight months of the year, U.S. beef imports are up by a little over 5%. The largest percentage increases are in beef imports from Australia, New Zealand, and Uruguay, which are primarily sources of lean trim to go into ground beef. Unlike 2022 when the U.S. was a slight net exporter of beef, we are very much on track to be a significant net importer in 2023. Through August, U.S. beef imports have exceeded exports by more than 20%.

    This trend towards increased imports and decreased exports is likely to continue for the next few years. Given that this calf crop is smaller than last year’s calf crop, beef production is likely to decrease in 2024. And given expectations for lower beef cow inventory next year, I would expect beef production to be lower again in 2025. The same supply fundamentals supporting strong cattle prices are resulting in a significant shift in the balance of trade for beef. And as beef supplies get increasingly tighter over the next couple of years, we are likely to see an ever greater divergence between imports and exports.

    Burdine, Kenny. “Balance of Trade Has Shifted as Beef Production has Decreased.” Southern Ag Today 3(42.2). October 17, 2023. Permalink