Blog

  • Counter Seasonal Runs in Cattle Prices

    Counter Seasonal Runs in Cattle Prices

    As we approach the fall months, folks in the cattle industry might expect to see some weakness in cattle prices as many producers sell their spring born calves. However, 2023 could shape up to be one of the abnormal years when the broader upswing in prices outweighs the typical seasonal pressure. 

    The chart above uses monthly average prices for 500-600 pound medium and large #1 steers sold at auctions in Texas. The lines for 2014, 2015, and 2023 use the left axis and are dollars per hundredweight. The solid black line with markers represents the 10-year average monthly index values from 2013-2022 and uses the right axis. Without getting too deep into the details, this index calculation is one way to visualize seasonal patterns. An index value of 96 (October) means that during 2013-2022, prices were 4 percent lower than the annual average. Similarly, an index value of 103 (March) means prices were 3 percent higher than the annual average.  

    As the chart shows, normal seasonal patterns would suggest falling prices for the next few months for 5 weight cattle. But 2023 has been anything but normal. History shows us years when prices seem to mostly ignore within-year seasonal patterns because of broader uptrends or downtrends in prices. 2014 is an example year when prices rose throughout the year and overshadowed seasonal patterns. 2015 is an example of a market downtrend that concealed seasonal patterns, 

    So far in 2023, this year has been more similar to 2014 with prices rising steadily throughout the year. Instead of the typical dip from March-May, prices rose in 2014 and 2023. This could well be the story this fall too as overall strength in cattle markets (and tighter supplies) outweighs the within-year seasonal patterns we might expect. 


    Maples, Josh. “Counter Seasonal Runs in Cattle Prices.Southern Ag Today 3(32.2). August 8, 2023. Permalink

  • Peanut Farmers Find Marketing Opportunities through Agricultural Cooperatives

    Peanut Farmers Find Marketing Opportunities through Agricultural Cooperatives

    Peanut farmers in the post-quota era have historically had limited marketing opportunities.  There is no futures market for peanuts, and the market is defined as relatively thin with a high concentration by two major buyers, Golden Peanut Company and Birdsong Corporation (Adjemian, Saitone, and Sexton 2016).  In economics, this is known as an oligopsony – a market that is dominated by a very few disproportionately large buyers.   Sellers in an oligopsony market have little ability to influence the price they receive for their product.  Here the seller is the peanut farmer looking to market their crop who often must just accept what shellers will pay.

    The agricultural cooperative model allows farmers to work together to sell their product, achieve greater bargaining power, and provide profit sharing opportunities.  Grower-owned peanut shellers provide member peanut farmers an opportunity to share in the downstream profit that is otherwise not passed through to the farmer.  Over the past decade, there has been considerable growth in grower-owned peanut shellers.  A few examples include Premium Peanut that was formed in 2014 in Georgia, Delta Peanut that was founded in 2018 in Arkansas, and Coastal Growers that came together in 2021 in Alabama.

    The table below shows the current USDA approved peanut warehouse storage capacity in the United States.  While the top two firms control 47.2% of the storage capacity, we see five grower-owned shellers (listed in bold) that combine for 28.3% of the storage capacity.  Furthermore, that share of grower-owned capacity has more than doubled since 2017 from both increases by existing grower-owned shellers and the entry of Delta Peanut and Coastal Growers.  While storage capacity is not fully reflective of market share, it represents a reasonable approximation and is indicative of marketing opportunities that farmers are leveraging through agricultural cooperatives.

    References:

    Adjemian, M.K., Saitone, T.L. and Sexton, R.J. (2016), A Framework to Analyze the Performance of Thinly Traded Agricultural Commodity Markets. American Journal of Agricultural Economics, 98: 581-596. 


    Rabinowitz, Adam, and Festus Attah. “Peanut Farmers Find Marketing Opportunities through Agricultural Cooperatives.Southern Ag Today 3(32.1). August 7, 2023. Permalink

  • Is Your Operation AGRItourism or AgriTOURISM?

    Is Your Operation AGRItourism or AgriTOURISM?

    Whether your operation emphasizes the agricultural aspect or the tourism aspect of agritourism matters in several legal issues. This article briefly describes some of the pitfalls of having the tourism aspects dominate the agricultural aspects. However, except for federal income taxation, these issues differ from state to state. In addition, this article cannot begin to explore the nuance of these issues. Therefore, this article intends to alert the reader to these issues. You should consult with your attorney and tax advisor for advice.

    Agritourism Generally

    One definition of agritourism defines the term as “a form of commercial enterprise that links agricultural production and/or processing with tourism to attract visitors to a farm, ranch, or other agricultural business for purposes of entertaining and/or educating visitors and generating income for the farm, ranch, or business owner.”[1] Like most definitions of agritourism, this definition connects the tourism activity to a farm, ranch or agricultural business. This connection proves particularly important in zoning

    Zoning

    In general, local governments are free to define agritourism in zoning ordinances differently than any state definitions. Theoretically, every local government could define agritourism differently from any other local government for zoning purposes. However, most zoning definitions share some common elements.

    In zoning terminology, the connection between tourism and agriculture makes agritourism activity an accessory use on the land. The agricultural use is the property’s principal use, or primary use. Accessory uses are uses that are subordinate and customarily incidental to the principal use. 

    A use is subordinate where the use does not dominate the parcel. Courts look at how much land area is encompassed by each use, how many employees are engaged in each use, and revenue generated by each use. The agricultural (or principal use in this case) should dominate the parcel of land.

    Customarily incidental means that the accessory use is an activity that one would consider a normal part of or related to the primary use. For example, a pick-your-own operation is customarily incidental to an apple orchard. A corn maze may be customarily incidental to an operation that grows hay. A bouncy house does not appear to be customarily incidental to any farming operation. 

    Exemptions from Zoning

    Some states exempt agritourism from zoning regulations. To qualify, the activity must meet similar requirements to the accessory use definition. For example, a North Carolina court[2] identified three main factors to determine whether an activity is agritourism and, therefore, exempt under North Carolina law. First, the agritourism activity derives some value from or requires the farm or natural setting. Second, the legal risk factor should align with that of the farm use, and third, the agritourism use does not require much in the way of artificial structures or alterations to the land.

    Agritourism Liability Acts

    Many Agritourism Liability Acts similarly define agritourism as “an activity carried out on a farm or ranch.”[3] Without the principal use of the farm or ranch, the liability protection may be lost.

    Use Value Assessment for Real Property Tax Purposes

    Use value assessment for real property tax purposes also depends upon the agricultural use of the land. When income from non-agricultural uses exceeds income from agricultural uses, use value assessment may be denied.[4]

    Federal Income Tax

    Persons engaged in “farming” report farm income on the Schedule F for federal income tax purposes. Farm income is treated differently in many ways than other business income to the benefit of the farmer. However, most “agritourism” income does not likely qualify as “farm income.” If the agritourism income is more than “incidental” (which is difficult to define), the agritourism income should be segregated and reported separately on Schedule C.[5]

    Conclusions

    Agritourism provides producers with the opportunity to generate additional income to supplement income from production activities. However, with additional income and success with agritourism activities come the potential for loss of the preferential treatment of agricultural in several legal settings. Operators should be careful to consider these consequences when planning agritourism activities.  


    [1] National Agricultural Law Center, Agritourism, https://nationalaglawcenter.org/research-by-topic/agritourism-2/

    [2] Jeffries et al v. Harnett County, 259 N.C. App. 473 (2018), cert. denied 826 S.E.2d 710 (2019). See https://canons.sog.unc.edu/2022/07/what-the-heck-is-agritourism/ for a more in depth discussion of the case.

    [3] See, e.g., Virginia Code § 3.2-6400.

    [4] See, e.g., Settimi v. Irby, 2022 WL 292317 (Supr. Ct. of W.Va.).

    [5] Email correspondence with Kristine A. Tidgren, Iowa State University, February 5, 2023. For more information on farm income generally, see https://www.calt.iastate.edu/article/reporting-farm-income-overview


    Richardson, Jesse J. “Is Your Operation AGRItourism or AgriTOURISM?Southern Ag Today 3(31.5). August 4, 2023. Permalink

  • Have Payment Yields Kept Up with Actual Crop Yields?

    Have Payment Yields Kept Up with Actual Crop Yields?

    Given all the discussion in Washington these days focused on updating crop base acres, it made me wonder whether farm program yields (PFC payment yields) have kept pace with actual crop yields.  Most people refer to the mid-1980s as when crop bases as we currently know them were set based off of a producer’s planting during the early 1980s.  It made sense to start with the U.S. average payment yields from the target price/deficiency payment program from 1985.  The 1985 yields were compared to PFC payment yields from 2021 for the major crops.  As seen in the table, corn (35.2%), rice (26.6%) and wheat (19.7%) experienced the highest percent change in payment yields over the 1985 to 2021 period. Seed cotton, soybeans, and peanuts all became normal program commodities after 1985 so there isn’t a comparison yield for that time period. 

    The percent changes in actual yields were evaluated from 1985 to 2021 for all of the listed commodities with upland cotton replacing seed cotton in the actual yield evaluation.  Several commodities (corn, soybeans, upland cotton, rice, and peanuts) all experienced a significant increase in actual yields.  

    While this is only evaluating 2021 relative to 1985 it does indicate that nationwide, corn, wheat, and rice producers have done a good job of using yield updating opportunities to increase payment yields.  On the other hand, both actual and payment yields for grain sorghum have largely stayed the same over the period.


    Outlaw, Joe. “Have Payment Yields Kept Up with Actual Crop Yields?Southern Ag Today 3(31.4). August 3, 2023. Permalink

  • The Cost of Money and Commercial Poultry Growing

    The Cost of Money and Commercial Poultry Growing

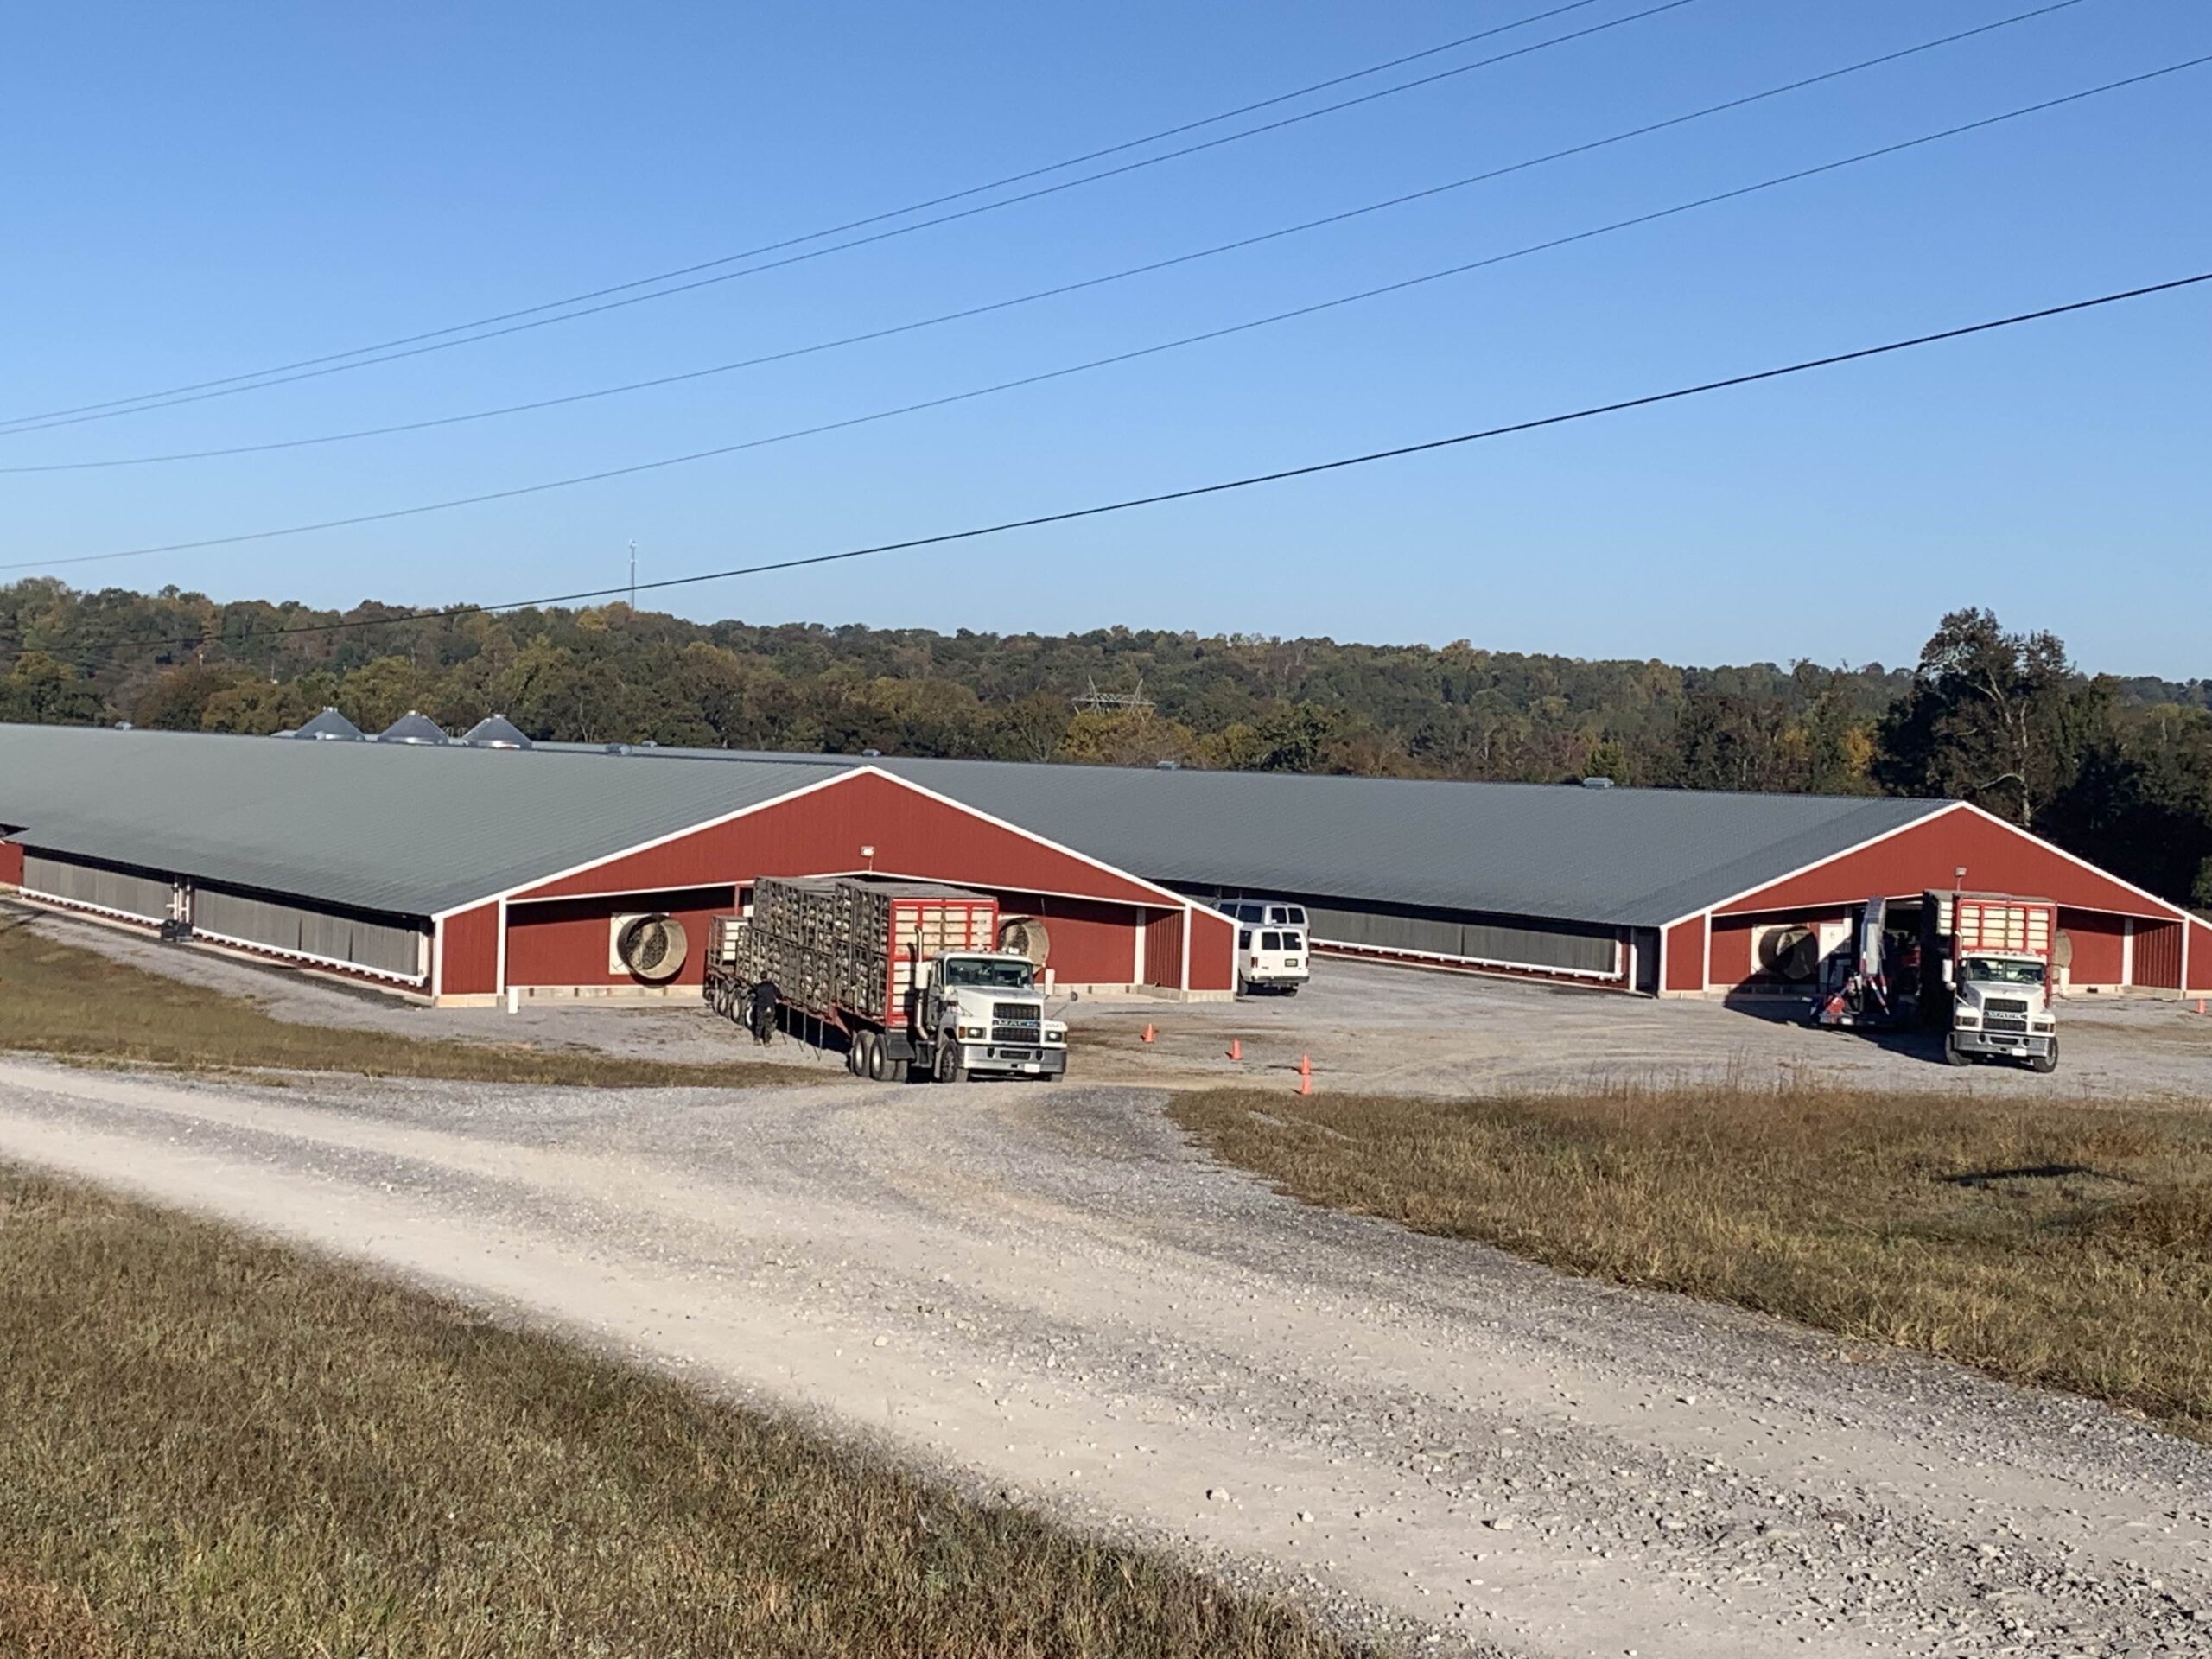
    Historically, commercial poultry grower loans have been considered by lending institutions to be among the lowest risk agricultural loans due to the secure nature of the grower’s contract with poultry companies. However, the increasing cost of new facilities in the last few years has quickly outpaced the average farmer’s ability to obtain new loans without financial support. For example, a typical broiler farm consisting of eight houses, 54 feet wide by 550 feet long each (237,600 square feet), can easily cost $22 per square foot or over $5,000,000. This cost does not include a land purchase. A traditional 20% equity requirement would mean approximately one million dollars of mortgageable equity or cash influx would be required to secure such a loan. Thus, most of these loans now go through some government funded, farm-oriented program that helps growers obtain loans. 

    For example, the USDA’s Farm Service Agency loan guarantee program can effectively cut the equity requirement in half. There are fees and qualification guidelines for these loan programs, and not all applicants are accepted. Equity is not the only problem. Interest rates have become a significant obstacle. The FSA restricts the interest rates charged by banks for their guaranteed loans to a maximum of the 5-year constant maturity treasury (CMT) rate plus 5.5%.  Figure 1 illustrates the changes in this max rate since July 2022. According to farm financing institutions, loan rates for most growers in July of 2022 were averaging around 5%. Due to inflation and other uncertainties, as well as the rising CMT, the current average rate for poultry loans is now closer to 8%, with expectations of further increases by the Federal Reserve. A couple or three percentage points doesn’t sound like much, but in the case of these large loans over a typical 15-year term, it can mean an increase of 18-20% in annual payments, or over $100,000 per year.  

    At the same time, like all farmers, poultry growers are dealing with rising utility and labor costs. Higher loan payments combined with higher costs have a significant negative impact on the cash flow of new farms. Many potential new growers are unable to obtain funding at all due to the resulting low debt service margins. To help relieve the cash-flow pressure, many lending institutions have moved to offering 20-year terms on poultry loans. This decreases the annual payment but also increases the total interest paid over the term. If you combine increased interest rates with lengthier loan terms, the result has effectively doubled the overall cost of building a new farm from a year ago, making it extremely difficult for new growers. 

    To assist growers in securing the financing to build new housing, poultry companies are addressing farm cash-flow problems by supplying funding directly to the growers, either in the form of additional pay incentives over the loan period or in the form of up-front money used to pay down the initial loan, decreasing the equity required and the annual loan payment. These incentives have almost doubled over the last year due to the factors discussed (See Fig 2). Some obvious questions arise from the situation. For the industry, “How long can poultry companies continue to offer these increasing cash incentives before profitability begins to suffer?”, and for consumers, “At what point will housing difficulties impact supply, potentially increasing chicken prices?”

    Fig 1: Farm Service Agency Guaranteed Loans Maximum Interest Rate 

    CMT: “Constant Maturity Treasury” rates as defined by the U.S. Treasury https://home.treasury.gov/resource-center/data-chart-center/interest-rates
    Applies to loans with fixed rates of 5 years or more.  Actual lender rates may be less.

    Fig 2: Comparing Cash Incentive Payments and Total Interest Cost for a New 8-house (54’x550’) Farm in 2022 and 2023 Resulting from Changes in Interest Rate and Loan Term

    *The above numbers are estimates for informational purposes only. They are assuming $20/SF cost, average production returns, variable costs, integrator incentives and payment information.  They do not represent any specific farm or situation.