Blog

  • Economic Assistance for the 2024 Crop Year Starting to Take Shape

    Economic Assistance for the 2024 Crop Year Starting to Take Shape

    As we have noted over the past few months (see here and here), there is growing pressure to complete a farm bill in advance of the 2025 crop year and to provide economic assistance for 2024 losses given the low levels of support being provided by the current farm bill extension.  Hurricanes Helene and Milton have also resulted in renewed calls for natural disaster assistance for the 2023 and 2024 crop years.

    While work continues behind the scenes on the farm bill – with no clear indication of the path forward – economic assistance for 2024 losses is starting to take shape. Most of the chatter concerns the significant collapse in commodity prices over the past two years coupled with costs of production that have continued to remain high. That cost-price squeeze has resulted in the largest 2-year decline in crop cash receipts in history (here).

    Rep. Trent Kelly (R-MS) has introduced the Farmer Assistance and Revenue Mitigation Act of 2024 (The FARM Act) which would provide emergency assistance to producers of eligible commodities for which the expected revenue in crop year 2024 is below the projected per-acre cost of production.  Acres planted or prevented from being planted in 2024 to the following crops would be eligible for assistance: barley, corn, cotton, dry peas, grain sorghum, lentils, large chickpeas, oats, peanuts, rice, small chickpeas, soybeans, other oilseeds, and wheat. FARM Act payments are calculated as follows:

    FARM Act Payment = (Projected Cost – Projected Returns) x Eligible Acres x 60% where:

    • Projected Cost is the per-acre cost published by USDA’s Economic Research Service for corn, soybeans, wheat, cotton, rice, sorghum, oats, and barley and otherwise as determined by the Secretary in a similar manner.
    • Projected Returns for corn, soybeans, wheat, cotton, rice, sorghum, oats, and barley are determined by multiplying the projected 2024 marketing year average price published in the WASDE by the 10-year national average yield for the eligible commodity and otherwise as determined by the Secretary.
    • Eligible Acres consist of 100% of the acres planted to an eligible commodity plus 50% of the acres prevented from being planted to an eligible commodity in crop year 2024, as reported to FSA by the producer.

    Existing provisions relative to attribution of payments, actively engaged in farming, and other regulations apply. With respect to payment limitations, persons or entities that derive less than 75% of their income from farming, ranching, or forestry are subject to an overall limitation of $175,000. Persons or entities that derive 75% or more of their income from farming, ranching, or forestry are subject to an overall limitation of $350,000 in assistance.

    Table 1 provides an estimate of the per-acre payments under the FARM Act. In this analysis, we use estimates from the October 2024 WASDE for the marketing year average price along with harvested acre yields from NASS. Most importantly, these are merely estimates and are subject to change.  For example, Congress may choose to reduce the payment factor, or they may choose to go a different direction altogether. Regardless, proposals are starting to take shape, and the levels of support being discussed would provide a meaningful amount of assistance to help offset losses in 2024.

    Table 1. Estimated Per-Acre Payments for Select Commodities under the FARM Act.

    1/ https://www.ers.usda.gov/webdocs/DataFiles/47913/cop_forecast.xlsx?v=7421.1.
    2/ Based on October 2024 WASDE.
    3/ Based on NASS harvested acre yields.

    Fischer, Bart L., and Joe Outlaw. “Economic Assistance for the 2024 Crop Year Starting to Take Shape.Southern Ag Today 4(43.4). October 24, 2024. Permalink
  • October WASDE Report Decreases U.S. Cotton Production, Mill Use and Exports

    October WASDE Report Decreases U.S. Cotton Production, Mill Use and Exports

    The October 2024 WASDE report featured a sizeable cut to U.S. cotton yield and production forecasts.  This was largely the result of impacts from Hurricane Helene on the southeast region of the Cotton Belt. USDA reduced the U.S. average all cotton yield by 18 pounds to 789 pounds per acre.  If realized, this would be the lowest yield since 2015. USDA in turn lowered production by approximately 310,000 bales, which put the 2024 crop estimate at 14.2 million bales.  No adjustments were made to planted and harvested area estimates.  Beginning Stocks were left unchanged at 3.15 million bales.  Total supply was reduced to 17.36 million bales on this lower production estimate. 

    On the demand side of the U.S. balance sheet, USDA reduced 2024/25 domestic mill use by 100,000 bales to 1.8 million and lowered its export forecast by 300,000 bales to 11.5 million. The current mill use estimate would be the lowest since the 1884/85 marketing year, when approximately 1.7 million bales were used (Meyer and Dew, 2023).  U.S. cotton export weekly net sales are off to a sluggish start in the new crop (2024/25) marketing year. Cumulative export sales for the 2024/25 crop are down 10 percent from last year, as of the week ending October 3rd.  Notably, U.S. cotton sales to China are off 74 percent from a year ago, reflecting USDA’s outlook for a 6-million-bale reduction in China’s import needs this year. In recent years, China has consistently been the single largest buyer of U.S. cotton.  However, in the current marketing year, China purchases lag Pakistan, Vietnam, Mexico and Turkey. Of note, in 2023/24, China’s imports reached an 11-year high of 15 million bales.  A few key factors led to last year’s surge in imports, including purchases for government reserves, lower domestic production, and lower foreign prices relative to domestic prices.  Imports for government reserves in 2023/24 amounted to one-third of China’s total imports, or roughly 5 million bales. With an increase in government reserves and an 800,000-bale increase in cotton production this year, China’s imports are expected to decline sharply in 2024/25, falling below the 5-year average of 9.8 million bales. 

    Total demand for U.S. cotton was lowered 400,000 bales this month, which left 4.1 million bales in ending stocks. Despite a large cut in production, ending stocks were increased 100,000 bales from the September estimate as larger reductions in mill use and exports offset sizeable productions losses in Georgia and the Carolinas. 

    The 2024/25 season average upland farm price was unchanged at 66 cents per pound, down 13.3 percent from last year’s 76-cent average.  This price would be the lowest season average farm price since 2019/20. There were no revisions to the 2023/24 U.S. cotton balance sheet.

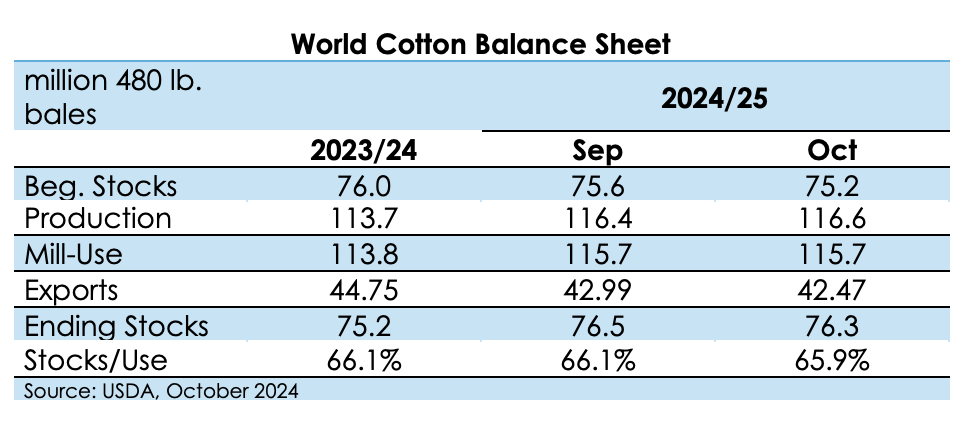
    USDA’s October projections for the world cotton balance sheet included a decrease in beginning stocks, an increase in production, stable consumption, and slightly lower ending stocks.   World production was increased over 200,000 bales to 116.64 million bales from 116.42 million last month. Notable increases were in China (+400,000 bales) and Brazil (+100,000 bales) which more than offset the 300,000 bale reduction in the U.S. crop.  Brazil is expected to produce a second consecutive record crop of 16.8 million bales in 2024/25.  Brazil surpassed the U.S. last year in cotton production and exports, becoming the world’s largest cotton exporter and third largest producer, behind China and India.

    World cotton trade was reduced over 510,000 bales to 42.47 million, mainly due to a 500,000-bale reduction in China’s imports.  For 2024/25, China’s imports are estimated at 9 million bales, down from 9.5 million last month and 15 million bales last year.  China’s cotton inventories relative to use are comfortable. With production of 28.2 million bales, ending stocks in China are expected to be 36.24 million at the end of the marketing year.  Thus, domestic stocks would be equivalent to 95 percent of China’s 38 million bale projected mill use.  World ending stocks were reduced 160,000 bales from last month to 76.3 million, up from 75.2 million in the 2023/24 marketing year. There were no significant revisions to the 2023/24 global balance sheet.

    USDA did note in its October Crop Production report that survey work for the field crop forecasts occurred primarily from September 28 to October 7. While much of the survey work did occur after the most severe weather from Hurricane Helene, the full impact of the storm may not be reflected in the current report.

    Reference:

    Meyer, L., & Dew, T. (2023). Cotton and wool outlook: December 2023 (Report No. CWS-23k) U.S. Department of Agriculture, Economic Research Service.

    USDA. (2024). World Agricultural Supply and Demand Estimates. (WASDE-653) U.S. Department of Agriculture, World Agricultural Outlook Board. October 11.


    Stiles, Scott. “October WASDE Report Decreases U.S. Cotton Production, Mill Use, and Exports.” Southern Ag Today 4(43.3). October 23, 2024. Permalink

  • An Alternative Big Mac

    An Alternative Big Mac

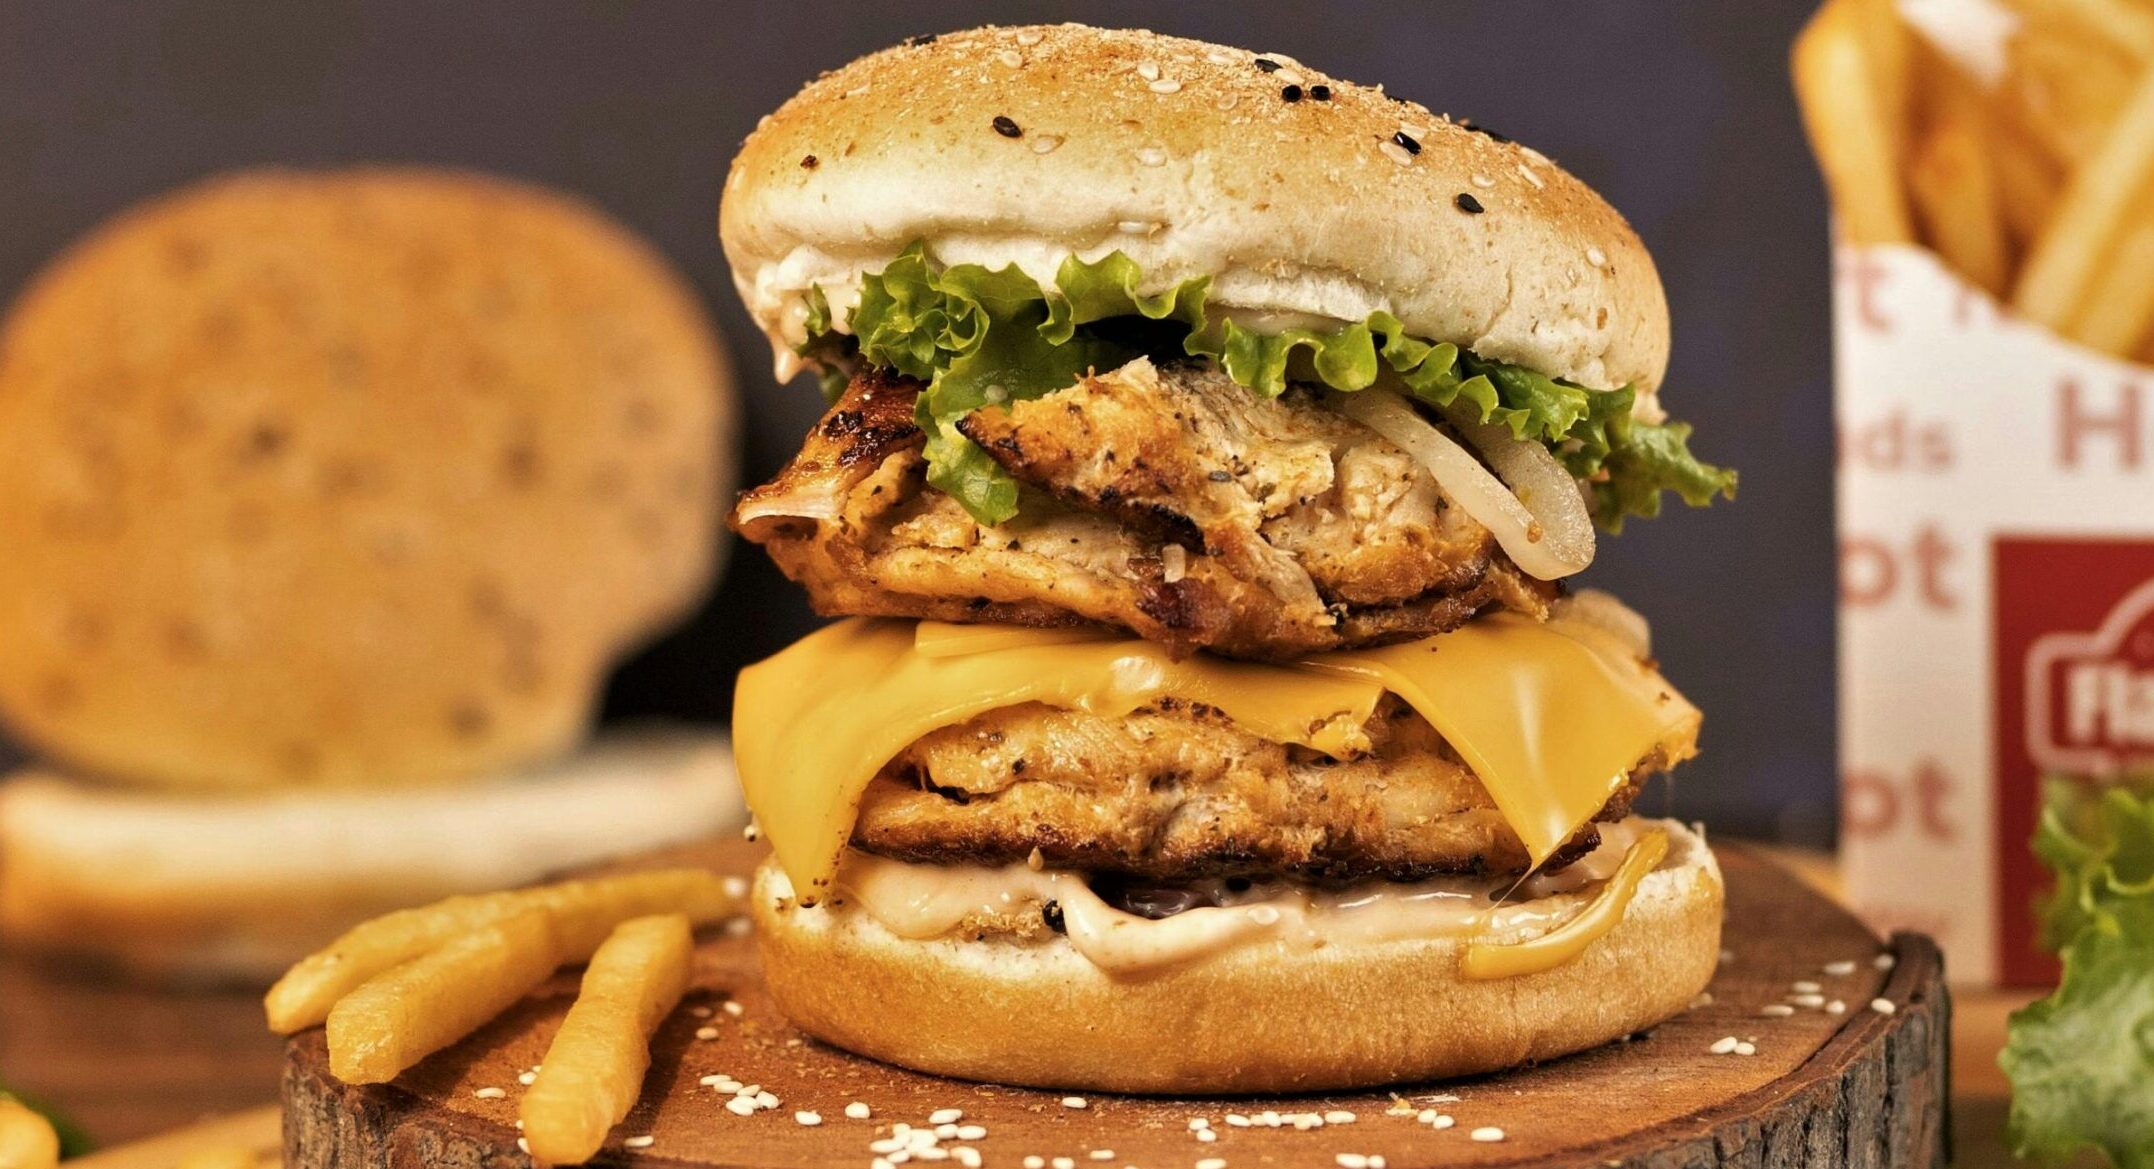
    Most people have likely seen the news that McDonalds is rolling out, for a limited time, a Chicken Big Mac.  Some of you, of a certain age, might be singing the words in your mind now: “two all-beef patties, special sauce…”  A question on many cattle producer’s minds has been “how long will people keep buying beef at record high prices?”  If beef prices are higher relative to chicken prices might people begin to buy more chicken?  Those are great questions about beef demand because relative prices matter.  We would expect some changes in purchases away from beef as it becomes relatively more expensive.  I don’t purport to know the goings on in McDonald’s as they create strategies to build their business but, we can look at some relative prices in the wholesale meat market to shed some light on the input price side.

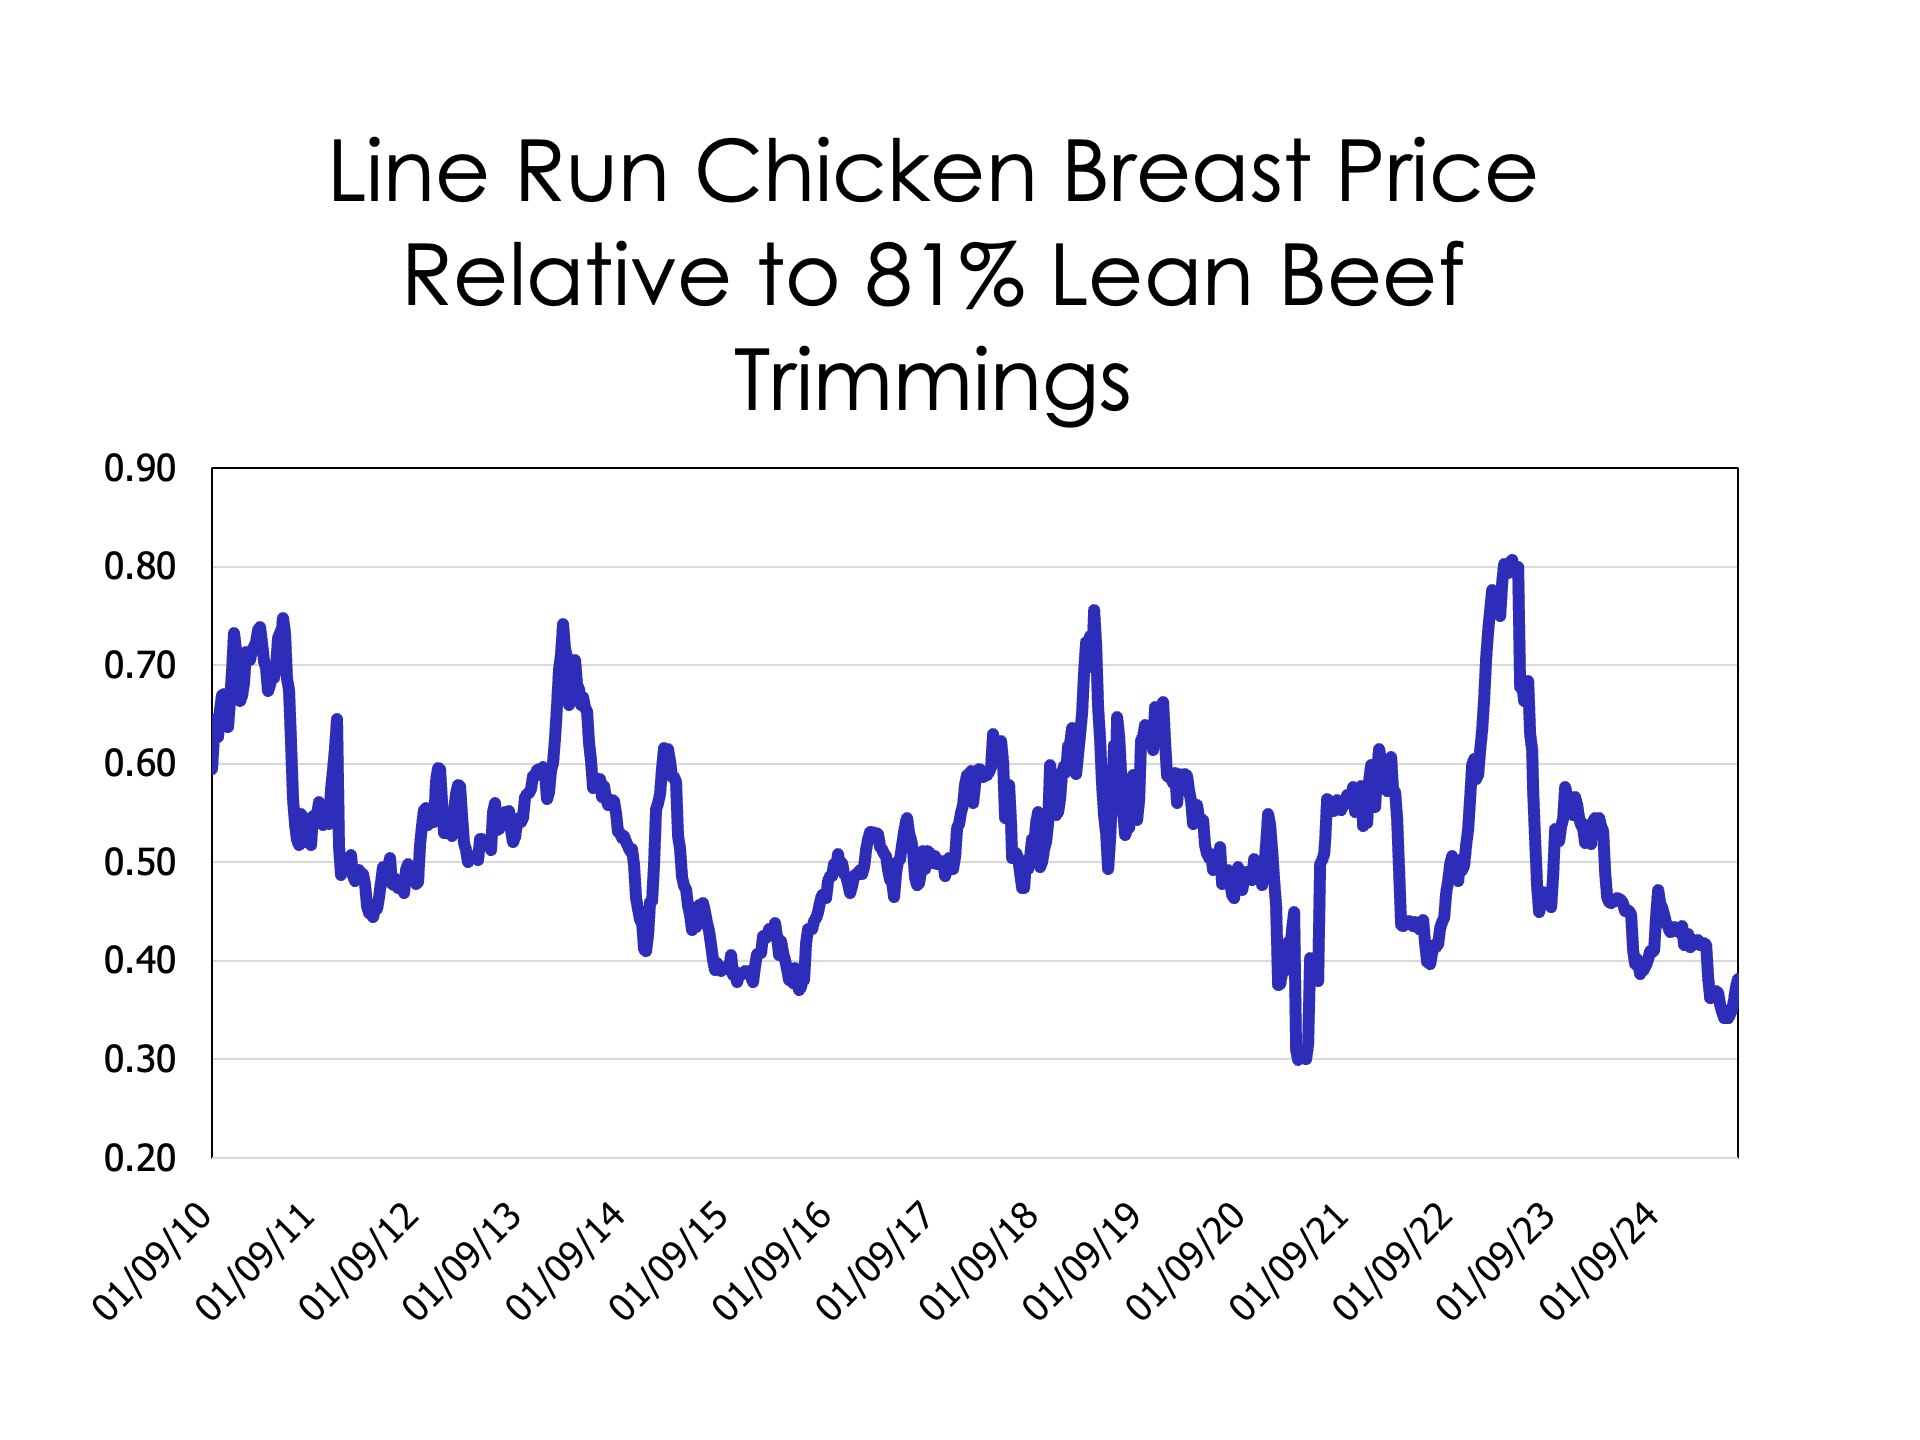
    In this case, we can compare wholesale chicken breast prices to beef trimmings prices to look at relative changes over time that might lend some support to trying a new menu item.  There are several data series that could be used to capture the longer-term trends.  On the chicken side we can use line run chicken breasts or boneless, skinless breasts.  On the beef side, a number of different lean-to-fat ratios for trimmings could be used.  This example uses line run chicken breasts and 81 percent lean beef trimmings.

    The price of line run chicken breasts was only 34 percent of the price of 81 percent beef trimmings in late August 2024.  The only time in the last 15 years that chicken breasts approached a lower relative value compared to beef was in the Summer of 2020.  The trend over the last couple of years has been for chicken breasts to decline in value relative to beef trimmings.  Much of ground beef comes from culled cows and cow prices have increased dramatically as the cow herd has declined in number.  Lower chicken prices create incentives to try some new chicken-based menu items.  

    Live cattle and meat prices are quoted in dollars per pound or cwt.  But, a restaurant has to put together a meal, a plate, or a dinner that hits a price point that people want to buy.  Cheaper chicken relative to beef creates opportunity for new items to help restaurants reduce their costs.  Beef prices are likely to remain relatively more expensive than chicken for some time to come.


    Anderson, David. “An Alternative Big Mac.Southern Ag Today 4(43.2). October 22, 2024. Permalink

  • 2024 Agricultural Lending Condition Update

    2024 Agricultural Lending Condition Update

    According to the most recent estimates from the USDA ERS, the US agricultural sector is projected to experience a significant decline in profitability. Overall, current estimates indicate that net farm income in 2024 will be 6.8% lower than in 2023, a year that already saw a substantial drop compared to 2022. Expected cash receipts are anticipated to decline most sharply for corn, soybean, and cotton producers, with decreases ranging from 14% to 22% relative to last year. This suggests that some commodity producers will face increased financial pressure for the remainder of 2024 and possibly into early 2025.

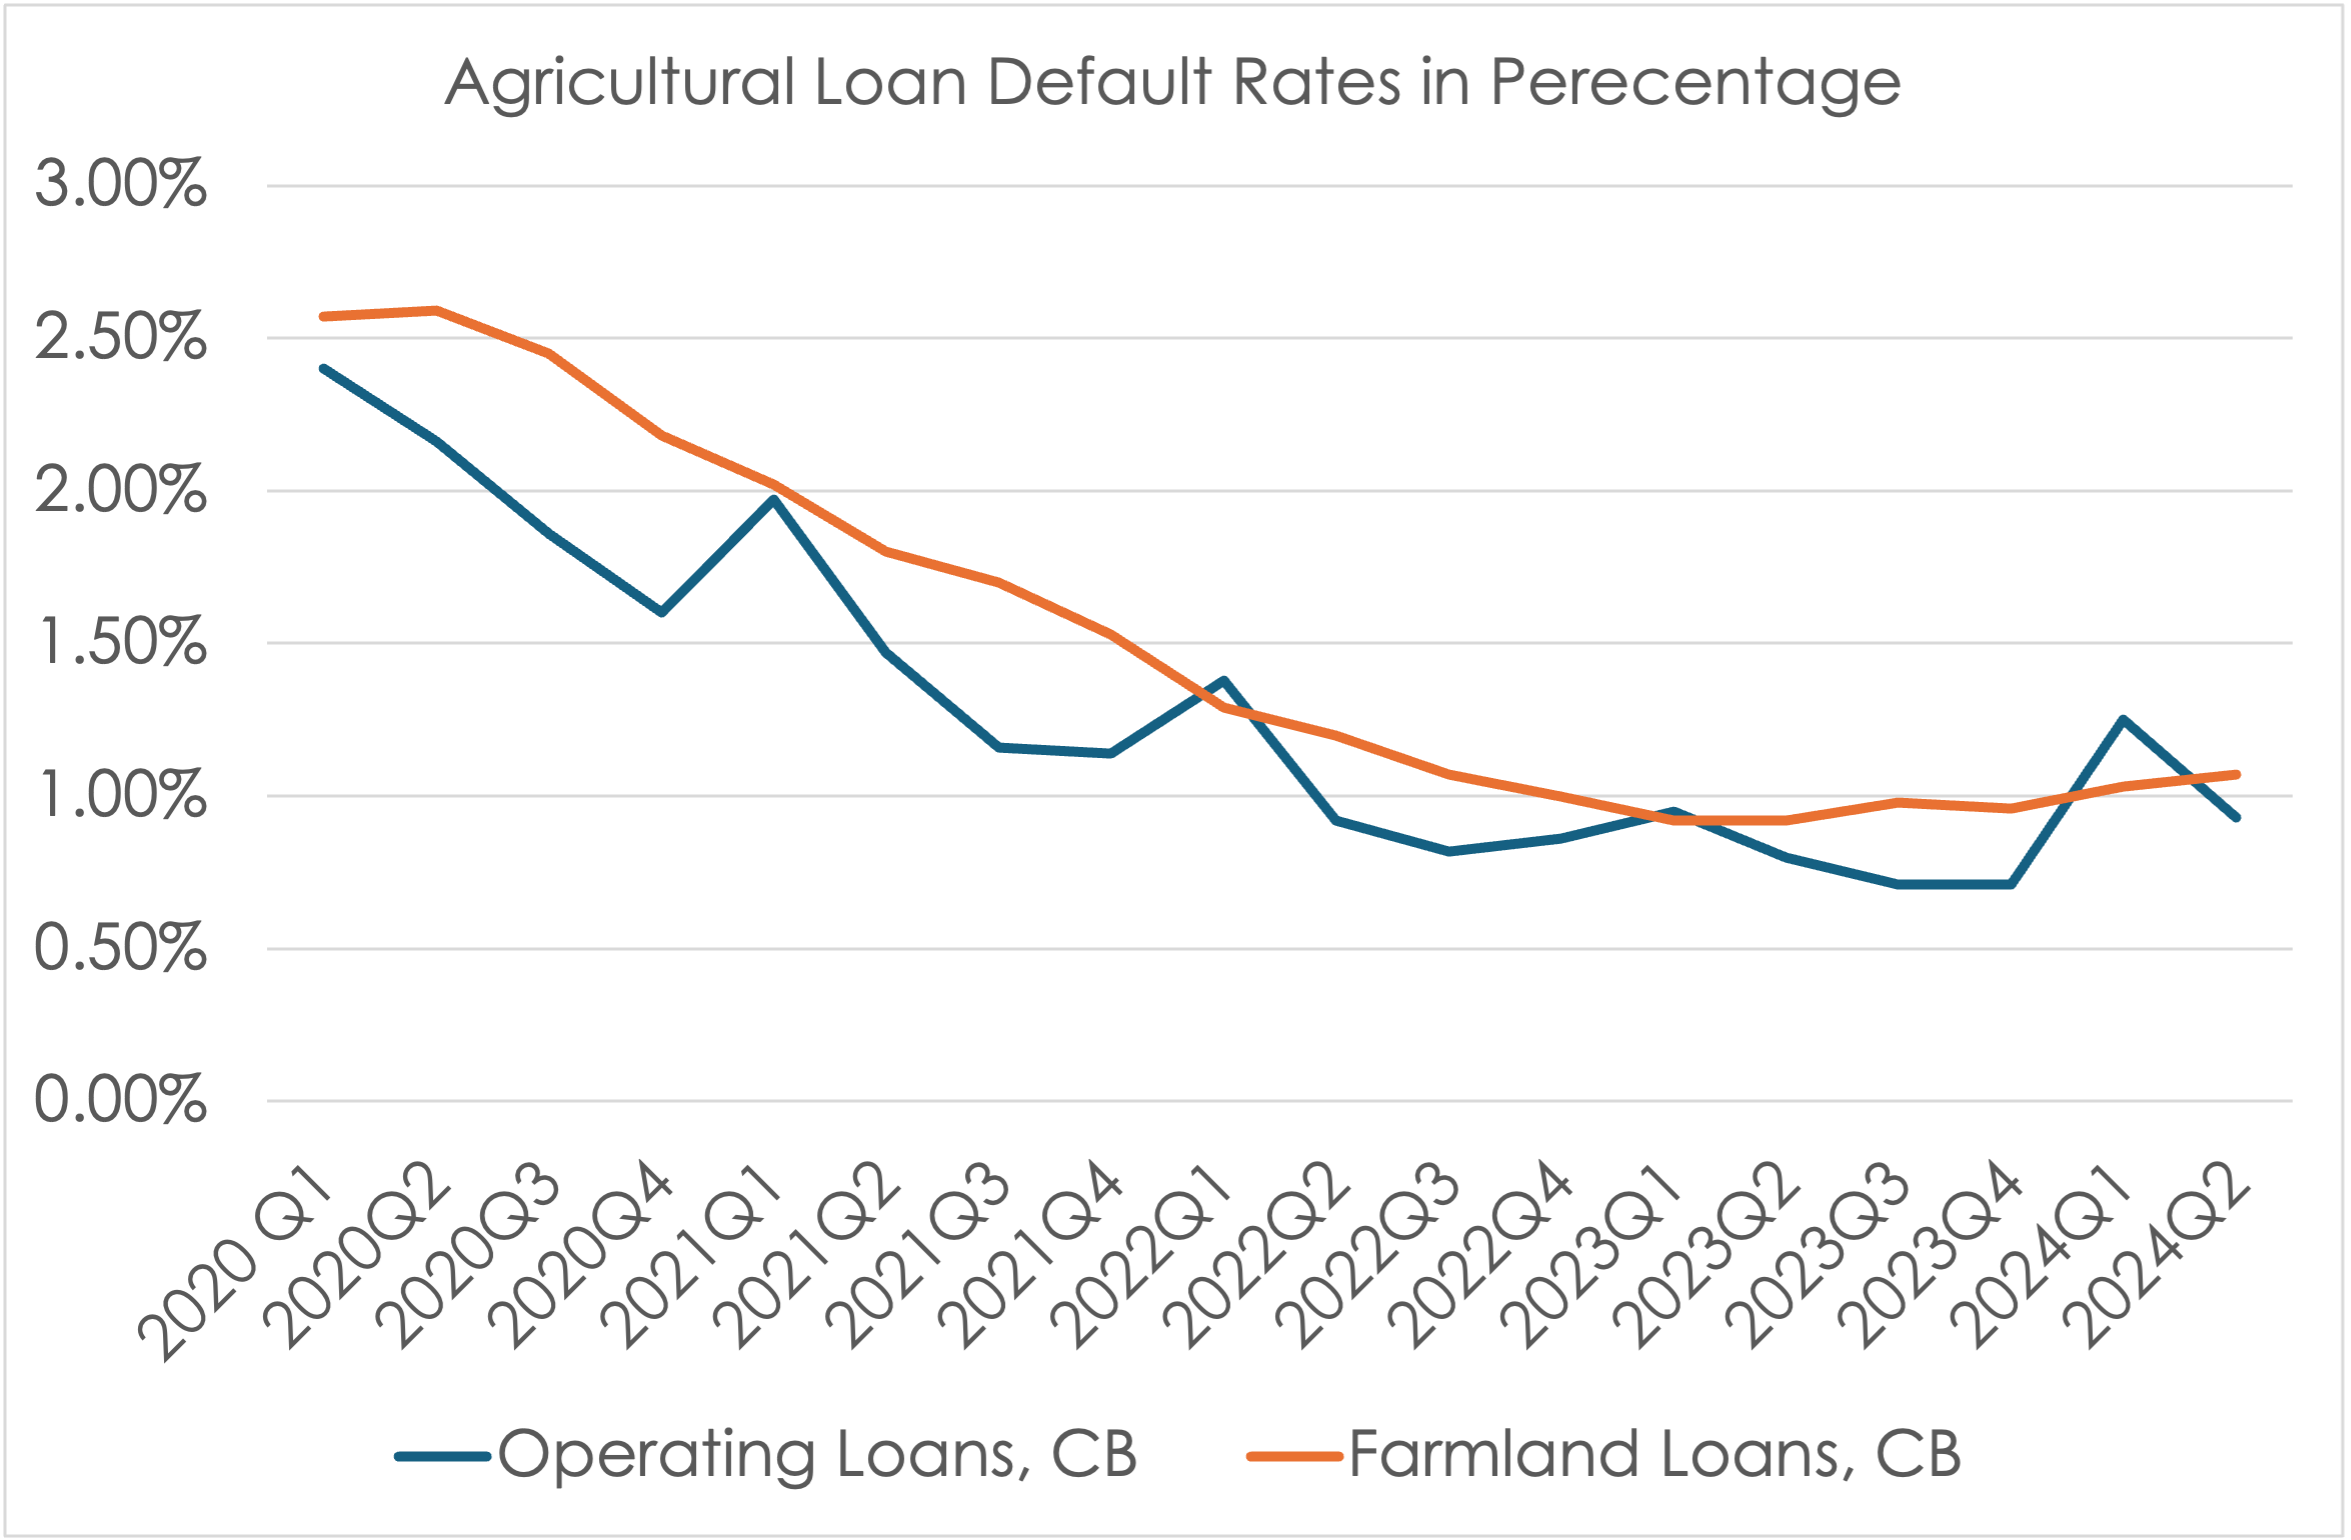
    A recent survey of agricultural bankers supports this observation, indicating rising financial stress among agricultural producers. The Agricultural Credit Survey conducted by the Kansas City Fed reveals that more agricultural lenders are receiving requests for loan renewals and extensions, a sign that producers are struggling to meet loan interest and principal payments. However, beyond these requests, there is currently no clear evidence that financial pressures are translating into widespread farm financial distress. According to the Federal Reserve Economic Data (FRED), default rates on agricultural production loans and farmland loans have not shown significant increases in the latest survey.

    Source: FRED

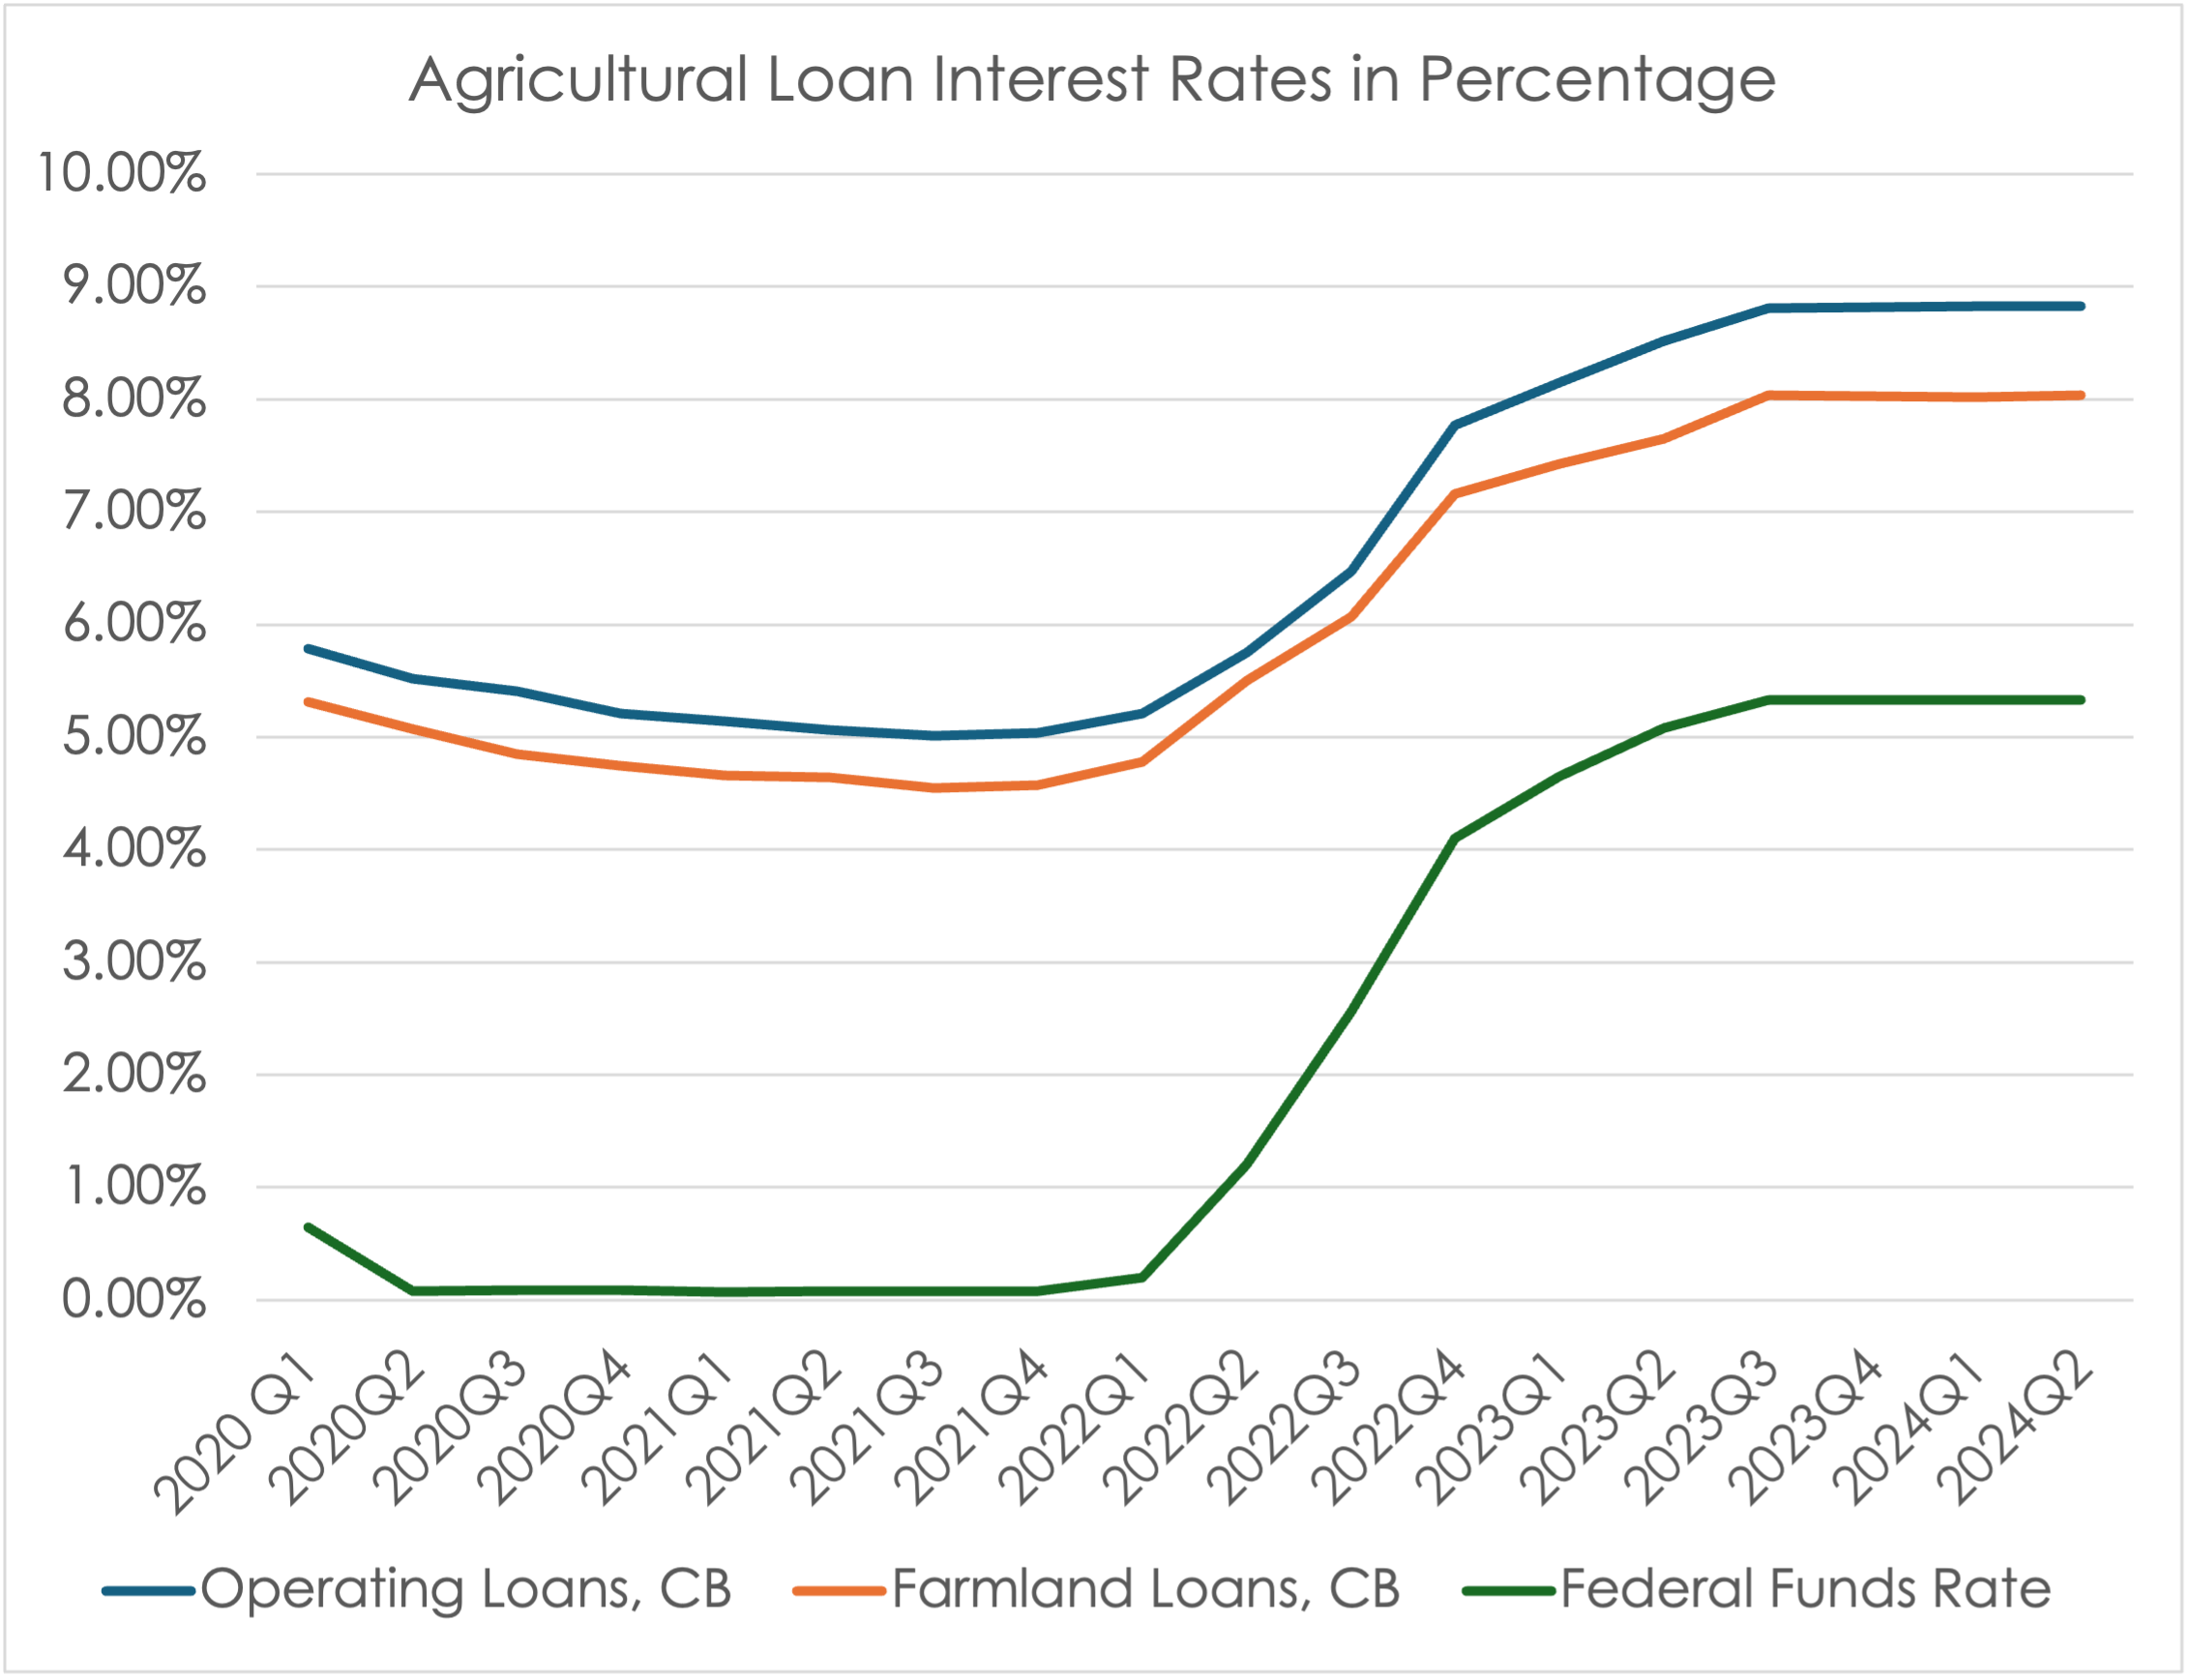
    One contributing factor to the pressure felt by both agricultural producers and consumers is the rise in interest rates. Compared to the rates offered from 2020 to 2022, interest rates on farm production loans and farmland loans have increased sharply following a series of rate hikes by the Federal Reserve (the Fed) aimed at curbing rapidly rising inflation. As the Fed raised the federal funds rate—used as a benchmark for determining consumer loan interest rates—farm loan interest rates also rose, leading to greater pressure on repayment schedules. In the most recent survey of bankers in the Kansas City Federal district, the average farm production loan interest rate was 8.83%, and the farmland loan interest rate was 8.04%. In the same quarter of 2021, these rates were about 5.04% and 4.57% respectively. While 2020 or 2021 rates were very favorable rates in comparison to the long-term average, rapidly increasing interest rates in such a short period of time in 2022 could have put extra financial pressure on some producers who were not prepared for such rapid change.

    Source: Kansas City Fed, FRED

    However, as observed in September 2024, multiple reductions in interest rates are expected in the coming months and years. The Fed aims to lower the federal funds rate to 3.5% by the end of 2025 and to 3% by the end of 2026. Given that the pace of these rate reductions is expected to be slower than the hikes experienced in 2022 and 2023, the anticipated decreases in farm loan interest rates are also likely to be gradual.


    Kim, Kevin. “2024 Agricultural Lending Condition Update.Southern Ag Today 4(43.1). October 21, 2024. Permalink

  • Post-Emergent Dicamba Likely Unavailable in 2025, Controversial Beyond Then

    Post-Emergent Dicamba Likely Unavailable in 2025, Controversial Beyond Then

    In February, a federal district court in Arizona vacated the only three post-emergent formulations of dicamba on the marketplace, marking the second time post-emergent dicamba registrations were vacated since their 2017 commercialization.  When the EPA subsequently clarified that existing stocks of post-emergent dicamba could be used in 2024, all eyes promptly turned to what would be available in 2025.

    The court opinion noted that the EPA failed in its 2020 registrations of post-emergent dicamba to provide a public notice and comment period.  To avoid a third potential vacatur of registrations, the EPA required a public notice and comment period, which in prior registration efforts signaled the start of a 17-month countdown to approval.  

    However, there has been a growing trend of courts scrutinizing and even vacating other pesticide registrations when the EPA failed to comply with requirements associated with the Endangered Species Act (ESA) in addition to requirements associated with the Federal Insecticide, Fungicide, and Rodenticide Act (FIFRA).  Combining the potential need for an ESA consultation with the United States Fish and Wildlife Service (USFWS) with agency funding issues, it is ambitious to hope that the EPA will meet the 17-month approval timeframe on the undergoing post-emergent dicamba registrations before the 2025 planting and growing seasons.

    Commentators on both sides of the dicamba debate have already started making their voices heard.  The public comment period for Bayer’s XtendiMax, BASF’s Engenia, and Syngenta’s Tavium generated over 27,000 comments in total.

    Advocates of post-emergent dicamba products were dismayed by the XtendiMax label not having any on-label uses for post-emergent soybeans.  XtendiMax for cotton allowed applications through June 30.  There was also concern that the labels for Tavium and Engenia only permitted over-the-top (OTT) applications through June 12 or until the crop reaches the V2 growth stage, with comments noting that the plants are still very small at that stage.  

    It is worth noting that, though the 2020 registrations of post-emergent dicamba products were vacated, the EPA’s new position that precludes state agency restrictions on pesticides through Section 24(c) of FIFRA is still maintained on the EPA’s website.  In other words, barring state action through Section 24(a), the EPA will still be the entity responsible for setting restrictions such as application cutoff dates.

    Critics of post-emergent dicamba once again expressed their frustration that the EPA was in the process of re-registering the herbicide.  These individuals and groups have repeated their calls that the product was inherently dangerous and stated that the new formulations were no different than previous products that had been taken off the market.  

    If post-emergent dicamba is not approved for use by the 2025 growing season, there is also a fear that a repeat of the 2015 and 2016 growing seasons will occur.  In 2015 and 2016, the USDA had approved dicamba-tolerant seeds but the EPA was still undergoing the registration process for post-emergent versions of dicamba.  Despite this, dicamba drift symptoms started to occur throughout the nation, leading many to speculate that some producers had used pre-emergent dicamba in an off-label use for post-emergent applications.  


    Brown, Nicholas. “Post-Emergent Dicamba Likely Unavailable in 2025, Controversial Beyond Then.” Southern Ag Today 4(42.5). October 18, 2024. Permalink