Blog

  • Increase in Cost of Production Contributing to Trade Deficit

    Increase in Cost of Production Contributing to Trade Deficit

    In previous Southern Ag Today articles, the rising agricultural trade deficit was reported.  The latest USDA Outlook for U.S. Agricultural Trade report (August), forecast a $30.5 billion trade deficit for FY 2024 with exports at $173.5 billion and imports at $204 billion (Kenner et al., 2024).  Moreover, for FY 2025, USDA forecast an even larger trade deficit at $42.5 billion with exports at $169.5 billion and imports at $212 billion. As mentioned in previous articles, when we measure trade in volume the U.S. enjoys a 3.2 export to import ratio over the last 10 years, meaning that the U.S. exports more than three times the volume that we import.  The reason is that we tend to export products that are sold in bulk, such as soybeans, corn and wheat and we import more high value agricultural and food products such as beer, wine, spirits and fresh fruits and vegetables.

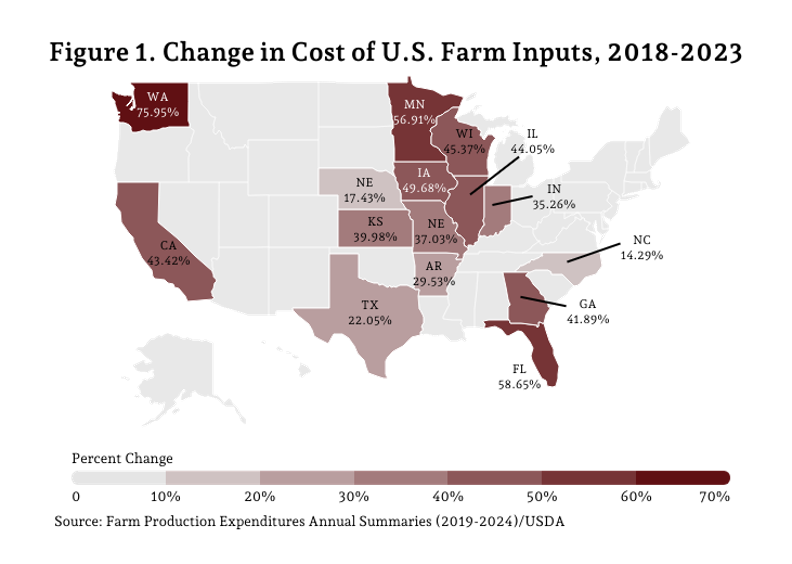
    One of the main contributors to the loss of competitiveness of U.S. agricultural products in the international arena is the increase of cost of production. Figure 1 shows how the cost of farm inputs has risen in recent years. In 2018, U.S. farmers spent a total of $354 billion on inputs, however, by 2023 farmers spent $481.9 billion, an increase of 36 percent. Southern states (categorized by the USDA to include Alabama, Arkansas, Florida, Georgia, Louisiana, Mississippi, and South Carolina) together saw farm inputs rise 37.65% over this time. The inputs purchased by these seven states accounted for 10.4 percent of the total for the United States.  Texas, grouped into the Plains region, accounted for 6.35 percent of the U.S. total. Of the southern states, Florida experienced the highest rise in cost of inputs during this time, increasing 58.65 percent from 2018 to 2023. 


    Ribera, Luis, and Landyn Young. “Increase in Cost of Production Contributing to Trade Deficit.” Southern Ag Today 4(42.4). October 17, 2024. Permalink

  • Recap of the October WASDE for Grains and Soybeans

    Recap of the October WASDE for Grains and Soybeans

    Updates in the October 2024 WASDE continued the overall fundamental market conditions in grains and soybeans (Table 1). Compared to the 2023/2024 marketing year, the factors of supply are increasing more than the factors of demand in 2024/2025. That results in an increase in the stocks-to-use ratio, measured here as estimated days of use on hand at the end of the marketing year [= ending stocks divided by (total use divided by 365)].  The days of use on hand measures how long we could get by next year on the crop that is left over from this year.  An increase in the number of days of use on hand indicates a larger supply cushion in case of a production shortfall, which puts downward pressure on prices. 

      Table 1. WASDE: U.S. Supply and Demand

    Focusing more specifically on each commodity:

    Corn. USDA increased the national average corn yield this month from 183.6 bushels per acre in September to 183.8, an all-time record high. The biggest changes to the supply and demand balance sheet came from increases in use in old crop, lowering the beginning stock number for the 2024/25 marketing year by 52 million bushels. Domestic use categories in new crop corn were unchanged, but USDA increased exports by 25 million bushels. 

    World corn ending stocks were down slightly as the 1.6 million metric ton (mmt) increase in supply was exceeded by a 3.5 mmt increase in use. 

    While the supply and demand numbers for corn were mostly neutral, the increase in use is a bullish sign. 

    Wheat. The numbers for wheat in the October WASDE reflect crop information in the September Small Grains Summary: a small decrease in planted acres and yield. These changes lowered production slightly but were largely offset by an increase in imports.  The only change in use was an increase of 10 million bushels for feed.  

    Only minor changes were made to estimates of world wheat supply and demand: supply down 1.9 mmt; use down 2.4 mmt; and ending stocks up 0.5 mmt.  

    The report was slightly bullish for U.S. wheat with a small decrease in estimated ending stocks and a reduction in the days of use on hand at the end of the marketing year, down from a 154-day supply last month to 150. But the U.S. only accounts for 7% of the world wheat supply. The stocks-to-use ratio for world wheat this month was higher.   

    Rice. Rice numbers were little changed this month, with a small increase in yield increasing supply and ending stocks. 

    World rice production is up 3.1 mmt this month primarily due to an increase in India. The largest rice exporter in the world, India’s rice exports increased from 18.0 mmt last month to 21.0 mmt. This is the second highest rice export number for India, just below the record 22.0 mmt in 2021/2022.  

    The report was neutral for U.S. rice supply and demand but bearish overall given the increase in foreign rice production with little change in use. 

    Soybeans. The national average soybean yield was lowered by 1/10th of a bushel to 53.1, still a record high. Along with this small change in production was a small increase in beginning stocks and small decrease in use. Ending stocks were unchanged. 

    The world soybean balance sheet was mostly unchanged: supply down 0.2 mmt; use down 0.3 mmt; and ending stocks up 0.1 mmt.

    With virtually no changes to U.S. or world supply and demand numbers, the October WASDE was fundamentally neutral for soybeans. 


    Welch, J. Mark. “Recap of the October WASDE for Grains and Soybeans.
    Southern Ag Today 4(42.3). October 16, 2024. Permalink

  • Almost Time to Think Turkey

    Almost Time to Think Turkey

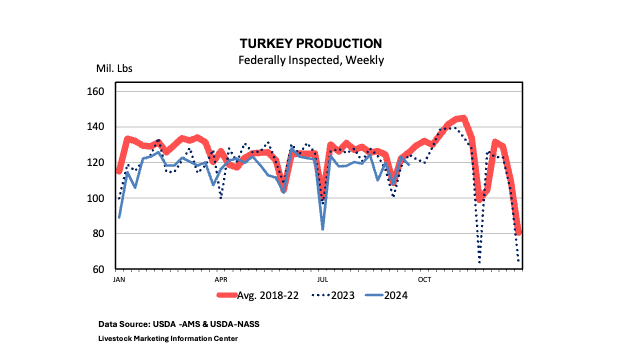
    We are six weeks away from 2024 Thanksgiving but it’s not too early to think about the meals that may include turkey. Here is some pertinent turkey information as we are preparing for the end of the year celebrations. One of the first considerations is production, a key part of turkey supplies. The 2024 federally inspected turkey production (weekly), is shown in Figure 1. Year to date, turkey production is running 3.29% below 2023 levels and 6.44% less than the five-year average (2018 – 2022). While lower production is usually a cause for price concerns, that is not likely to be the case this year as turkey prices have remained lower than 2023 throughout 2024.

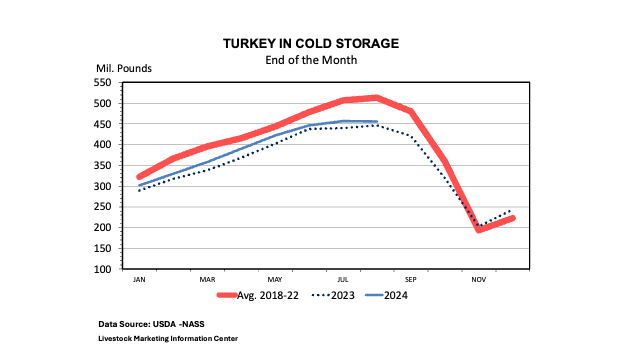
    Turkey in storage is another important consideration in turkey supplies for Thanksgiving and Christmas holidays. As seen in the in Figure 1, turkey processing occurs throughout the year with an increase in late October and early November. Cold storage is important in managing the supply of turkeys and to ensure that adequate supplies are available for the end of the year demand. Figure 2 indicates that all turkey in cold storage for 2024 is 2.1 percent higher than in 2023, but 8.9 percent less than the 2018 -2022 average. Digging a little deeper in the cold storage data indicates that while there are 1.1 percent fewer tom turkeys, whole hens in cold storage are up 4.4 percent.  

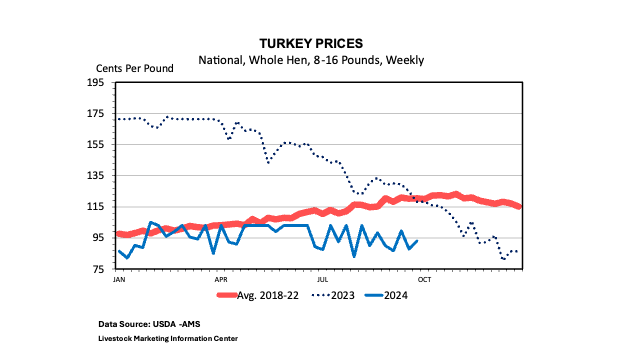
    With 2024 turkey production running only slightly lower than last year’s production and quantities of frozen turkey in cold storage above 2023 levels, what will that mean for turkey prices in 2024?  The 2024 fourth quarter wholesale price projection for an 8 – 16 pound frozen turkey hen is forecast to be $0.95 cents per pound, wholesale. This is 5.75 % less than 2023 prices ($1.01) and 47% less than fourth quarter prices ($1.78 ) in 2022. Like usual, there will be plenty of turkeys for Thanksgiving dinner.  But, you might look for deals and specials and shop early to make sure you get just the right bird for your holiday table. In conclusion, it’s looks to be a good year to enjoy turkeys for the holidays.  

  • When is an Hour of Operator Labor, Not Just an Hour of Operator Labor?

    When is an Hour of Operator Labor, Not Just an Hour of Operator Labor?

    As an Extension Economist, I regularly have the opportunity to talk about cow-calf profitability. I usually start with revenues, talking about calf prices and making assumptions about weaning weight and weaning rate. Then I walk through costs like winter feed (hay), pasture maintenance, breeding, vet/medicine, trucking, sale expenses, etc. While there is always room for discussion, most of these expenses can be estimated on a “per cow” basis by making some reasonable assumptions. At some point in the discussion, I bring up the topic of labor. Some cow-calf operations hire a significant amount of labor, but for a lot of these operations, the majority of labor is unpaid operator labor.

    The classic economist approach to valuing unpaid labor is to value it at its opportunity cost. By that, I mean if the farmer could be making $20 per hour doing something else, their labor on the farm should be valued at $20 per hour and be treated as an expense. On the surface, it’s hard to argue with this logic, but it is also not the way that most farmers think about the value of their time. For this reason, I tend not to treat labor as an expense but instead make the point that any return must be sufficient to adequately compensate the operator for the time they spend. This allows each individual in the room to evaluate whether that return is sufficient and place whatever value they feel is appropriate on their time.

    One danger of this approach is that it may encourage ignoring other expenses that often accompany operator labor. To illustrate this, consider two very different operator labor hours – an hour spent manually clearing fence rows and an hour spent on a tractor baling hay. A producer clearing fence rows may be using a set of loppers to cut small saplings, they may have a smaller set of clippers for briars and weeds, and they may even have a chainsaw they use on occasion when needed. An overly eager economist could talk about depreciation on that chainsaw and the other equipment, as well as the fuel being used when the chainsaw is operating, but clearly, these costs are pretty minimal. The point here is that the vast majority of the cost associated with an hour clearing fence rows is time.

    On the contrary, time is a much smaller portion of the total cost of an hour spent baling hay. Beyond the hour of labor, the producer baling hay is running both a tractor and hay baler. Fuel costs are much more significant, as is depreciation on both pieces of equipment. The same can be said of maintenance and repairs associated with the additional use of the equipment. Choosing not to place a value on an hour spent clearing fences is one thing, but not placing a value on time spent baling hay is very different. Obviously, I am describing two extremes here, but hopefully, it helps to illustrate the point I am making. Sometimes an hour of operator labor is not just an hour of operator labor, especially if there are a lot of other expenses being incurred during that hour.

    My experience has been that most farmers prefer time spent running machinery over time spent doing more manual labor. In fact, many producers would readily trade manual labor hours for more machinery hours. Cleaning out fence rows on a hot day is tough work, but the expense beyond the value of the time spent is minimal. Conversely, that same hour spent baling hay comes with a lot of additional expenses beyond the value of that time. The point is that choosing not to value operator labor is the choice of the farmer, but that farmer still needs to make sure they are valuing other costs incurred during those operator labor hours. Failing to do so has the potential to greatly underestimate the total costs for the operation.


    Burdine, Kenny. “When is an Hour of Operator Labor, Not Just an Hour of Operator Labor?Southern Ag Today 4(42.1). October 14, 2024. Permalink

  • Will the U.S. Supreme Court Be Asked to Send EPA Back To the Drawing Board on CAFO Permits?  

    Will the U.S. Supreme Court Be Asked to Send EPA Back To the Drawing Board on CAFO Permits?  

    Postscript:  After this article was completed and while waiting to be published, the Ninth Circuit Court of Appeals rendered a decision on October 2, 2024, upholding the EPA’s decision to deny the plaintiff environmental groups’ petition to compel revised CAFO regulations. A request for the granting of an appeal to the U.S. Supreme Court must be filed within 90 days of October 2, 2024.

    Note: This article is a continuation of a topic first discussed in an article published on March 15, 2024, titled, “EPA Made Commitment to CAFO Permitting Reform But No Action Evident to Date.” 

    There have been significant developments in the last six months since Southern Ag Today first published an article outlining: 

    1. the United States Environmental Protection Agency’s (“EPA”) announcement of an internal “comprehensive evaluation” of its Clean Water Act (“CWA”) NPDES permit regulations for confined animal feeding operations (“CAFO”) for potential agency initiation of reforms; and 
    2. a lawsuit captioned, Food & Water Watch, et al. v. EPA, No. 23-2146, pending in the U.S. Court of Appeals for the Ninth Circuit, seeking NPDES CAFO permit reform through court intervention and order. 

    At issue is EPA’s continued use and implementation of a regulatory scheme defining NPDES permit obligations by reference to species-specific animal equivalency units (“AEU”) housed on site—resulting in the now familiar CAFO classifications as Large, Medium and Small, each carrying varying obligations, or none at all. Notably, the CWA contains no definition of a CAFO, which statutorily must be regulated as a point source discharge under the NPDES permit system. EPA uses those classifications to implement and enforce the law in substitution for measurement or monitoring of discharges. EPA’s regulatory scheme is based entirely upon an agency interpretation, not one found in the law. 

    1. EPA internal CAFO Permitting Reform Process

    EPA has begun its internal assessment of NPDES CAFO permitting reform in earnest with:

    It has been slightly more than one year since EPA announced its internal CAFO Reform effort, and its parameters. EPA included its plan within two August 15, 2023, agency adjudications denying administrative petitions filed by Food & Water Watch and others challenging the continued legal efficacy of the current NPDES CAFO permit regulations. Despite fifteen years of use (last revised in 2008) the petitioners argue that the regulations fail to conform to CWA statutory authority and purposes. It is a relatively safe assumption that this process will likely continue at a slow pace. 

    1. Litigation on its way to the U.S. Supreme Court?  

    Meanwhile, Food & Water Watch, and the other petitioners, appealed the August 15, 2023, denial of those two petitions to the Ninth Circuit Court of Appeals in Food & Water Watch, et al. v. EPA, No. 23-2146.  That case has now completed:

    • All Briefs have been filed by the parties. 
    • September 12, 2024: Oral argument conducted (view recording). 

    Oral argument is a difficult predictor of an outcome, but questioning during oral argument by the Ninth Circuit panel of 3 judges appeared to be more sympathetic to EPA’s arguments. That is not surprising based upon the heretofore poor track record of success of administrative petitions seeking to force regulation changes.  

    Nevertheless, the most important thing about the pending appeal is that the U.S. Supreme Court is the next available appeal. Whichever party receives an adverse ruling, in whole or in part, the outcome at the Ninth Circuit will almost certainly result in a request to the U.S. Supreme Court to grant an appeal and review the legal issue of whether current EPA NPDES CAFO permit regulations should stand as-is, be declared invalid and remanded to EPA for further action, or some permutation of those outcomes as applied to individual provisions.  

    The current U.S. Supreme Court has illustrated its interest in becoming involved in cases where it perceives an administrative agency has overstepped its statutory bounds in promulgating regulations and/or has made interpretations not directly supported by the statute on how to fulfill its statutory duties to implement and enforce a statute.

    That willingness has been illustrated in full flower in the well-known recent decisions in both Sackett et ux. v. EPA et al., No. 21-454 (reversing EPA’s regulatory scheme for interpreting the statutory term “waters of the United States” (“WOTUS”) under the Clean Water Act) and Loper Bright, et al., v. Raimondo, et.al, No. 22-451 (no longer granting any deference to administrative agency interpretation of how to implement and enforce a regulation when faced with a statute containing an ambiguity).    

    Before the U.S. Supreme Court granted an appeal of the Circuit Court of Appeals outcome in the Sackett case in 2022, few, if any, legal observers would have pegged that relatively obscure litigation as the future vehicle for a monumental overhaul of the WOTUS definition in federal law. 

    Will this case be the next unlikely vehicle for groundbreaking U.S. Supreme Court intervention in administrative agency regulatory practice?  


    Duer, Brook, and Paul Goeringer. “Will the U.S. Supreme Court Be Asked to Send EPA Back to the Drawing Board on CAFO Permits?Southern Ag Today 4(41.5). October 11, 2024. Permalink