Blog

  • Shifting Winds: The Changing Landscape of Cotton Production and Exports in the U.S. and Brazil (Part 2)

    Shifting Winds: The Changing Landscape of Cotton Production and Exports in the U.S. and Brazil (Part 2)

    In Part 1, we examined the importance of international markets for cotton growers amid a significant decline in U.S. cotton processing capacity. Since 1995, U.S. cotton mill use has plummeted by 84%, reaching 1.85 M bales in the 2023 crop season—the lowest level in over a century. During this period, Brazil’s production surged, enabling it to surpass the U.S. in cotton exports. In this second part, we briefly analyze yield and production trends in both countries, exploring their potential impact on future exports.

    After the World Trade Organization (WTO) Agreement on Textiles and Clothing (ATC) came into effect in 1995, U.S. cotton production averaged 17.1 million bales annually. For the 2024/25 crop season, the USDA estimates production at 14.5 million bales (Fig. 1), reflecting an improvement over the past two years. However, untimely rains have hindered optimal crop development in Texas, the largest cotton-producing state. In 2023, Brazil outpaced the U.S. in cotton production (Fig. 1), with USDA forecasting a harvest of 16.7 million bales for the 2024/25 crop season – nearly nine times the amount produced in 1995. This growth in Brazil is primarily due to land expansion and yield improvements.

    Figure 1 – Cotton Production in the U.S. and Brazil: 1960 – 2024. 

    Notes: ATC: Agreement on Textiles and Clothing. 2024 are estimated values. 
    Source: FAS/USDA/PSD. 

    Brazil’s cotton acreage has expanded by 71% since 1995. Most Brazilian cotton is grown as a double crop, following soybean harvest. Cotton competes for land with corn, allowing farmers to benefit from fiber-food diversification. This year, low corn prices prompted growers to shift more acreage to cotton, resulting in a 16.8% increase in planted area. 

    Post-ATC, Brazil began outperforming the U.S. in cotton yield. Enhanced farming practices and the introduction of transgenic cotton seeds in the late 2000s significantly boosted productivity. Brazilian yield soared from 323.9 lbs./ac in 1995 to 1,705 lbs./ac in 2023 – a fivefold increase. In contrast, U.S. cotton yields have plateaued around 846.5 lbs./ac since 2004 (Fig. 2), a notable achievement considering the challenging weather conditions faced by U.S. producers.  

    Figure 2 – U.S. and Brazil Cotton Yields. 

    Notes: ATC: Agreement on Textiles and Clothing. 2024 are estimated values. 
    Source: FAS/USDA/PSD. 

    Brazil’s soil and climate favor cotton expansion, signaling a promising export future. However, the profitability of second-season corn often influences farmers’ decisions to plant cotton. Expanding cotton beyond traditional areas is limited by the need for specialized infrastructure, such as cotton gins and storage facilities. Moreover, cotton demands more sophisticated technology and a longer growing season than corn, adding climatic risk to production. Despite these challenges, Brazil has made notable progress. In 2023, the country achieved a milestone by exporting cotton to Egypt, showcasing the enhanced quality of its fiber. Additionally, a new export route through the port of Salvador, strategically closer to the key cotton region of western Bahia, was established to alleviate bottlenecks at Santos, Brazil’s main export hub.

    Brazil is poised to contend for the top position in global cotton sales. Preliminary analysis indicates that cotton remains more profitable than corn in the country. Despite narrowing margins for Brazilian cotton producers, a modest increase in acreage is expected for the next cycle. Cotton prices on ICE Futures in New York have fallen by 20% since February, now trading around $0.70 per pound. Meanwhile, the dollar’s 12% appreciation against the Brazilian real has bolstered Brazil’s price competitiveness, mitigating the impact of falling cotton prices in the country. Although recent droughts in the U.S. have curtailed production, Brazil’s surging output has halted the effects on global prices. Monitoring Brazil’s cotton market provides valuable insights into global price trends and affects marketing strategies for Southern U.S. growers.

    References. 

    FAS/USDA/PSD. PSD Data Sets. Retrieved from: https://apps.fas.usda.gov/psdonline/app/index.html#/app/home[Accessed September 18, 2024].


    Cali, Yuri, and Rachel Judd. “Shifting Winds: The Changing Landscape of Cotton Production and Exports in the U.S. and Brazil (Part 2).” Southern Ag Today 4(40.4). October 3, 2024. Permalink

  • Brazil Expected to Continue Dominance of Global Soybean Exports

    Brazil Expected to Continue Dominance of Global Soybean Exports

    As soybean prices for U.S. producers deteriorate, they face fierce competition from greater Brazilian production in the export market. USDA-WASDE projects the 2024/25 average farm price to be down $3.40 from two years ago, at $10.80 per bushel. U.S. soybeans rely heavily on the export market; on average, 47% of U.S. soybeans were exported in the previous five years. For over a decade, Brazil has maintained its position as the world’s largest soybean exporter, and in recent years, it has further expanded its global market share (Figure 1). USDA-WASDE projections for the 2024/25 marketing year estimate Brazil will account for 58% of global soybean exports, with the United States trailing at 28%. The remaining 14% will come from other exporting nations. While Brazil’s share has dipped slightly from last year’s peak of 59%, it continues to dominate the global soybean export market. 

    The U.S. soybean market is facing challenges with Brazil strengthening its position as China’s primary supplier. China has been working to become less dependent on U.S. soybean purchases, and increased production has allowed Brazil to become the preferred trading partner. According to the Foreign Agricultural Service’s Beijing post, in the first nine months of the 23/24 marketing year, the U.S. accounted for 26 percent of China’s soybean imports, compared to 69 percent from Brazil. Reports also indicate that China is dealing with an oversupply of soybeans, as recent high purchases come during subdued feed demand. This fact has hampered sales to China as we enter the peak marketing season for U.S. soybeans. While U.S. sales to China have risen recently, they are still trailing behind last year’s sales and the five-year average. As of the week ending 9/19/24, the total soybean commitments to China totaled 6.8 million metric tons, compared to 7.4 million for the same time last year and the five-year average of 10.6 million.  

                      The export outlook for U.S. soybeans is further complicated by the prospect of low river levels on the Mississippi River, a concern highlighted in last week’s article “Low River Levels on the Mississippi River: Not the Three-peat We Want” (southernagtoday.org). Recent rainfall from Hurricane Helene has improved the river situation, as the Mississippi River at Memphis is expected to rise above the low river threshold. Without a positive shift in the current export scenario, U.S. producers face lower prices as they harvest a record soybean crop. With Brazil now dominating the export market, the potential for price increases this year depends heavily on the progress of Brazil’s soybean planting season. Although Brazil has just entered its planting window, dry conditions in the central region could lead to delays. If drought conditions develop, it could create an opportunity for higher prices for U.S. producers. Current forecasts call for rain over the next couple of weeks, but rainfall remains below normal.  

    Figure 1. Share of Global Soybean Exports by Country, 2010-2025

    Source:  https://apps.fas.usda.gov/psdonline/app/index.html#/app/advQuery

    References 

    United States Department of Agriculture, Foreign Agricultural Service. Oilseeds and Products Update: Beijing, China – People’s Republic of China. CH2024-0116, 2024, https://apps.fas.usda.gov/newgainapi/api/Report/DownloadReportByFileName?fileName=Oilseeds%20and%20Products%20Update_Beijing_China%20-%20People%27s%20Republic%20of_CH2024-0116.


    Maples, William E. “Brazil Expected to Continue Dominance of Global Soybean Exports.Southern Ag Today 4(40.3). October 2, 2024. Permalink

  • Seasonal Price Trends & Inventory

    Seasonal Price Trends & Inventory

    The summer and fall months are when a majority of producers are selling spring-born calves or yearlings from last fall. Due to the increase in supply of calves, prices typically decline during these months as demand from feedlot buyers is more easily met than in the spring. In Florida and nationwide, we started seeing this decline in prices a little earlier (April), which is partly due to the market responding to the outbreak of HPAI H5N1 in dairies, earlier trader’s recession fears, and more fed beef production than last year. However, prices still remained well above 2023 levels. Going into the summer months, as mentioned in a previous SAT article, prices followed the seasonal trend of declining in the summer and fall.

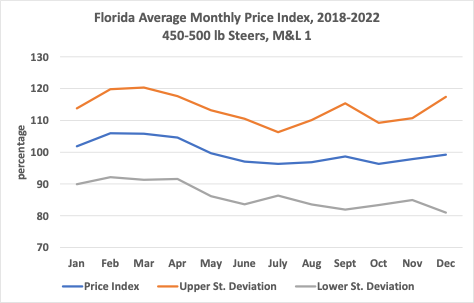
                Figure 1 shows the average monthly price index for 450-500 lb steers in Florida from 2018-2022. This figure is simply a visual to show how we know the current dip in prices is normal for this time of year. The price index (blue line) shows the relationship between each month’s average price and the annual average price. When the price index is above 100%, that means prices in that month, on average, are higher than the annual average, such as in the spring. When the price index is below 100%, that means prices in that month, on average, are lower than the annual average, such as in the fall.   

                Now, Figure 1 only represents 2018-2022, not 2023 when prices were transitioning from a low point to a high point. Figure 2 shows how this transition period did not follow the typical seasonality trend (orange line). Prices continued rising into 2024, but then began falling as previously mentioned and much like we saw in 2015. However, the difference to notice between 2024 and 2015 is inventory levels and the rate of expansion (Figure 3). In 2015, expansion had already started when prices were at the levels we are seeing today. There was no incentive for prices to climb back up after the typical dip in the fall. In the current market, we have not started expanding and have already hit new record-high calf prices. This indicates that while we are experiencing the effects of seasonality this year, it is not expected that we are headed for a continuous low level of cattle prices for quite some time.  

    Figure 1. Average Monthly Price Index for Florida Steer Calves

    Figure 2. Average Monthly Prices for Steer Calves

    Figure 3. Beef Cow Inventory and Monthly Calf Prices


    Baker, Hannah. “Seasonal Price Trends & Inventory.Southern Ag Today 4(40.2). October 1, 2024. Permalink

  • Increase in PRF Adoption in the Southern Region

    Increase in PRF Adoption in the Southern Region

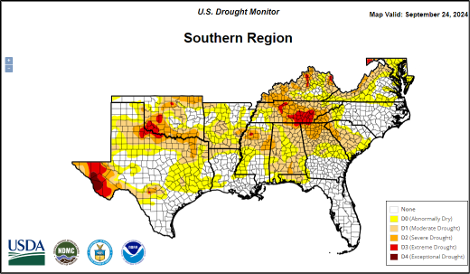
    In recent years, drought has been a common occurrence in many Southern states, including Texas, Oklahoma, Louisiana, Arkansas, Mississippi, Alabama, Florida, Georgia, South Carolina, North Carolina, Virginia, Maryland, Tennessee, and Kentucky. The U.S. Drought Monitor reported that approximately 65% of this area was experiencing some level of drought as of September 24, 2024 (Fig 1).  Producers are increasingly adopting the USDA’s Pasture, Rangeland, and Forage Insurance (PRF), recognizing its crucial role in supporting ranchers during these challenging times.

    Figure 1. U.S. Drought Monitor, Southern Region 9-24-24

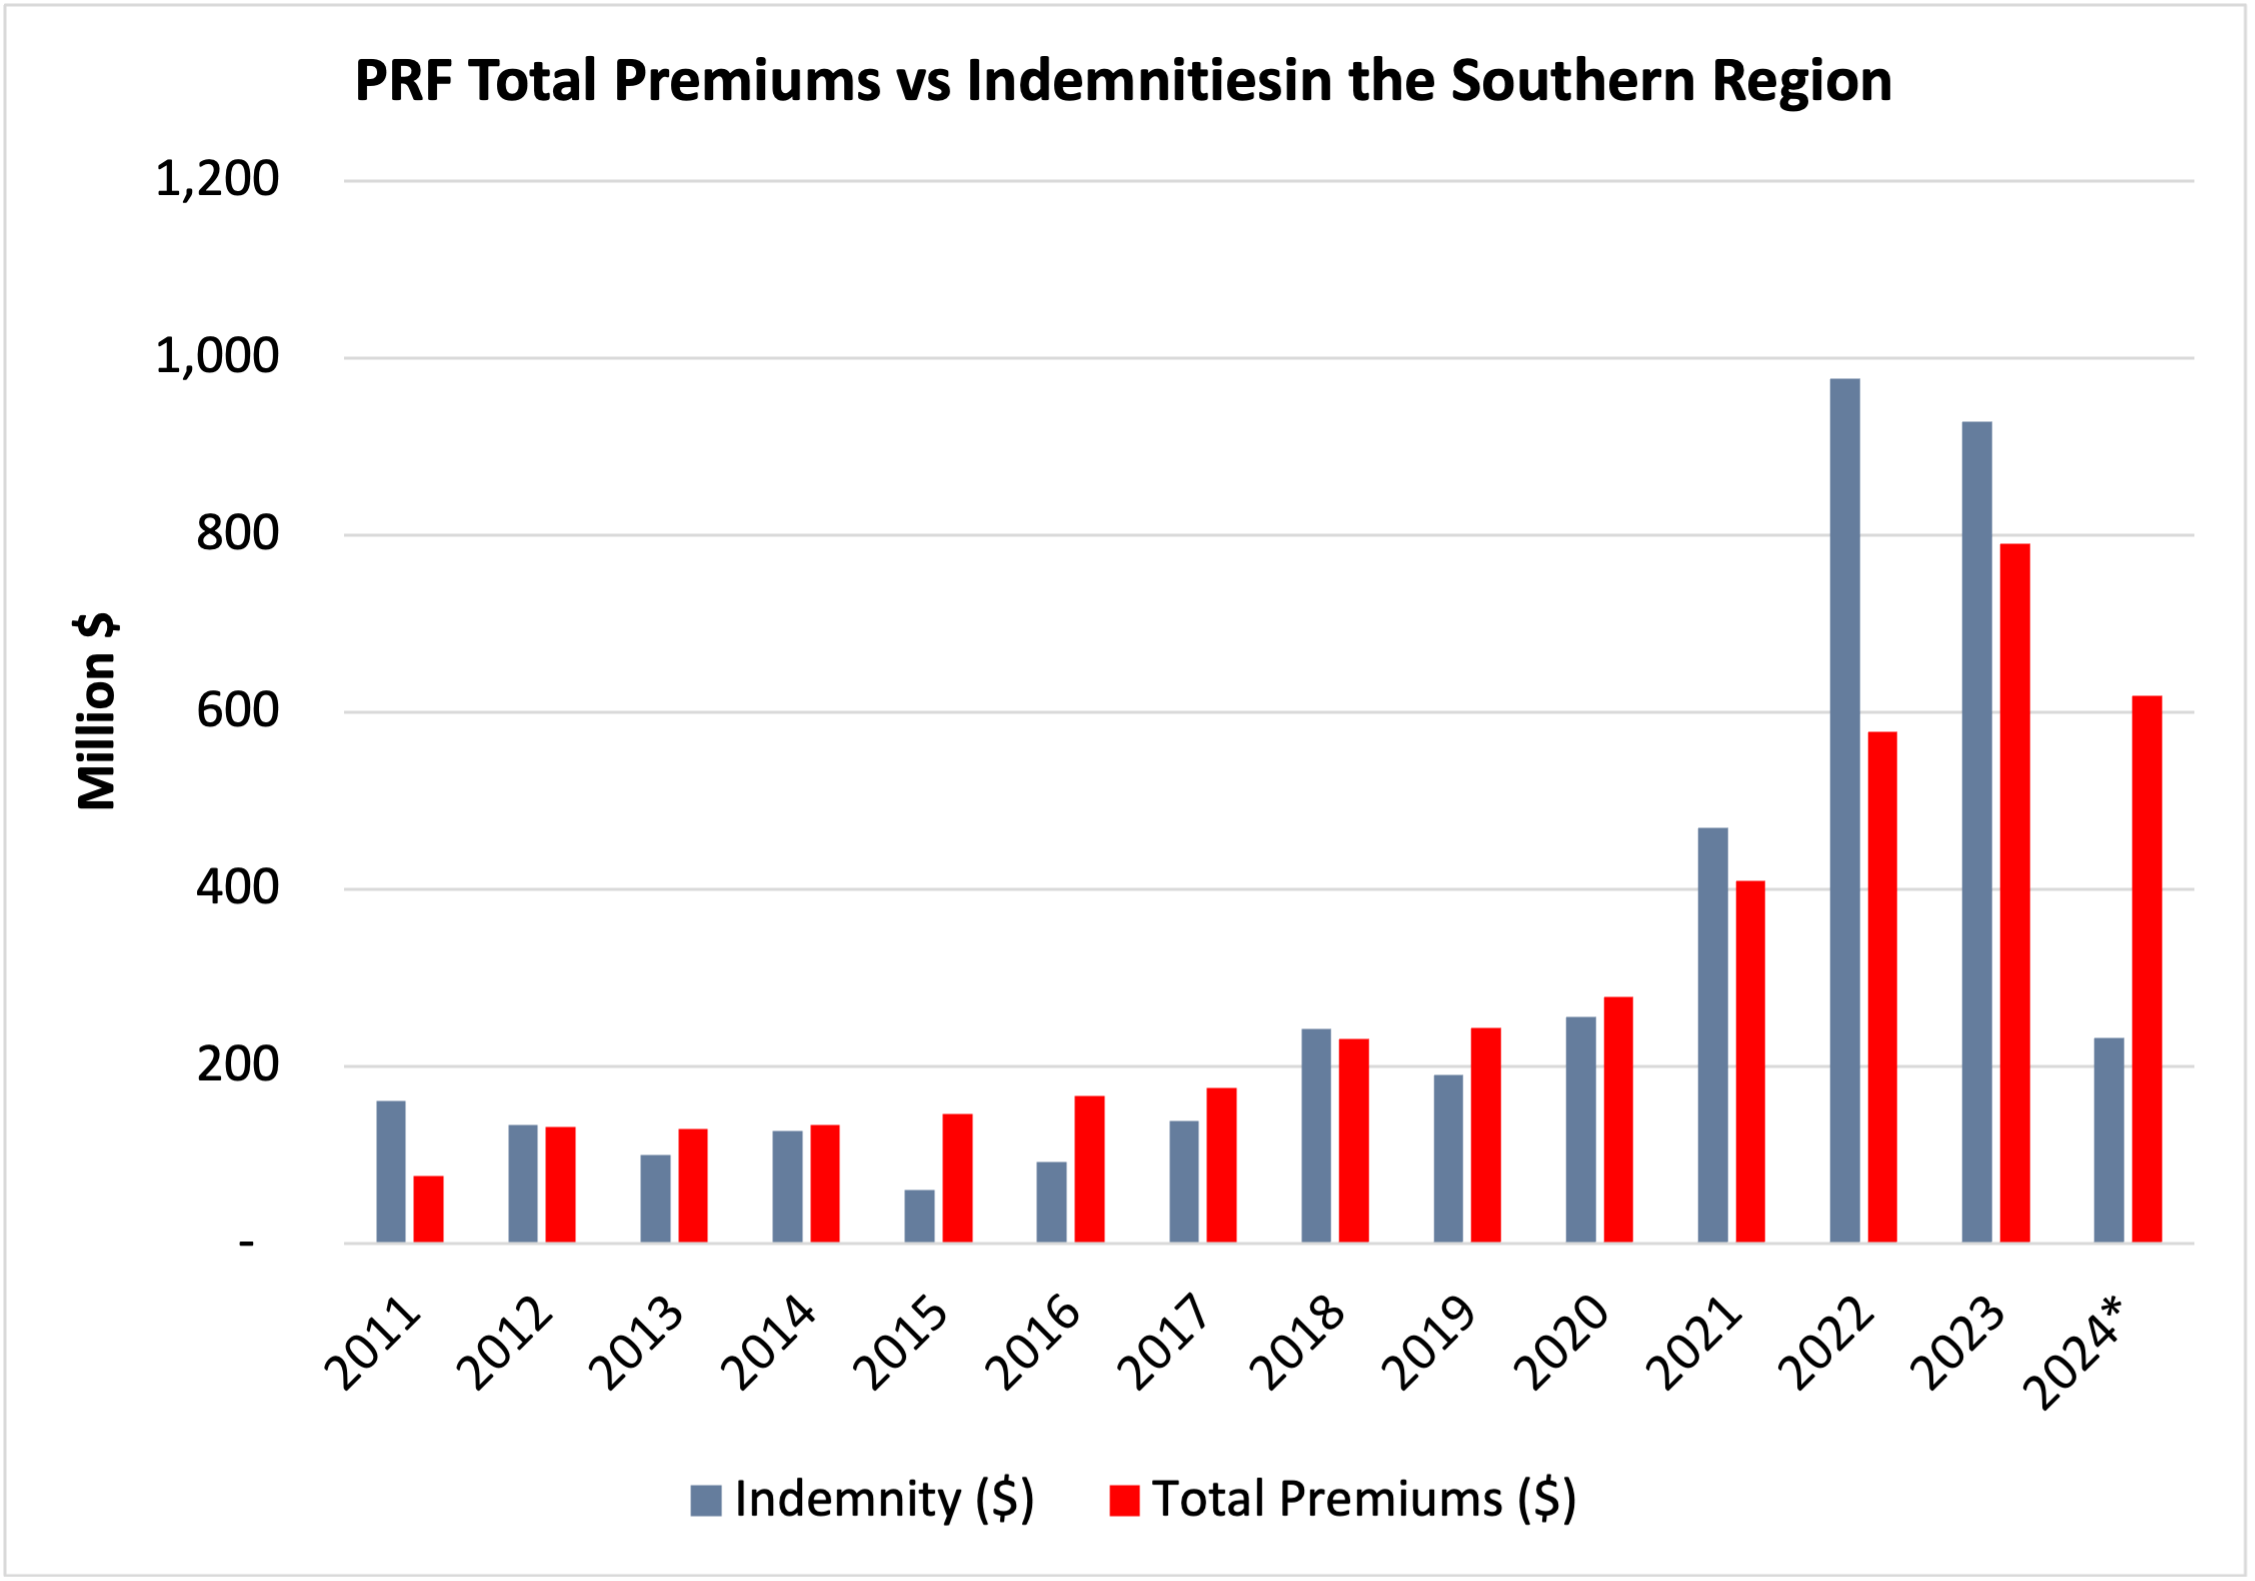
    The PRF program was established in 2007 to help livestock and forage producers mitigate the risks associated with forage loss due to lower precipitation. The program is available in 48 states and covers over 247 million acres. The severity of droughts and the effectiveness of PRF have led to an increasing adoption of this risk management tool each year. According to the latest data, the average indemnity payment since 2011 from the region was similar to total premiums paid. During the droughts of 2021, 2022, and 2023, the indemnities paid were 14%, 69%, and 17% higher than the total premium paid, totaling $2.372 billion in indemnities versus $1.776 billion in total premiums during those three years. (Fig 2)

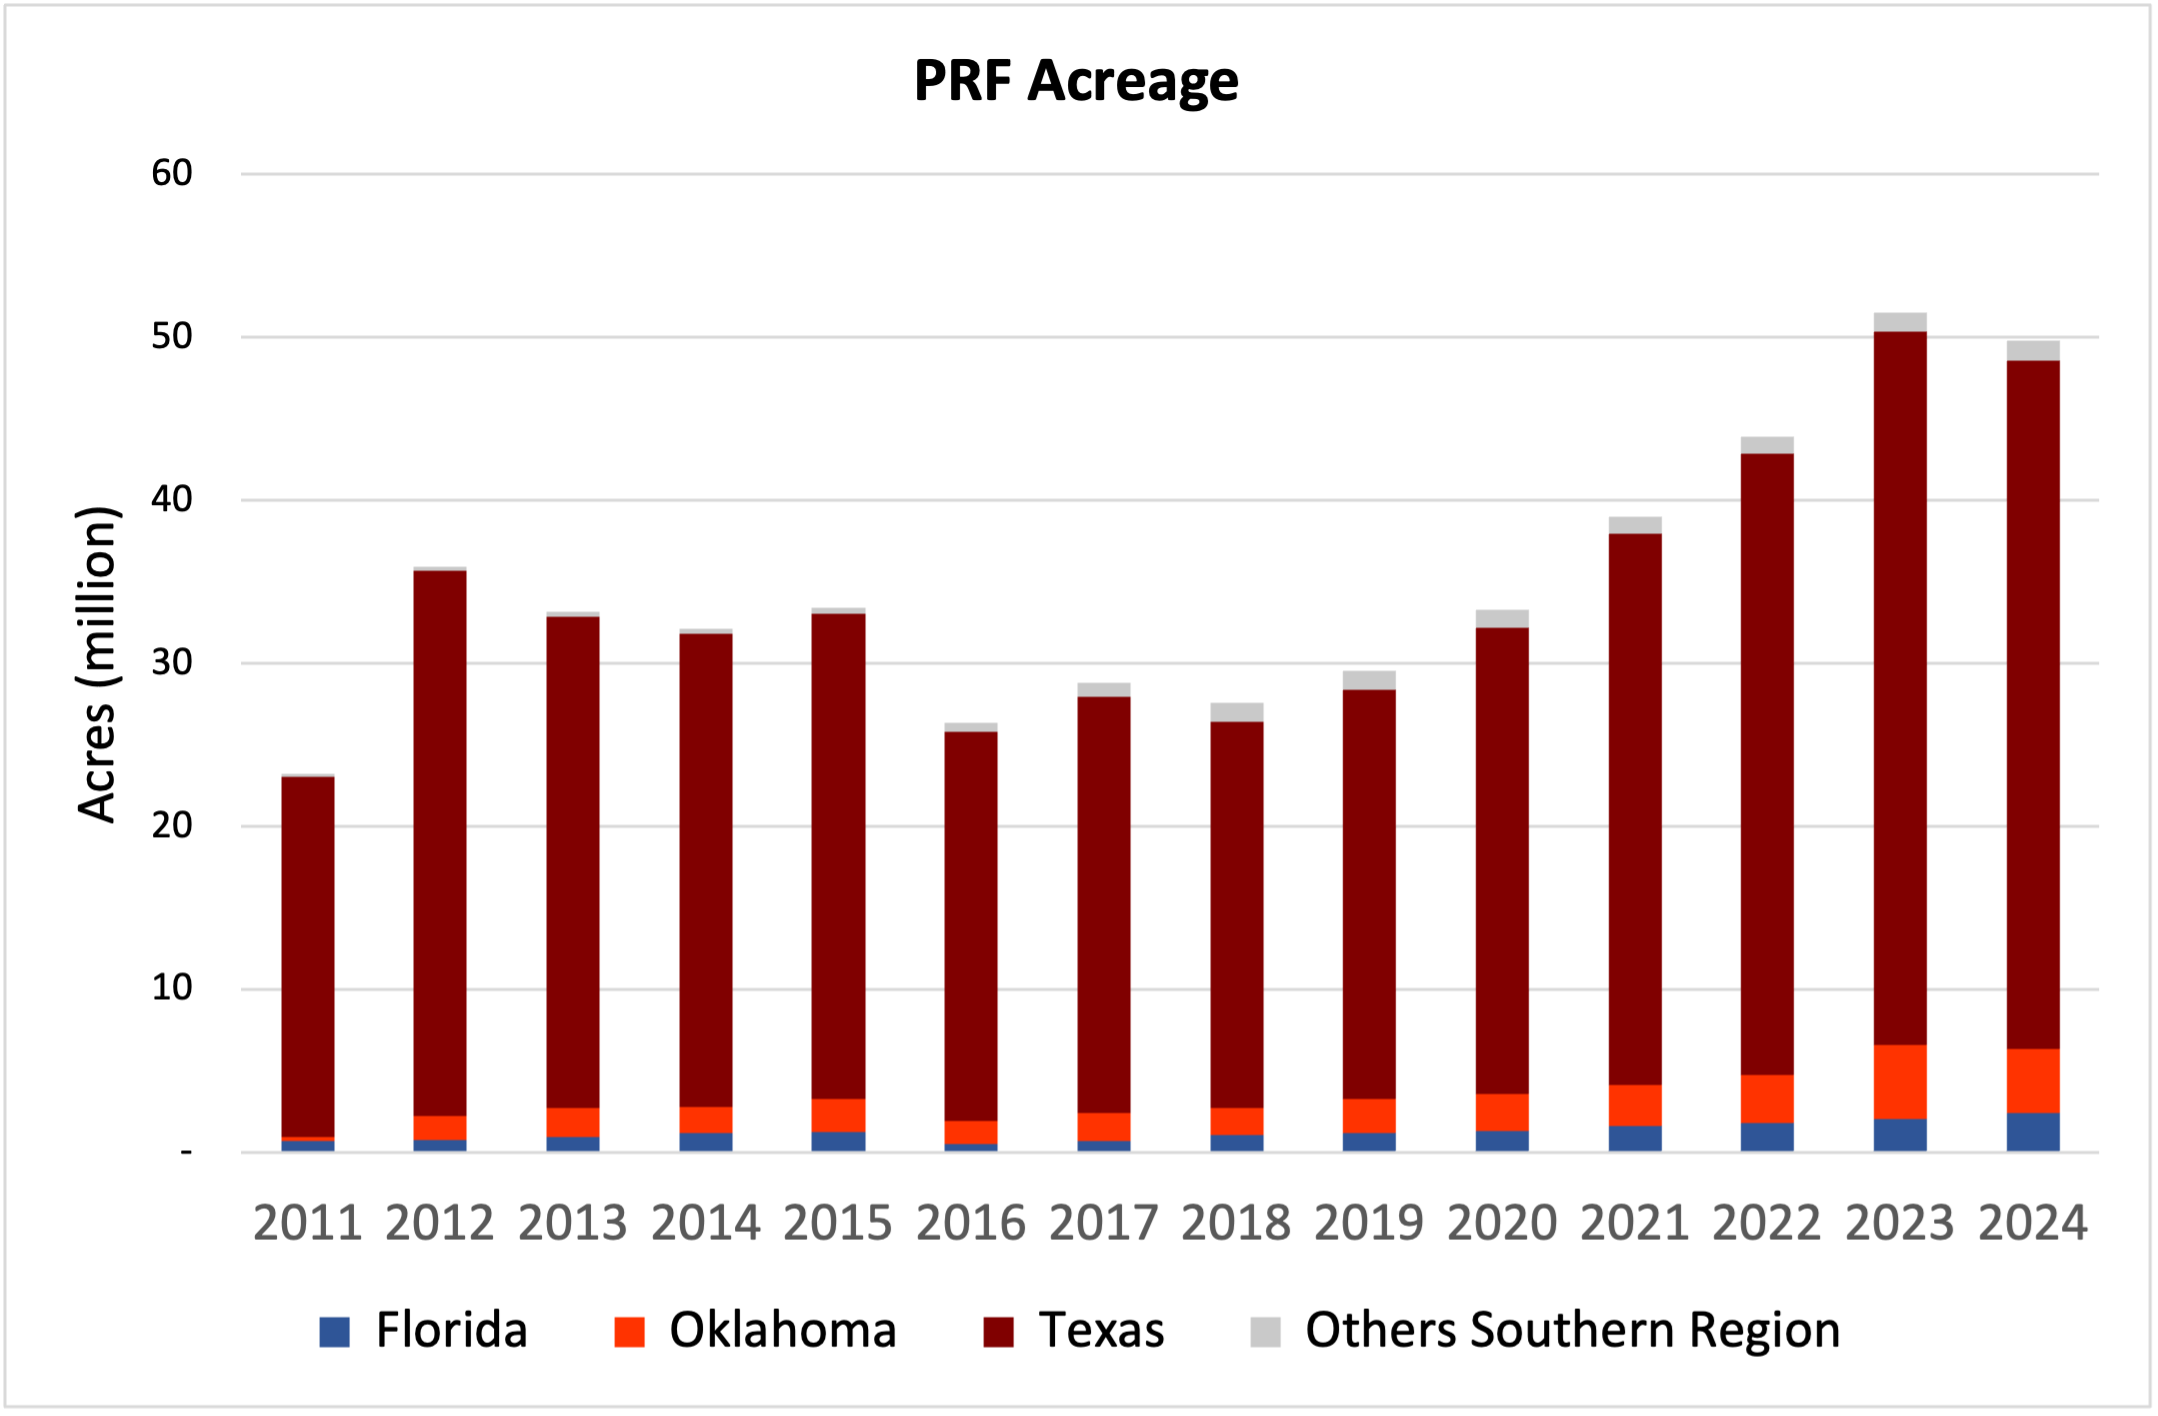
    In the Southern Region, the adoption of this program has more than doubled since its inception, with enrolled acres increasing from 20.8 million in the first year to approximately 49.8 million in 2024. With its vast area of open rangeland, Texas dominates PRF acreage enrollment, followed by Oklahoma and Florida.  These three states have seen significant increases in the adoption of PRF insurance, with Texas enrolling 42.8 million acres in 2024 (a 191% increase from 2011), Oklahoma enrolling around 4 million acres (a 1,491% increase from 2011), and Florida insuring 2.4 million acres in 2024 (a 344% increase from 2011). The other Southern Region states have also seen substantial increases in insured acres, indicating the growing recognition of the program’s benefits (739% increase from 2011). (Fig 3). For more information on PRF, consult the USDA Fact Sheet. If you’re considering purchasing this insurance, you can find a list of approved agents and insurance companies on the USDA website.

    Figure 2. PRF Premiums Paid by Farmers vs Indemnities Received in the Southern States (*2024 Partial Results)

    Figure 3. PRF Enrolled Acres in the Southern Region


    Abello, Pancho. “Increase in PRF Adoption in the Southern Region.Southern Ag Today 4(40.1). September 30, 2024. Permalink

  • Why You Should Run for Your Cooperative Board

    Why You Should Run for Your Cooperative Board

    Serving on a cooperative board can be a thankless job.  The pay is nominal and dissatisfied members find it easy to blame the board of directors.  Despite those challenges, there is a lot of satisfaction and growth from both running for and serving on the board of directors.  Here are the most compelling reasons you should run for your cooperative board.

    • One seldom mentioned perk is the self-satisfaction of stepping up to help your fellow producers. It takes time and energy to oversee a cooperative’s health and ensure that it is there for the next generation. There is personal satisfaction in being part of the solution.
    • You will gain an increased understanding of the cooperative. Board members open the hood and learn about the moving pieces, both operational and financial. It can be rewarding to better understand the organization that you use and own. 
    • You will gain increased financial knowledge.  Cooperative board members have fiduciary duties to protect the member’s investment.  That forces board members to up their game and take their financial skills to the next level. Many board members report that their time on the cooperative board made them better financial managers of their own operation.
    • You will have a chance to broaden your horizons and understanding of agriculture. Board members hear about members’ needs and while that can be challenging, it also provides insights into how other producers manage their farming operation. Strategic planning sessions give board members the opportunity to explore the broader trends in the agricultural industry.  Positioning the cooperative for the future goes hand in hand with future-proofing your own farming operation.

    Of course, being willing to run for the board of directors does not guarantee that you will be selected. That willingness to run is also a service to your fellow producers.  As John Minton said: “They also serve who stand and wait!”  By agreeing to run for the board you contribute to the democratic process of member control. Running for the board also broadens your connections with other producers and allows you to evaluate your own leadership and communication skills. Some cooperatives have associate board positions.  Associate board members are usually appointed and serve for shorter terms.  Associate board members attend meetings and participate in discussions but do not have a voting role.  That can be a great way to get a trial view of being a board member.

    Consider running for your cooperative board. You can improve your cooperative and become a better farmer!


    Kenkel, Phil. “Why You Should Run for Your Cooperative Board.Southern Ag Today 4(39.5). September 27, 2024. Permalink