Blog

  • USDA Farm Income Projections… Misused and Abused

    USDA Farm Income Projections… Misused and Abused

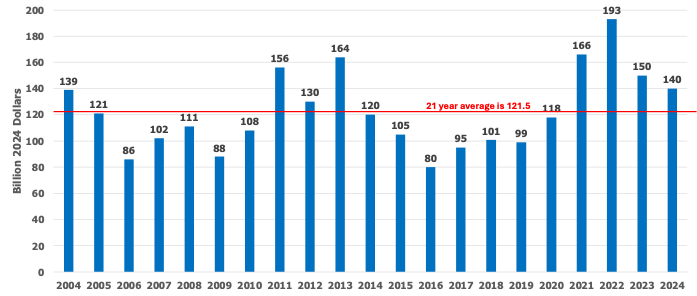
    One of the most misused and abused numbers in the agricultural policy world is the Net Farm Income (NFI) projection developed by the USDA Economic Research Service.   As described in the news release from USDA announcing the latest (September 5th) farm income projections, “Net farm income, a broad measure of profits, is forecast at $140.0 billion in calendar year 2024, a decrease of $6.5 billion (4.4 percent) relative to 2023 in nominal (not adjusted for inflation) dollars.”  Figure 1 contains the past 21 years of inflation adjusted net farm income data from the most recent release.  

    There is nothing wrong with the net farm income number… it just doesn’t mean what people think it means. Why?  It is widely used in Washington D.C. as a measure of how well farmers and ranchers are doing which indicates whether or not the safety net needs strengthening in cases where NFI is declining – like now.  How does it relate to how well a farmer anywhere in the U.S. is actually doing?   It really doesn’t since it is an estimate of the farm income of all types of agricultural operations in the United States.  To be meaningful to a farmer, the farmer would have to raise all the commodities included, which would be very unlikely.

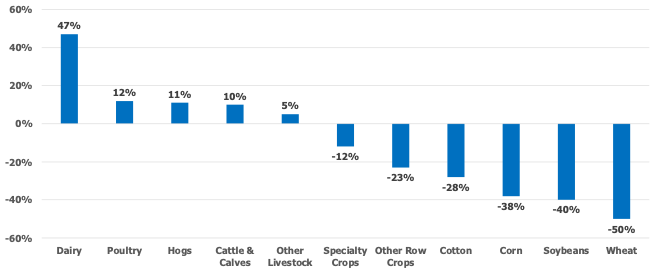
    Figure 2 presents the change in inflation adjusted net cash farm income (NCFI) for the commodity categories provided by USDA.[1]  Notice while inflation-adjusted NFI in Figure 1 only fell by $10 billion dollars ($150 billion to $140 billion), or 6.7%, from 2023 to 2024, there were significant NCFI declines for crop operations while livestock operations saw increases.

    This means that the significant losses in crop agriculture are being masked by the recent boom in profitability of livestock operations.  Don’t tell wheat farmers they should feel good that U.S. NFI at $140 billion is above the 21-year average (red line in Figure 1) in 2024 when wheat operations are forecast to have a 50-percent decline in their NCFI.  That would be a complete misuse of the data.

    Figure 1.  U.S. Inflation Adjusted Net Farm Income, 2023 to 2024.
    Source:  https://www.ers.usda.gov/topics/farm-economy/farm-sector-income-finances/

    Figure 2.  Percent Change in Inflation Adjusted Net Cash Farm Income by Commodity, 2023 to 2024.
    Source:  https://www.ers.usda.gov/topics/farm-economy/farm-sector-income-finances/

    [1] NCFI is calculated as gross cash income minus cash expenses. NFI is a broader measure of farm sector profitability that incorporates noncash items including changes in inventories, economic depreciation, and gross imputed rental income.


    Outlaw, Joe, Bart L. Fischer, and Natalie Graff. “USDA Farm Income Projections… Misused and Abused.” Southern Ag Today 4(41.4). October 10, 2024. Permalink

  • A Soybean Pricing Alternatives at Harvest

    A Soybean Pricing Alternatives at Harvest

    As harvest continues to progress, farmers face the decision to sell or store soybeans. If soybeans are stored, farmers should evaluate the risks and rewards of holding soybeans priced or unpriced. Consideration should be given to both futures price risk and basis risk for individual locations. Holding soybeans in storage with no price protection is risky, as the value of the crop in storage has the potential to decline in value, while also incurring storage costs, such as interest. USDA projects Brazil’s soybean production to be a record crop of 6.2 billion bushels, up 10% compared to last year (USDA September 2024 WASDE). Brazil’s soybean planting season runs from September through December, with harvest occurring from January through May (USDA, FAS). As such, the price of U.S. soybeans held in storage will be strongly influenced by production risk during the growing season in South America. 

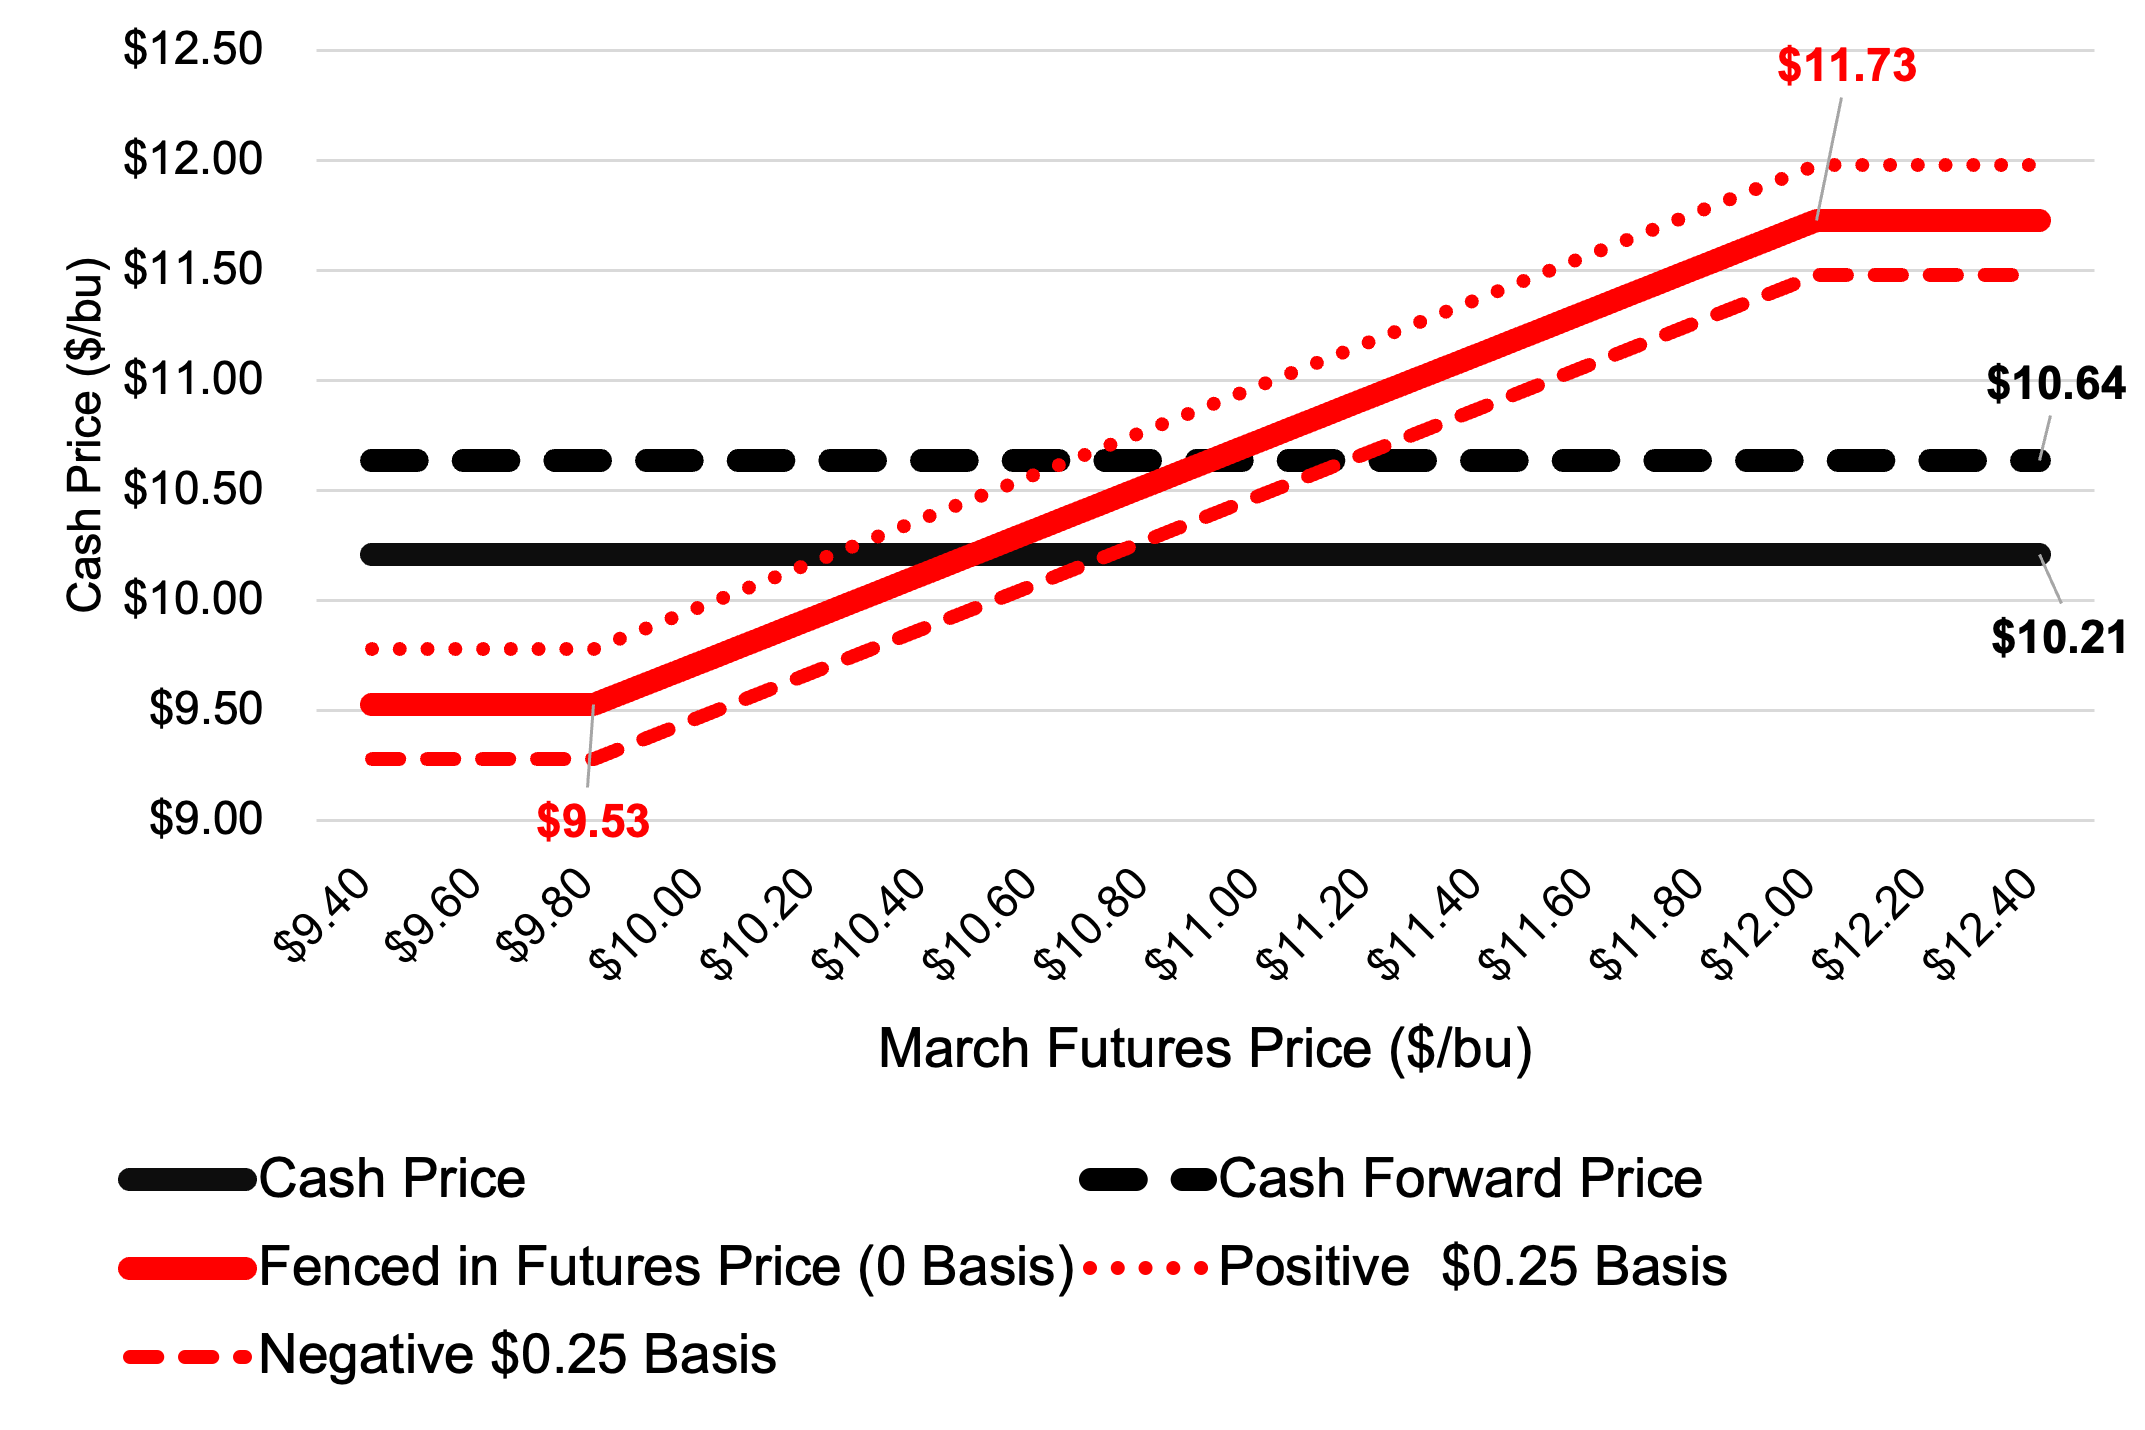
    Figure 1. Three soybean pricing scenarios in Memphis, TN as of Oct 3, 2024 

    This article examines three scenarios for pricing soybeans this fall.

    1. Sell soybeans at the current cash price;
    2. Store soybeans and establish a cash forward contract price for delivery in February; and
    3. Buy a put option and sell a call option to fence in a futures price with delivery of soybeans to a cash market in February.

    All futures market prices, premiums, and cash prices are for Memphis, Tennessee, as of October 3, 2024. Interest is assumed at an 8% rate.

    In scenario one, the cash price was $10.21 (November Futures contract $10.46; negative basis of $0.25). This is the most straight forward scenario. The farmer sells soybeans and receives $10.21 (solid black line in Figure 1).

    In scenario two, the farmer decides to store soybeans but wants to establish a price, so he enters a cash forward contract for delivery in February for $10.91. The interest cost to carry soybeans for four months is estimated at $0.27 ($10.21 x 8% x (4 months / 12 months)). Once delivered, the farmer receives $10.64 ($10.91 less $0.27 of interest expense; dashed black line in Figure 1). 

    In scenario three, the farmer stores soybeans for February delivery and buys a $9.80 March put option for $0.13 and sells a $12.00 March call option for $0.13, making the strategy premium neutral, without including transaction costs. This strategy has fenced in a futures price (does not include basis) between $9.53 and $11.73 (solid red line in Figure 1). Change in the March futures contract will determine the outcome. Positions in the futures market would be offset by cash sales. If March futures are below $9.80, assuming 0 basis, the producer will receive $9.53 ($9.80 less $0.27 in interest). For March futures prices below $9.80, the put option would be exercised, establishing a short position in the futures market for the farmer. If March futures are above $12.00, the producer will receive $11.73 ($12.00 less $0.27 in interest). For March futures prices above $12.00, the call option would be exercised, establishing a long position in the futures market for the farmer.  March futures prices between $9.80 and $12.00 will result in cash prices between $9.53 and $11.73. March futures prices above $10.48 would provide a net price greater than the cash sale in scenario 1, and a March futures price above $10.91 would provide a cash price greater than the storage with a cash forward contract in scenario 2. An additional benefit of the options strategy is that the farmer can set basis immediately or any time prior to delivery of the soybeans to the cash market. The dotted red lines in figure 1 show how a positive or negative $0.25 basis would affect the cash price received under the fenced in futures price scenario. 

    All three alternatives have advantages and disadvantages. Farmers need to determine their access to storage, price risk tolerance, and expectations for futures prices and basis for their market to evaluate which strategy is right for their operation.

    References

    Barchart.com. Soybean Futures and Options Prices and Premiums. https://www.barchart.com/futures/quotes/ZS*0/futures-prices?viewName=main

    USDA Foreign Agricultural Service. Country Summary. Brazil Soybean Area, Yield and Production. https://ipad.fas.usda.gov/countrysummary/Default.aspx?id=BR&crop=SoybeanUSDAUSDA September 2024 WASDE Report. https://www.usda.gov/oce/commodity/wasde

  • The Three Ps of Herd Expansion: Profit, Pasture and Patience

    The Three Ps of Herd Expansion: Profit, Pasture and Patience

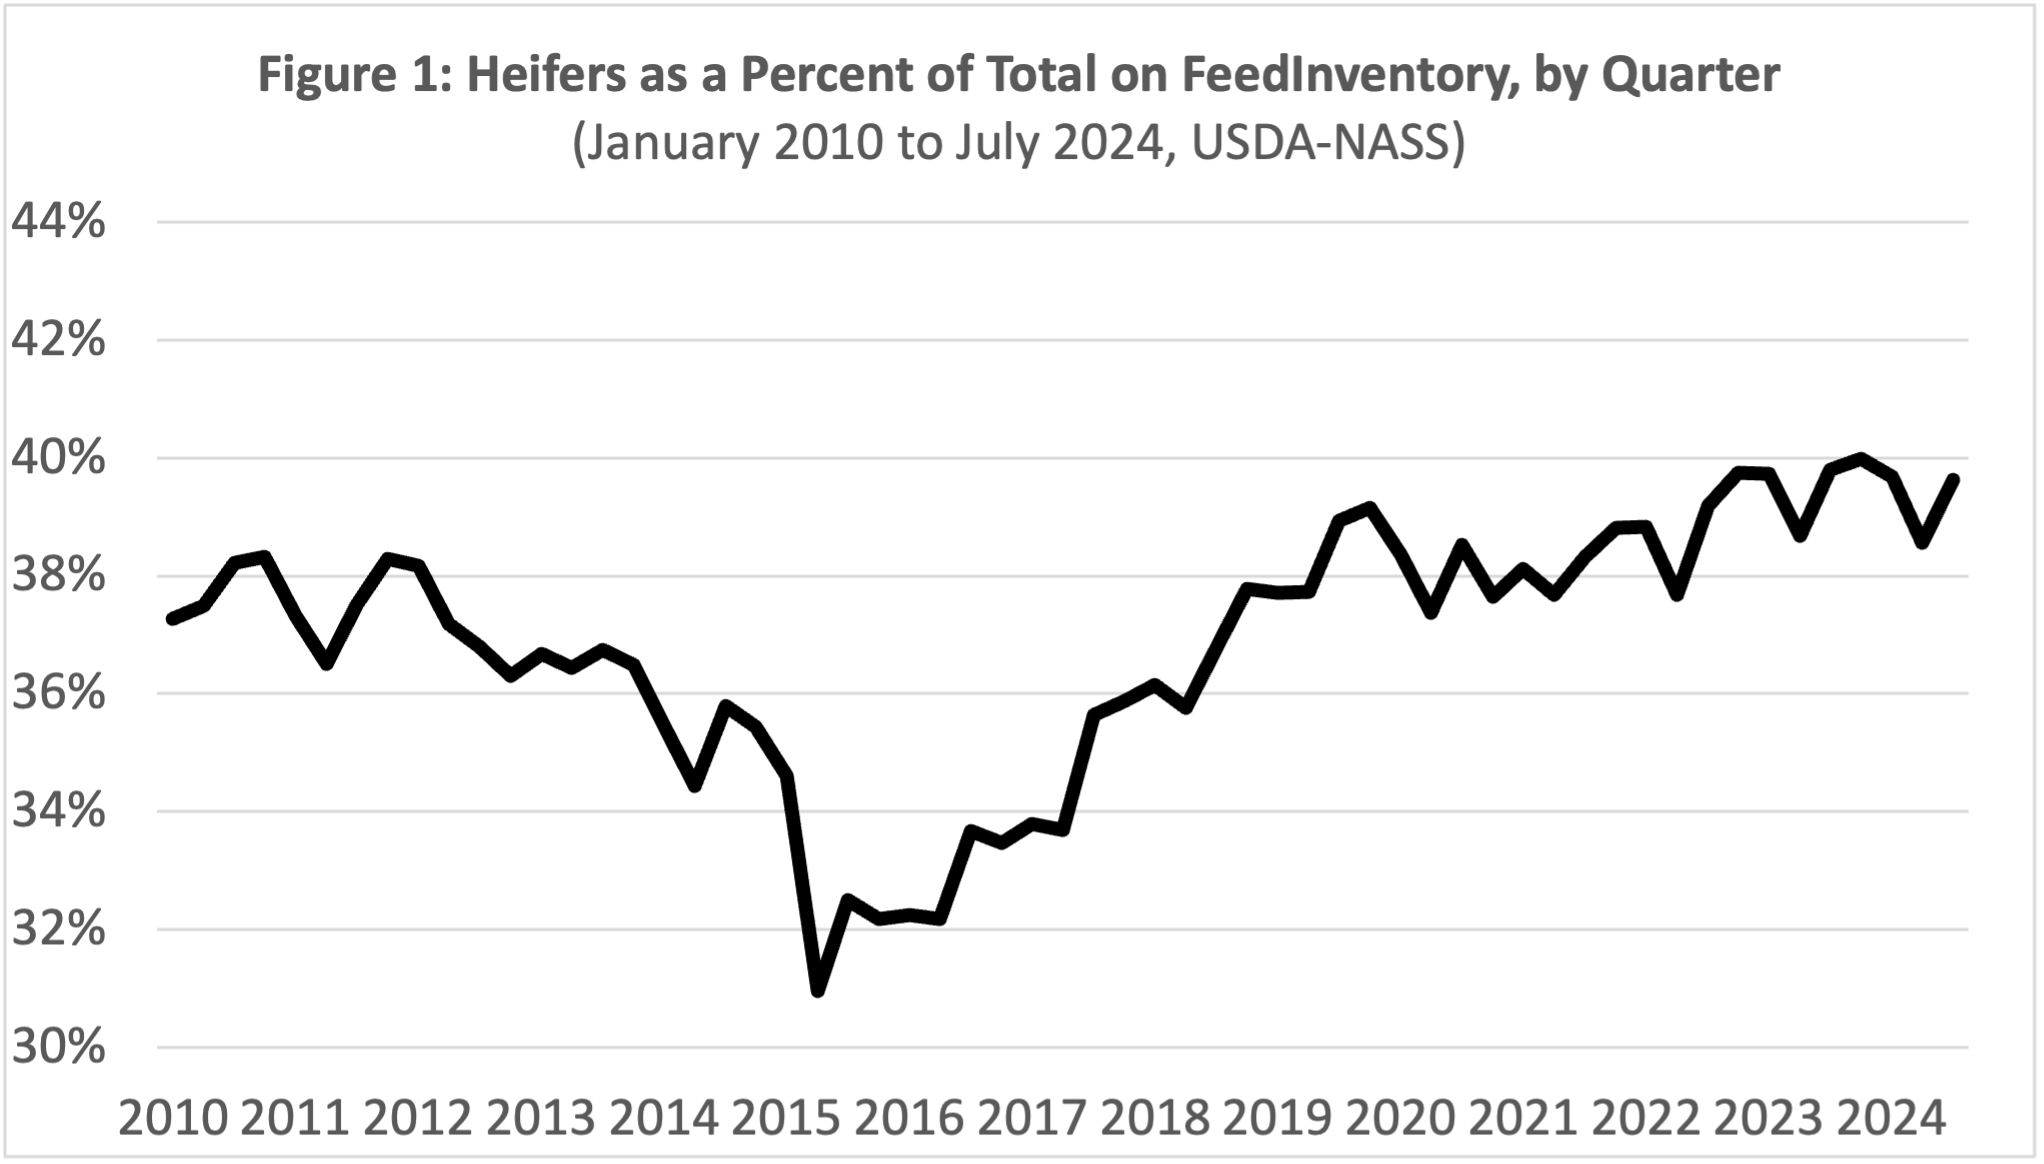
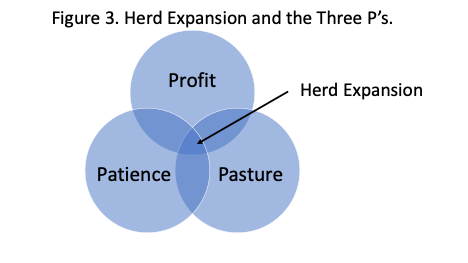
    The beef cow inventory is at a sixty-three-year low. Tight supplies have driven cattle markets and calf prices have increased by roughly $1 per lb over the last two years. Limited heifer retention and beef cow slaughter exceeding 10 percent of beef cow inventory for the year indicate that beef cow numbers will be even lower in 2025. Cowherd expansion will happen eventually but, there appears to be little evidence that producers have an appetite for that currently. For the cow herd to grow, we need to have the 3 Ps of herd expansion at the cow-calf level: profit, pasture, and patience.

    The first P is probably the most obvious – profit. There will be no interest in cowherd expansion without money being made at the cow-calf level. While profit has been there recently, it is important to remember that these strong calf price levels are relatively new. We actually went from November 2015 to February 2023 (7 years and 4 months) with the state average price of a 550 lb medium / large frame #1-2 steer in Kentucky being under $2 per lb. Coming out of that challenging 7-year period, I think a lot of cow-calf operators have been cautious and guarded. Just as importantly, a lot of costs are substantially higher now than they were ten years ago, so comparing current calf prices to historical calf prices is misleading. Still, I think current returns at the cow-calf level are sufficient to see heifer retention if the other two Ps fall into place.

    The second P is pasture, and I am using pasture broadly to describe forage/feed availability. While profit may be the first driver of expansion, no level of profit can make it rain, and limited pasture and hay supplies can nix any interest in expansion. As a recent example, drought was so widespread in the US during 2022 that expansion would have been highly unlikely, regardless of calf price levels. Both hay supplies and pasture and range conditions have improved since 2022, but a lot of areas have been dry this year, including my home state of Kentucky. 

    The final P is patience, and I think this may be the one that is most lacking in the cattle industry right now. When a farmer decides to expand the size of their cowherd, they are trading income from the sale of heifers today for a stream of income from additional calf sales in the future. Weaned heifers are valuable in 2024 and passing up that income in the short run is difficult. Developing heifers is also costly and is an expense that is incurred well before additional calves can be sold. These same factors were largely present when our last expansion began in 2015, but interest rates were considerably lower than they are today. Higher interest rates increase the cost of production and also increase the preference for income today, rather than in the future. Put another way, patience is at a premium in higher interest rate environments like the present.

    At some point, the three Ps will line up and herd expansion will start. When that will happen is a difficult question to answer, but it is safe to say there are no signs of heifer retention right now. Limited heifer retention, combined with cow slaughter levels, suggest that another decrease in beef cow inventory is almost certain when the January 2025 estimates are released. So, supply fundamentals are encouraging and should continue to support calf prices next year. Many are also expecting some reductions in interest rates over the several months, which may factor into this decision at the producer level. 

    If weather cooperates, I do think increased heifer retention could be seen in 2025, but it is important to remember that this would just be the first step towards expansion. And the initial impact of heifer retention is actually a tightening of calf markets as those heifers are held back. There are always risk factors out there, but I remain optimistic about the next couple of years largely because cattle supplies are tight and likely to get tighter. We are not seeing signs up expansion yet, so all we can do is watch for the 3 Ps!


    Burdine, Kenny. “The Three Ps of Herd Expansion: Profit, Pasture, and Patience.Southern Ag Today 4(41.2). October 8, 2024. Permalink

  • Preparing For Your Preparer

    Preparing For Your Preparer

    This time of year is busy as summer comes to a close, children have returned to school, harvest is in full swing, and we anticipate busy days in the fall and winter months. Another item for your to-do list is meeting with your tax professional. This appointment is often scheduled for the early part of the year, but there can be advantages to carving out some time now. 

    One of the main advantages is that even though a large majority of the year has passed, there is opportunity for tax planning and management relative to where things currently stand. This allows you (or you and the preparer together) to determine what you would like to see happen by the end of the year. 

    If it is a lower-income year so far, consider making additional sales to generate revenue when your income tax rate is lower. This could include making sales of business assets you are considering disposing of as the depreciation recapture or possible capital gains treatment rates could be lower. For expenses, we often think about taking as much expense as possible, but if income is already low, it may be advantageous to save those expenses for another time period. This may mean using depreciation sparingly, not pre-paying farm expenses, or otherwise cutting back on discretionary farm expenditures.

    In times of high income, the opposite strategies would be appropriate. We may hold off on making additional sales during the year to slow down revenue recognition. This could include installment sales, deferred payment contracts, deferring any disaster payments, and holding off on selling any assets from the business. To lower our taxable income, we may look to recognize additional expenses through depreciation, pre-paid inputs, or otherwise try to find ways to re-invest in the business or take personal deductions. If high income still seems likely, Schedule J income averaging may be another tax planning opportunity for the farm.

    A tax preparer may also clean up your business’ accounting records. Generally, late fall would be a slower time for CPA and accounting firms, which may provide focused attention on your operation when things are not so hectic. Again, getting a clear picture of revenues and expenses at this stage can help with decision-making, tax or otherwise. For a preparer, clients who are easy to work with and make the business run smoother are going to receive better outcomes and better service. Likely, you have ideas or plans between now and the end of the year. Sharing those with your tax advisor can alert you to any possible negative tax outcomes. Too often, preparers get a call after the fact, making the accounting/tax work more difficult and more expensive for you. 

    Each year will be unique, with new challenges and new opportunities.  Spending a bit more time communicating with your preparer, especially before year-end, may pay dividends for all involved.  


    Burkett, Kevin. “Preparing For Your Preparer.” Southern Ag Today 4(41.1). October 7, 2024. Permalink

  • The Food Insecurity Challenge: A Snapshot of the Southern U.S.

    The Food Insecurity Challenge: A Snapshot of the Southern U.S.

    The Food and Agriculture Organization (FAO) of the United Nations defines a person as food insecure if s/he “lacks regular access to enough safe and nutritious food for normal growth and development and an active and healthy life.” According to the U.S. Department of Agriculture’s (USDA) 2023 report on Household Food Security in the United States, 13.5% of households—approximately one in seven—experienced food insecurity (Rabbitt et al. 2023), underscoring the continued prevalence of this issue nationwide. Food insecurity exhibited an upward trend from 12.8% in 2022, reflecting a growing number of households with limited resources and chronic health conditions, among other factors. 

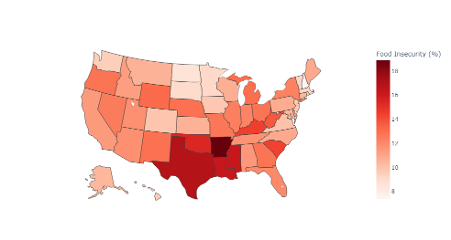
    The Southern region faced higher food insecurity rates (14%) compared to the national average of 12.2% between 2021 and 2023 (see Figure 1). Only five of the thirteen Southern states fell below the national average: Florida (12.0%), Tennessee (11.7%), Alabama (11.5%), North Carolina (10.9%), and Virginia (10%). Arkansas ranked as the most food-insecure state in both the Southern region and the nation, with a rate of 18.9%. The state’s food insecurity rate has steadily increased since 2020, reflecting significant challenges many Arkansan households face in accessing adequate food. According to Feeding America, more than 560,000 Arkansans experienced food insecurity in 2022, with approximately 24% of those affected being children. Other Southern states with food insecurity rates above the national average include Texas (16.9%), Mississippi (16.2%), Louisiana (16.2%), Oklahoma (15.4%), Kentucky (14.5%), South Carolina (14.4%), and Georgia (12.8%).

    It is important to address a lack of sufficient access to food due to its negative impact on health, which leads to poor productivity and lower overall economic growth and development. This is especially important given the increasing risk of food insecurity from greater uncertainty in global developments, such as wars in various parts of the world. These conflicts have disrupted food supplies in the US and worldwide (Filho et al. 2023; Kemmerling et al. 2022). Furthermore, higher domestic food prices and reduction in overall economic activity make it more difficult for low-income households to achieve food security (Elmes 2016). 

    To address this issue, the federal Supplemental Nutrition Assistance Program (SNAP) provides temporary assistance to help households purchase food until they regain financial stability. Non-profit organizations, such as food banks and food pantries, also play an important role in local communities. Sustainable efforts to reduce food insecurity must be intensified. Prospects for improving long-term food security are tied to the same economic factors that influence household income and budgeting, especially those connected to labor productivity and wages (LeBlanc et al. 2005). Efforts of this nature generally require the collaboration of community stakeholders to ensure a resilient economy, so that the benefits reach all community members.

    Figure 1. Prevalence of Household Food Insecurity by State, average 2021-2023

    Source: Visualized by authors using USDA, Economic Research Service using data from U.S. Department of Commerce, Bureau of the Census, 2021, 2022, and 2023 Current Population Survey Food Security Supplements.

    References

    Elmes, M. B. 2018. Economic Inequality, Food Insecurity, and the Erosion of Equality of Capabilities in the United States. Business & Society 57(6): 1045-1074. https://doi.org/10.1177/0007650316676238

    Filho L. W., M. Fedoruk, JH Paulino Pires Eustachio, J. Barbir, T. Lisovska, A. Lingos, and C. Baars. 2023. How the War in Ukraine Affects Food Security. Foods. 12(21): 3996. 

    Kemmerling, B., C. Schetter, and L. Wirkus. 2022. The logics of war and food (in)security. Global Food Security 33. https://doi.org/10.1016/j.gfs.2022.100634.

    LeBlanc, M., B. Kuhn, and J. Blaylock. 2005. Poverty amidst plenty: food insecurity in the United States. Agricultural Economics 32(s1): 159-173.

    Rabbitt, M. P., Reed-Jones, M., Hales, L. J., & Burke, M. P. (2024). Household food security in the United States in 2023 (Report No. ERR-337). U.S. Department of Agriculture, Economic Research Service.

    Feeding America, Food Insecurity among the Overall Population in Arkansas, Retrieved September 27, 2024, from https://map.feedingamerica.org/county/2022/overall/arkansas


    Thomas, Chrystol, and An-Ting Liao. “The Food Insecurity Challenge: A Snapshot of the Southern U.S.Southern Ag Today 4(40.5). October 4, 2024. Permalink