Blog

  • The Losses are Mounting…and are Projected to get Worse

    The Losses are Mounting…and are Projected to get Worse

    Over the last two weeks, row crop producers descended on the nation’s capital, lobbying for passage of a new farm bill and highlighting the need for ad hoc disaster assistance. If you do not personally live with the constant barrage of challenges facing our nation’s farmers and ranchers – ranging from droughts, wildfires, and hurricanes to inflation and market collapses – it’s easy to grow numb to their plight. Besides, aren’t farmers and ranchers always on Capitol Hill asking for assistance?

    We understand the cynicism, but most people do not realize that this is a direct consequence of the way farm bills are negotiated.  While many federal programs are on autopilot (e.g., Social Security, Medicare, Medicaid, etc) – where we don’t think about them until someone tries to change something – farm bills are negotiated roughly every 5 years on the premise that they need to be responsive to the needs of producers. Unfortunately, rather than responding to the needs of our nation’s farmers and ranchers, farm bills now get caught up in annual spending fights with growers constantly having to defend the farm safety net from attacks. On top of that, the short-term nature of the farm bill leaves producers in a regular state of limbo about what the safety net will cover. For example, producers are planning for the 2025 crop year, but they still have no clue what the safety net will look like for the upcoming crop year (nor do they know if any assistance will be provided to help with 2023 and 2024 losses). If that were not enough, these dynamics have culminated in a situation where “direct government payments” to producers in 2024 are forecasted to hit a 42-year low. The last time we saw so little investment in direct producer support was in 1982 in the midst of the farm crisis of the 1980s.  So, while it’s easy to joke that farmers and ranchers are always asking policymakers for something, the system is designed to work that way.  Whether or not that approach makes sense is open for debate, but we will save that conversation for another day. 

    In the meantime, between a stagnating farm bill process, a farm bill extension that is slated to provide virtually no help in 2024, and no ad hoc support from Congress over the last two years, an outside observer might quickly conclude that things must be going extraordinarily well in the farm economy.  To the contrary, USDA’s latest net farm income estimate showed a $35 billion decrease in crop cash receipts in 2024 alone, the largest single-year drop in the last 50 years (and the largest 2-year drop in history).  2025 is on track to be considerably worse. 

    As we noted above, farm bills are on a 5-year cycle because they are supposed to be responsive to the needs of farmers and ranchers.  But, support levels are at 42-year lows and growers are facing the prospect of enormous losses.  Congress passed a continuing resolution yesterday to extend current government funding levels through December 20th and promptly left town for the final stretch of the campaign season.  When they return on November 12th, they will face a very short runway to wrap up farm bill negotiations and provide ad hoc disaster assistance.  If Congress decides not to act – and absent a major rebound in the agricultural markets – many of our nation’s producers will enter the New Year in arguably some of the most challenging financial circumstances they’ve faced in decades.


    Fischer, Bart L., and Joe Outlaw. “The Losses are Mounting…and are Projected to get Worse.Southern Ag Today 4(39.4). September 26, 2024. Permalink
  • Low River Levels on the Mississippi River: Not the Three-peat We Want

    Low River Levels on the Mississippi River: Not the Three-peat We Want

    The Mississippi River level measured at Memphis, TN, has dropped to severe low levels for the third year in a row. As of 11:35 AM on September 23, 2024, the river level fell to -10 feet. In the past ten years, the Mississippi River has fallen below the established zero level[1] during harvest (i.e., August 1 through November 30) seven times. However, the level has only fallen to the “low” stage – defined by the National Weather Service as -5 feet – four times (2015, 2017, 2022, and 2023). The river level has serious implications for cash basis, or the local cash price offered by a grain elevator less the futures price traded on a global market.

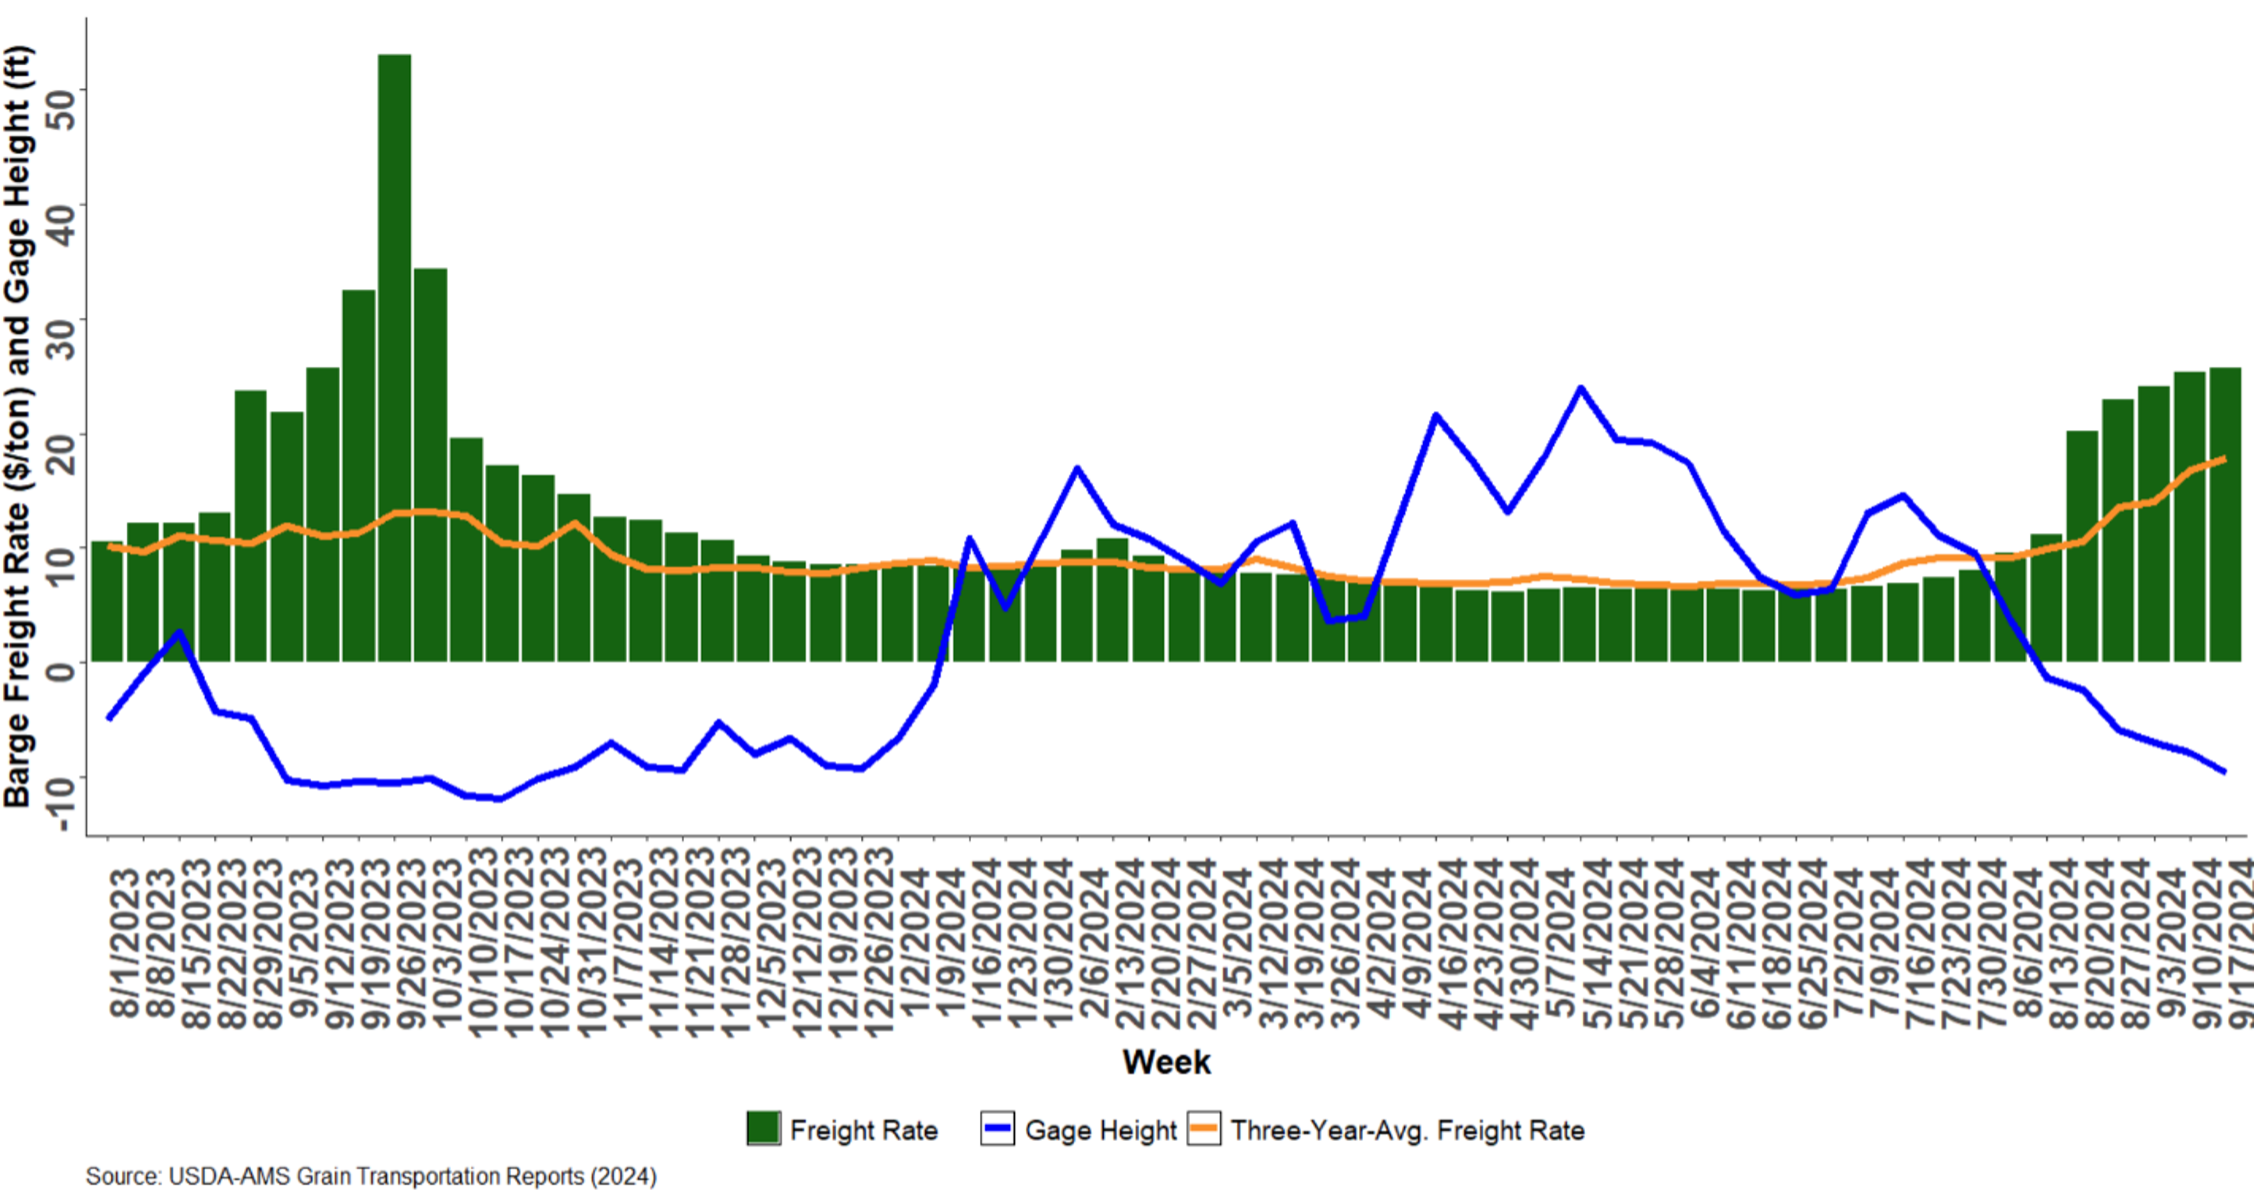
    Barge freight rates are established by the U.S. Inland Waterway System using a percent of tariff system. Benchmark rates are based on the tariff rates from the Bulk Grain and Grain Products Freight Tariff No. 7, entered into in 1976 between the U.S. Department of Justice and Interstate Commerce Commission (USDA-AMS, 2024).  While these rates are no longer directly applicable, they are still used to calculate the percent of tariff.  Calculating the percent of tariff consists of dividing today’s tariff rate by the 1976 tariff rate. The 3-year average percent of tariff rates indicates the weekly barge freight rate tends to be near 360 percent of tariffs, or about $11.23/ton[2] (USDA-AMS, 2024). Low Mississippi River levels have a negative effect on corn and soybean basis through the barge freight rate (Figure 1). For example, the week of September 26, 2023, the barge freight rate was 1,689 percent of tariff, or $53.03/ton, which means the cost to transport grain from Cairo, IL, or Memphis, TN, to the port of New Orleans was four times higher than the three-year average for the same week. 

    Figure 1. The relationship between the Mississippi River level and barge freight rates for moving cargo from Cairo, IL or Memphis, TN 

    Figure 1 plots the Mississippi River level measured at Memphis, TN, for the period August 1, 2023, through September 3, 2024. This figure also provides the weekly average freight, as well as the expected barge freight rate measured by the non-drought three-year average freight rate (i.e., 2019-2021). As the gage height falls, barge freight rates increase, and vice versa.

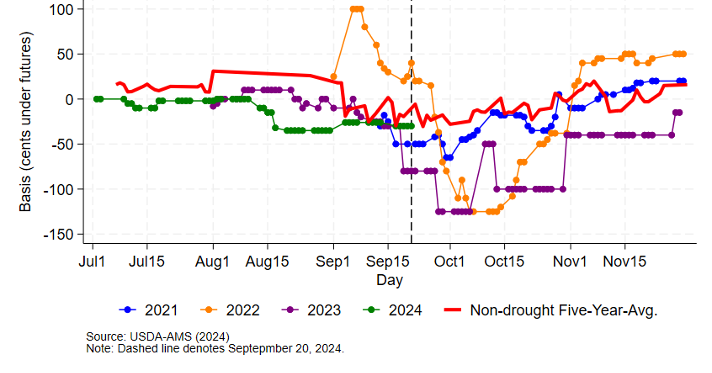
    The relationship between the futures price and the price at local cash markets can change abruptly due to economic or environmental events, such as low river levels. Local cash bids offered by elevators on the Mississippi River tend to be influenced by river level in periods of drought, because it is more expensive to ship the same amount of grain in more loads due to reduced barge draft (Biram, et al., 2022; Biram, 2023; Gardner, Biram, and Mitchell, 2023). Figure 2 shows the soybean basis response to low river levels in Helena, AR, in 2022 and 2023 with another downward trajectory for 2024 as of September 20, 2024.

    Figure 2. Daily Soybean Basis at Helena, AR in Harvest Window

    Figure 2 shows the historical daily basis for soybeans during the months of July through November. The blue, orange, purple, and green lines denote the 2021, 2022, 2023, and 2024 crop years, respectively. The solid red line denotes the non-drought five-year average basis for a grain elevator in Helena, AR. The non-drought five-year-average provides the “normal,” or “expected,” basis. The dashed vertical line denotes the basis most recently reported (-26) on September 10, 2024, which is 5 cents below the five-year-average basis of -31 cents.

    While it may appear that the current basis in the heart of the Midsouth Delta region is similar to the non-drought five-year-average, this should be interpreted with caution. Upon closer inspection, the 2022 crop year also saw relatively strong basis at this time, but a steep decline followed. The relatively strong basis in the first week of September is likely due to only 30% of the midsouth soybean crop being harvested with the remaining occurring by mid-November, along with recent rains, including those from Hurricane Francine. 

    A potential option farmers might have is to store grain in the bin and market grain in the post-harvest window as described at length in previous Southern Ag Today articles (Gardner, 2023; Gardner and Maples, 2023; Gardner, 2024). Historically, futures and basis tend to recover in the months when there is little domestic production to buy and stocks are drawn down. We note that the USDA Marketing Assistance Loan (MAL) program may be an additional tool to add to a post-harvest marketing strategy. A benefit to using MALs is the offered interest rates are below the market average saving potential interest expense. Since grain sitting in the bin is not paying off the operating loan taken at the beginning of the crop year, interest accrues on the operating loan, creating the opportunity cost of storage in addition to the explicit costs of handling and drying (Gardner, 2023; Smith, 2024).


    [1] According to the National Weather Service, silt may deposit in a river channel filling it up, or the channel may be washed deeper due to strong currents. Establishing a gauge zero level maintains consistency in river level measurements over time (National Weather Service, 2024).

    [2] This figure is found by multiplying the percent of tariff, which in this example is 3.60, by the benchmark rate for the Cairo-Memphis ports which is $3.14.


    References

    Biram, Hunter, John Anderson, Scott Stiles, and Andrew McKenzie. “Low Water Levels in the Mississippi River Result in Abnormally Weak Soybean Basis“. Southern Ag Today 2(45.1). October 31, 2022. Permalink

    Biram, Hunter. “Flooding in the Upper Mississippi River is Associated with Relatively Weak Soybean Basis in the Midsouth.” Southern Ag Today 3(21.1). May 22, 2023. Permalink

    Gardner, Grant, Hunter Biram, and James Mitchell. “Low River Levels, Barge Freight, and Widening Basis.” Southern Ag Today 3(39.1). September 25, 2023. Permalink

    Gardner, Grant. “Interest Rates and Grain Storage.” Southern Ag Today 3(26.1). June 26, 2023. Permalink

    Gardner, Grant. “To Store or Not to Store? Old Crop Exit Strategies.” Southern Ag Today 4(35.1). August 26, 2024. Permalink

    Gardner, Grant, and William E. Maples. “River Levels and Off-Farm Storage Disbursement.” Southern Ag Today 3(43.1). October 23, 2023. Permalink

    National Weather Service. “How can a river stage be negative?” National Oceanic and Atmospheric Administration, National Weather Service. Accessed September 16, 2024. Permalink

    Smith, Aaron. “Storing corn or soybeans: what is the futures market incentivizing?” Southern Ag Today 4(33.1). August 12, 2024. PermalinkUSDA-AMS. 2024.  Grain Transportation Repots. Available at: https://www.ams.usda.gov/services/transportation-analysis/gtr


    Biram, Hunter, James L. Mitchell, and H. Scott Stiles. “Low Rivers Levels on the Mississippi River: Not the Three-Peat We Want.” Southern Ag Today 4(39.3). September 25, 2024. Permalink

  • Cattle on Feed and Record High August Fed Cattle Weights

    Cattle on Feed and Record High August Fed Cattle Weights

    The latest USDA Cattle on Feed report was released Friday and showed placements of cattle into feedlots during August were 1.4 percent lower than during August 2023. Marketings of fed cattle out of feedlots were down about 3.5 percent from a year ago, partially due to one less business day in August 2024 than in August 2023. Both of these numbers were within pre-report expectations and will likely not be big market movers. 

    Most of the decline in placements from a year ago occurred in placements of cattle weighing less than 800 pounds. Placements of cattle in this weight range were 3.4 percent lower while placements of cattle weighing more than 800 pounds were 1.4 percent higher. Placements in both Kansas and Nebraska were down about 3 percent while placements in Texas were down nearly 6 percent as compared to a year ago. Placements in Colorado were the exception and were up nearly 30 percent. 

    Despite the lower placements, the total number of cattle in feedlots with more than 1,000 head capacity on September 1st was up 0.6 percent compared to a year ago. This continues the trend of cattle staying in feedlots longer. Total placements of cattle into feedlots during 2024 is down about 2 percent but longer feeding periods have reduced turnover and helped to keep inventory levels from fully reflecting the declining calf crop totals. 

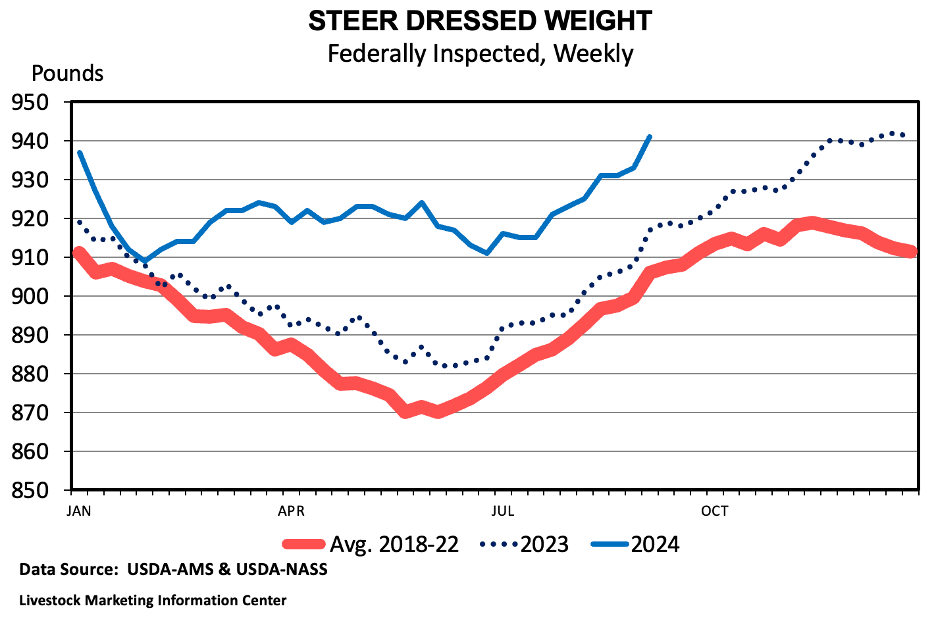
    Longer feeding periods are leading to higher cattle weights. The average dressed weight for federally inspected steers during August 2024 was 930 pounds. Assuming a dressing percentage of 62.5 percent, this suggests an average live weight of 1,488 pounds. This is the highest August steer dressed weight average on record, easily surpassing the 911-pound average during August 2020. Heifer dressed weights also hit an August record at 840 pounds on average. The higher dressed weights are offsetting much of the impact of lower cattle numbers on beef production. Total beef production in 2024 is now expected to be very close to beef production in 2023 despite fewer head processed.


    Maples, Josh. “Cattle on Feed and Record High August Fed Cattle Weights.Southern Ag Today 4(39.2). September 24, 2024. Permalink

  • Contract Broilers Growers Could See Changes in Their Pay Arrangements

    Contract Broilers Growers Could See Changes in Their Pay Arrangements

    The Poultry Grower Payment Systems and Capital Improvement Systems rule proposal is the latest effort by the Agricultural Marketing Service to address perceived inequities within the typical commercial broiler grower’s contract arrangements with poultry companies like Tyson, Pilgrims, and others. This is in addition to the recently passed Transparency in Poultry Grower Contracting and Tournaments rule, which became active on February 12, 2024. The proposed new rule would also modify the Packers and Stockyard Act. If implemented, the new rule would affect poultry growers in two substantial ways: 1. It would change the primary way most contract broiler growers are paid by modifying or replacing the traditional “tournament pay ranking system” (only applies to companies using such a ranking system) and 2. it would establish documentation requirements for any additional capital improvements recommended or required by the company. The comment period for this rule closed on August 9, 2024. The final results of this proposed rule may be impacted by the recent SCOTUS decision in Loper Bright on federal agencies’ rulemaking power to implement such rulings. 

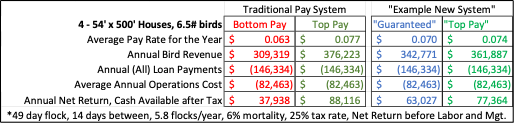
    The traditional tournament pay system allows for the grower’s pay per pound to be adjusted up or down, or “ranked”, from a stated base pay rate according to the cost of growing the company’s birds on individual contract farms. Broiler growers are typically subject to “pluses and minuses” above or below a stated base pay per pound. (see fig 1) This ranked pay system has been in place for most contract growers in some form for several decades. The most often noted concern is that it can cause growers to receive a lower pay rate based on factors not fully in their control. Many companies recognize this potential and have contingency plans that offer growers relief from such situations, though not all agree on how those are handled or when they are appropriate. From a practical perspective, sometimes the exact cause of a high-cost flock of chickens is difficult to identify. Even so, growers often feel they are at the mercy of a system not designed with their best interests in mind. The proposed rule would attempt to remedy this situation by requiring all contracted growers to receive a minimum pay rate for every flock, regardless of a flock’s cost to the company. The rule does not specify whether this pay must be per pound, per square foot of growing space, or any other specific method. It does specify that any pay system must be a “fair comparison among growers.” The rule would allow positive pay incentives to be utilized, but only if all stipulations for receiving incentives meet the “fair comparison among growers” standard and are clearly documented. 

    Simply put, under the new rule, there could be competition for extra pay, but everyone gets the minimum pay first. Any grower who experiences a non-competitive situation out of their control would be required to be paid outside of any competition. It is suggested that a multiple flock average payment be employed in such cases. (Many poultry companies use a multi-flock average in such situations now.) The rule also stipulates that the minimum pay cannot be set arbitrarily low but must be sufficient to cover the average costs of growing birds in an area. 

    Whether or not a new pay system would increase the cost of growing birds for a company would depend on the system and rates chosen. However, if there is a minimum pay guarantee, it is plausible that minimum standards for raising the birds will be increased.  It is also plausible that the highest pay rates a grower could earn might be decreased to cover company live-cost increases from a new system of pay.

    The second part of the rule concerns capital assets on the farm. Often, companies recommend or require growers to make significant capital investments in equipment upgrades or structural improvements. Sometimes, these are simply “good maintenance” related, but often, they concern efficiency or cost-saving improvements that benefit the company as much as the grower. They could be the result of customer’s demands or animal welfare guidelines. Under the new rule, companies that recommend or require additional capital improvements of $12,000 or more must provide documentation to the grower of why such expenditures are to be made, expected costs, potential benefits to the grower or the birds, the research or data that supports it, and what the grower should expect for financial return, if any. The rule does not eliminate the potential of a grower suffering a negative impact if a specific required capital improvement is not implemented. Nor does it require that all capital expenditures be financially beneficial to growers. It simply requires the documentation above with some financial explanation for any additional capital improvement coming from the company. 

    In addressing the overall purpose of this proposed rule, the following statement was made in summary by the AMS: 

    “The benefits that will accrue to growers from the proposed changes will result from increased clarity as growers will be informed of minimum compensation outcomes that can occur under the broiler grower arrangement. There is no expectation that aggregate payments to growers will increase.”

    Fig. 1: In a traditional tournament pay system, there could be a range of +/- 10% or more from base pay per pound delivered. A grower’s pay could vary anywhere in this range based on their flock’s cost. This doesn’t sound like much variation, but when multiplied over the total pounds of a modern farm, the resulting gross revenue differential is substantial. In the examples below, if base pay is $0.070 / lb., top pay is $0.077 and bottom pay is $0.063 per pound under a traditional tournament system, the resulting pay variation a grower might experience flock to flock could be $8,650, or $50,178 total annually. Under the proposed rule, the base pay would now be the minimum per pound guaranteed to the grower. It is plausible that the resulting top pay might be lowered to +5% to help the company cover the potential increase in live-cost, resulting in lower potential top pay for growers. However, the potential variation might decrease to $14,337 annually under a “new” system, lessening the income risk of the grower by 60%. 


    Brothers, Dennis, and Paul Goeringer. “Contract Broilers Growers Could See Changes in Their Pay Arrangements.” Southern Ag Today 4(39.1). September 23, 2024. Permalink

  • Beekeeping Operations and Revenue Sources in Alabama 

    Beekeeping Operations and Revenue Sources in Alabama 

    Beekeepers provide valuable services to the population and agricultural community in Southern states. Many beekeepers produce honey, which they sell to retailers or directly to consumers. In addition, many specialty crops grown in the South rely on pollinators – both wild pollinators and those managed by beekeepers – to produce fruit and seeds. Blueberries and watermelon in particular are entirely dependent on insect pollinators, and other crops such as avocados, oranges, strawberries, and tomatoes are moderately dependent on insect pollinators (Mallinger et al. 2021). Reflecting this dependence, the largest number of acres that farmers pay to have pollinated in many Southern states is blueberries, followed by watermelon (USDA 2023).

    Given the importance of beekeepers to Southern consumers and to farmers, we conducted an electronic survey of 150 Alabama beekeepers. Our response represented about 12% of the registered beekeepers in Alabama. Alabama has fewer honeybee colonies and lower honey production than Florida or Georgia, but comparable to South Carolina (USDA 2024). Despite the lower total production, Alabama honey yield per colony is higher than other Southern states except for South Carolina (USDA 2024). Alabama also had the highest honey price per pound of all the states in the Southern region in 2023 (USDA 2024). 

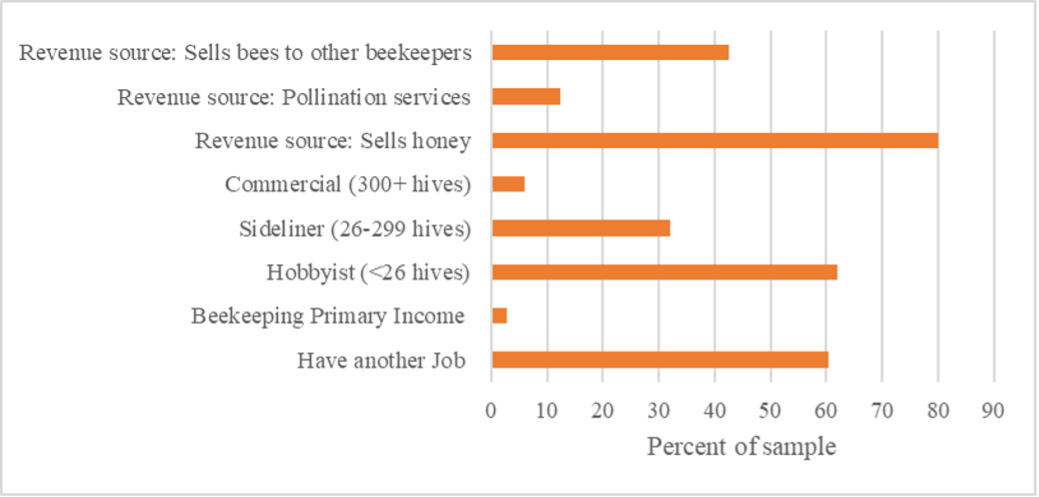
    Figure 1 describes the operation size and revenue sources for the surveyed beekeepers. Almost all of the beekeepers sold honey (80%), and many beekeepers sold bees to other beekeepers (42.6%). Very few beekeepers provided pollination services (12%). The most immediate potential for revenue growth among beekeepers thus consists of improving the marketing potential of honey. For farmers in specific regions, it may also be difficult to find a beekeeper that provides pollination services. 

    The majority of our sample (62%) were “hobbyist” beekeepers with small numbers of hives, and only 6% of our sample were large commercial beekeepers. Farmers looking for pollination services would thus need to find the few beekeepers who have enough capacity to pollinate the required number of acres. Alternatively, farmers may wish to contract with many different hobbyist beekeepers either individually or through a cooperative of hobbyist beekeepers. 

    Of the sampled beekeepers who did provide pollination services, 72.2% only offered them within Alabama, while 27.8% offered them both within Alabama and in other states (Florida, Georgia, and California). Reflecting the fact that most of the beekeepers were hobbyists, when asked about barriers to providing pollination services, those that did not offer these services cited a lack of time, resources, and the fact that their operations were too small. Respondents also cited barriers to expanding honey production, which also included a lack of time, as well as difficulty identifying new markets and competing with mass-produced honey that may be mixed with non-honey sweeteners. 

    Given the presence of hobbyist beekeepers in Alabama, facilitating coordination between smaller beekeepers will be essential to improving beekeeper revenue from honey as well as providing pollination services. Beekeepers associations may help connect farmers with beekeepers with the capacity to provide pollination services. Hobbyist beekeepers may also find it beneficial to organize into cooperatives that either provide pollination services or coordinate marketing efforts of local honey. Such cooperatives may have the collective capacity that an individual beekeeper lacks to identify new honey markets or provide consumer education on honey. At the extreme, a state- or region-specific honey marketing board may further improve marketing coordination between large numbers of smaller beekeepers. 

    Figure 1: Characteristics of a sample of 150 Alabama beekeepers

    Source: Survey of 150 Alabama beekeepers conducted in 2024 by the authors

    Sources:

    Mallinger, Rachel E., John J. Ternest, Sarah A. Weaver, James Weaver, and Samantha Pryer. 2021. Importance of insect pollinators for Florida agriculture: A systematic review of the literature. Florida Entomologist 104(3): 222-229. 

    United States Department of Agriculture, National Agricultural Statistics Service. Cost of Pollination, December 15, 2023. 

    United States Department of Agriculture, National Agricultural Statistics Service. Southern Region News Release Honey, March 15, 2024. 


    Scarbrough, Lawson, and Joel Cuffey. “Beekeeping Operations and Revenue Sources in Alabama.Southern Ag Today 4(38.5). September 20, 2024. Permalink