Blog

  • Commodity Program Payment Limits, Farm Entity Creation, and Implications for the Next Farm Bill

    Commodity Program Payment Limits, Farm Entity Creation, and Implications for the Next Farm Bill

    Payment limitations are not a novel policy tool.  Modern day limits have been imposed since the 1970 Farm Bill, with multiple changes to the payment limit in subsequent farm bills (Congressional Research Service, 2020; Ferrell, Fischer, Lashmet, 2024). We provide an example of what incentivizes a producer to create a new entity to receive potentially forgone commodity program payments and how it could be completed in practice when appropriate.  It should be note that there are rules in place that prohibit farmers from restructuring just to avoid payment limits.

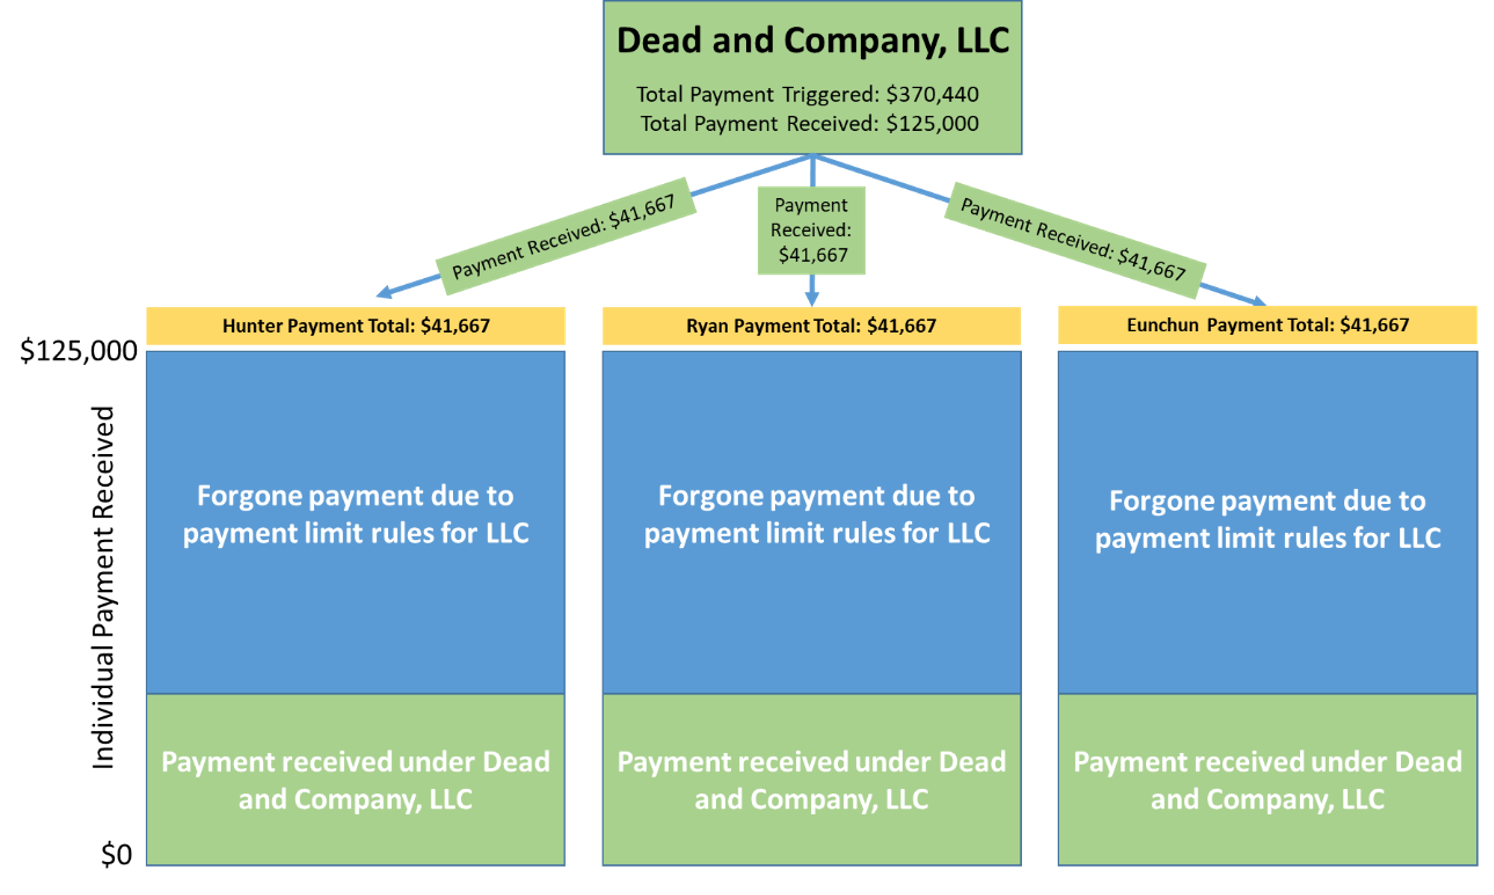
    Suppose a producer is one of three members (with equal ownership shares) of Dead and Company, LLC, located in Lawrence County, Arkansas. The entity has 2,800 acres of long grain rice base; the county average Price Loss Coverage (PLC) payment yield is 63 cwt/ac[1], and the payment rate is $2.10/cwt. This would result in a total PLC payment for Dead and Company, LLC of $370,440[2]. However, under current rules, Dead and Company, LLC is subject to a $125,000 payment, and each member is also subject to a personal payment limit of $125,000, however, based on their one-third share they are limited to $41,667. In this example, Dead and Company, LLC receives the full $125,000 payment limit, effectively forgoing $245,440 ($81,813 per member) of the total payment. A visual example is provided in Figure 1 below.

    Figure 1. Example of Payment Limit Distribution and Forgone Payment under an LLC
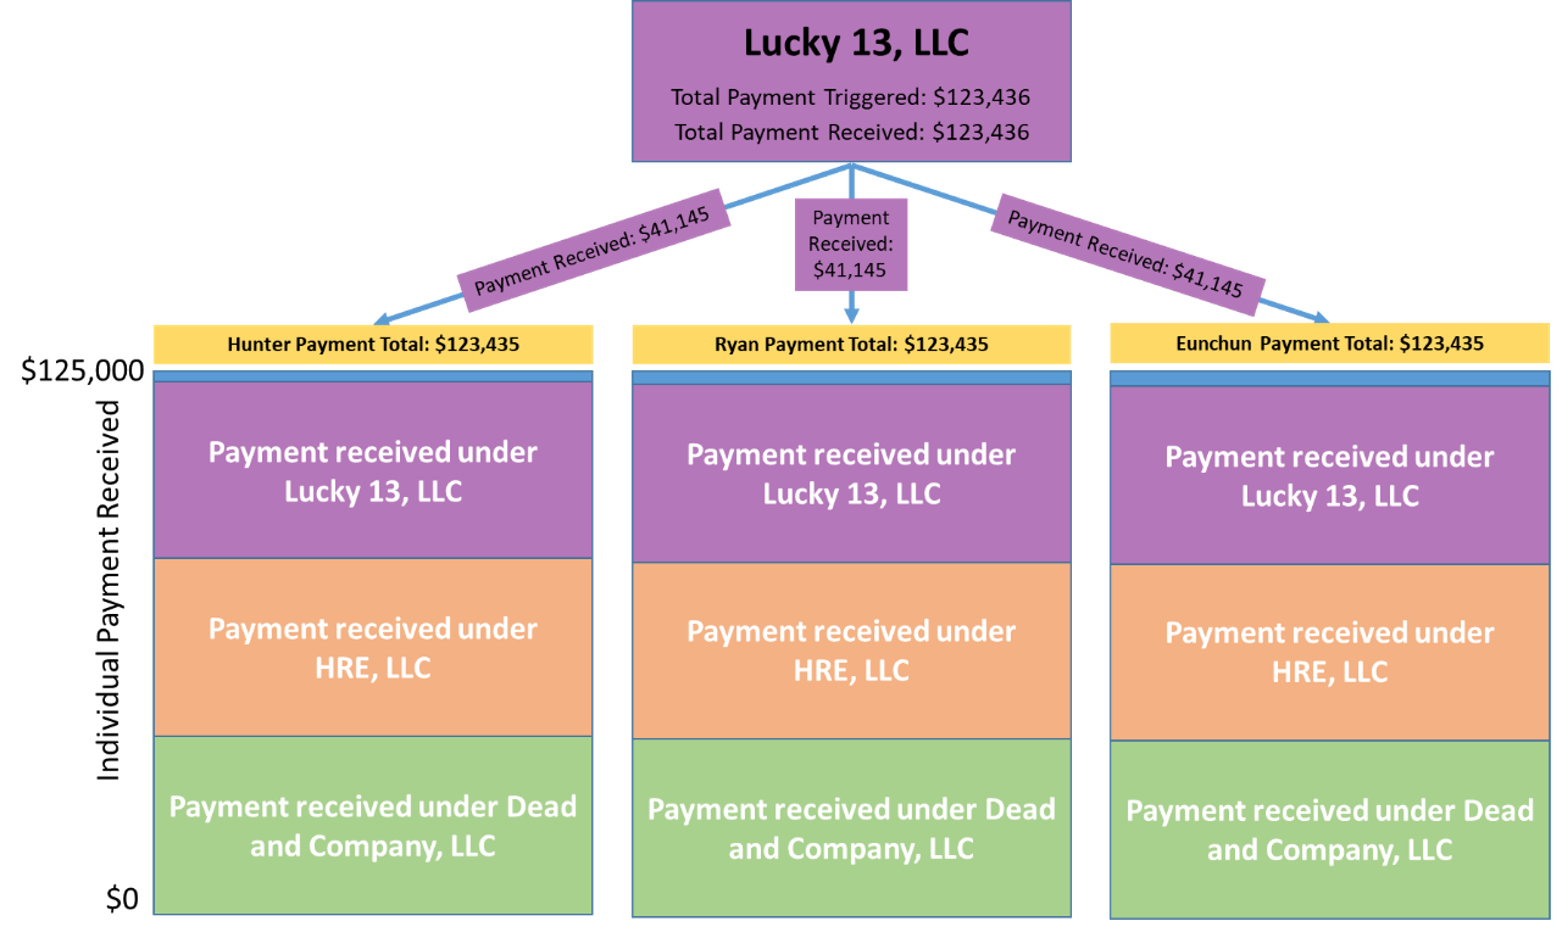
    If it makes sense within the operation of the business, the three members of Dead and Company, LLC could choose to reallocate the 2,800 base acres to different entities to increase their individual payment received and stay within the $125,000 individual payment limit. This could be done by creating two new entities, HRE, LLC and Lucky 13, LLC, which have the same three members as Dead and Company, LLC. The three individuals are now members of three different LLCs, each containing 933 acres, or an even share of the 2,800 base acres, resulting in a total payment per entity of $123,436, below the $125,000 payment limit per LLC. While there are three entities that have separate payment limits, one should note that the three entities have to maintain separate sets of books.  In other words, while setting up additional entities is relatively easy with the help of a lawyer, the additional time associated with the requirement to maintain separate records for each farm also needs to be taken into consideration.  In addition, while the math on this exercise is fairly easy, there are significant rules and procedures that have to be followed when reorganizing to avoid the appearance of reorganizing to take advantage of payment limit rules.  Figure 2 shows how the forgone payment due to current payment limit rules increases per individual as each person receives an additional payment from a different entity. In short, each individual receives $41,145 in three PLC payments under Dead and Company, LLC, HRE, LLC, and Lucky 13, LLC.

    Figure 2. Payments to each member under base reallocation from Dead and Company, LLC to Lucky 13, LLC and HRE, LLC
    The 2014 farm bill provides a unique setting for studying the impact of payment limits on entity creation. First, producers had to make a one-time decision in 2014 for the commodity program to place their base acres in (i.e., ARC or PLC), which would not change for the life of the 2014 farm bill. Second, for a given crop year, all entities would receive a PLC payment if a payment was triggered for a crop in which base acres were enrolled. Third, historical plantings directly tied to the land determine the number of base acres, and enrolled entities are free to dissolve and be created. Therefore, while these conditions do not allow for reallocation to a new program election (i.e., switching from PLC to ARC), they can allow for base acreage reallocation to different entities.

    While considering the individual payment limit itself is important in discussions that include higher statutory reference prices, it is also important to consider the number of entities allowed to receive payments. This is because of rules such as the “3-entity-rule” which existed prior to the 2008 farm bill, which repealed this rule. Understanding why a producer would create a new farm entity and how this can be done in practice is important as increasing farm size could limit the whole farm protection provided by commodity program payments and threaten farm income stability.

    References

    Congressional Research Service, 2020, U.S. Farm Programs: Eligibility and Payment Limits, https://crsreports.congress.gov/product/pdf/R/R46248. Accessed 22 May 2024. 

    Ferrell, Shannon L., Tiffany Dowell Lashmet, and Bart L. Fischer. “Paved with Good Intentions: Unintended Impacts of Farm Bill Payment Limitations.” Southern Ag Today 4(19.4). May 9, 2024. Permalink


    [1] This value was taken from USDA-FSA data files and could be converted to bu/ac using a conversion factor of 2.22. In this case, this same yield in bu/ac is 140 bu/ac.

    [2] This value is found by multiplying the total base acreage, the payment yield, and the payment rate.


    Biram, Hunter, Ryan Loy, and Eunchun Park . “Commodity Program Payment Limits, Farm Entity Creation, and Implications for the Next Farm Bill.” Southern Ag Today 4(32.3). August 7, 2024. Permalink
  • Dairy Cow Slaughter Posts Strong Rebound

    Dairy Cow Slaughter Posts Strong Rebound

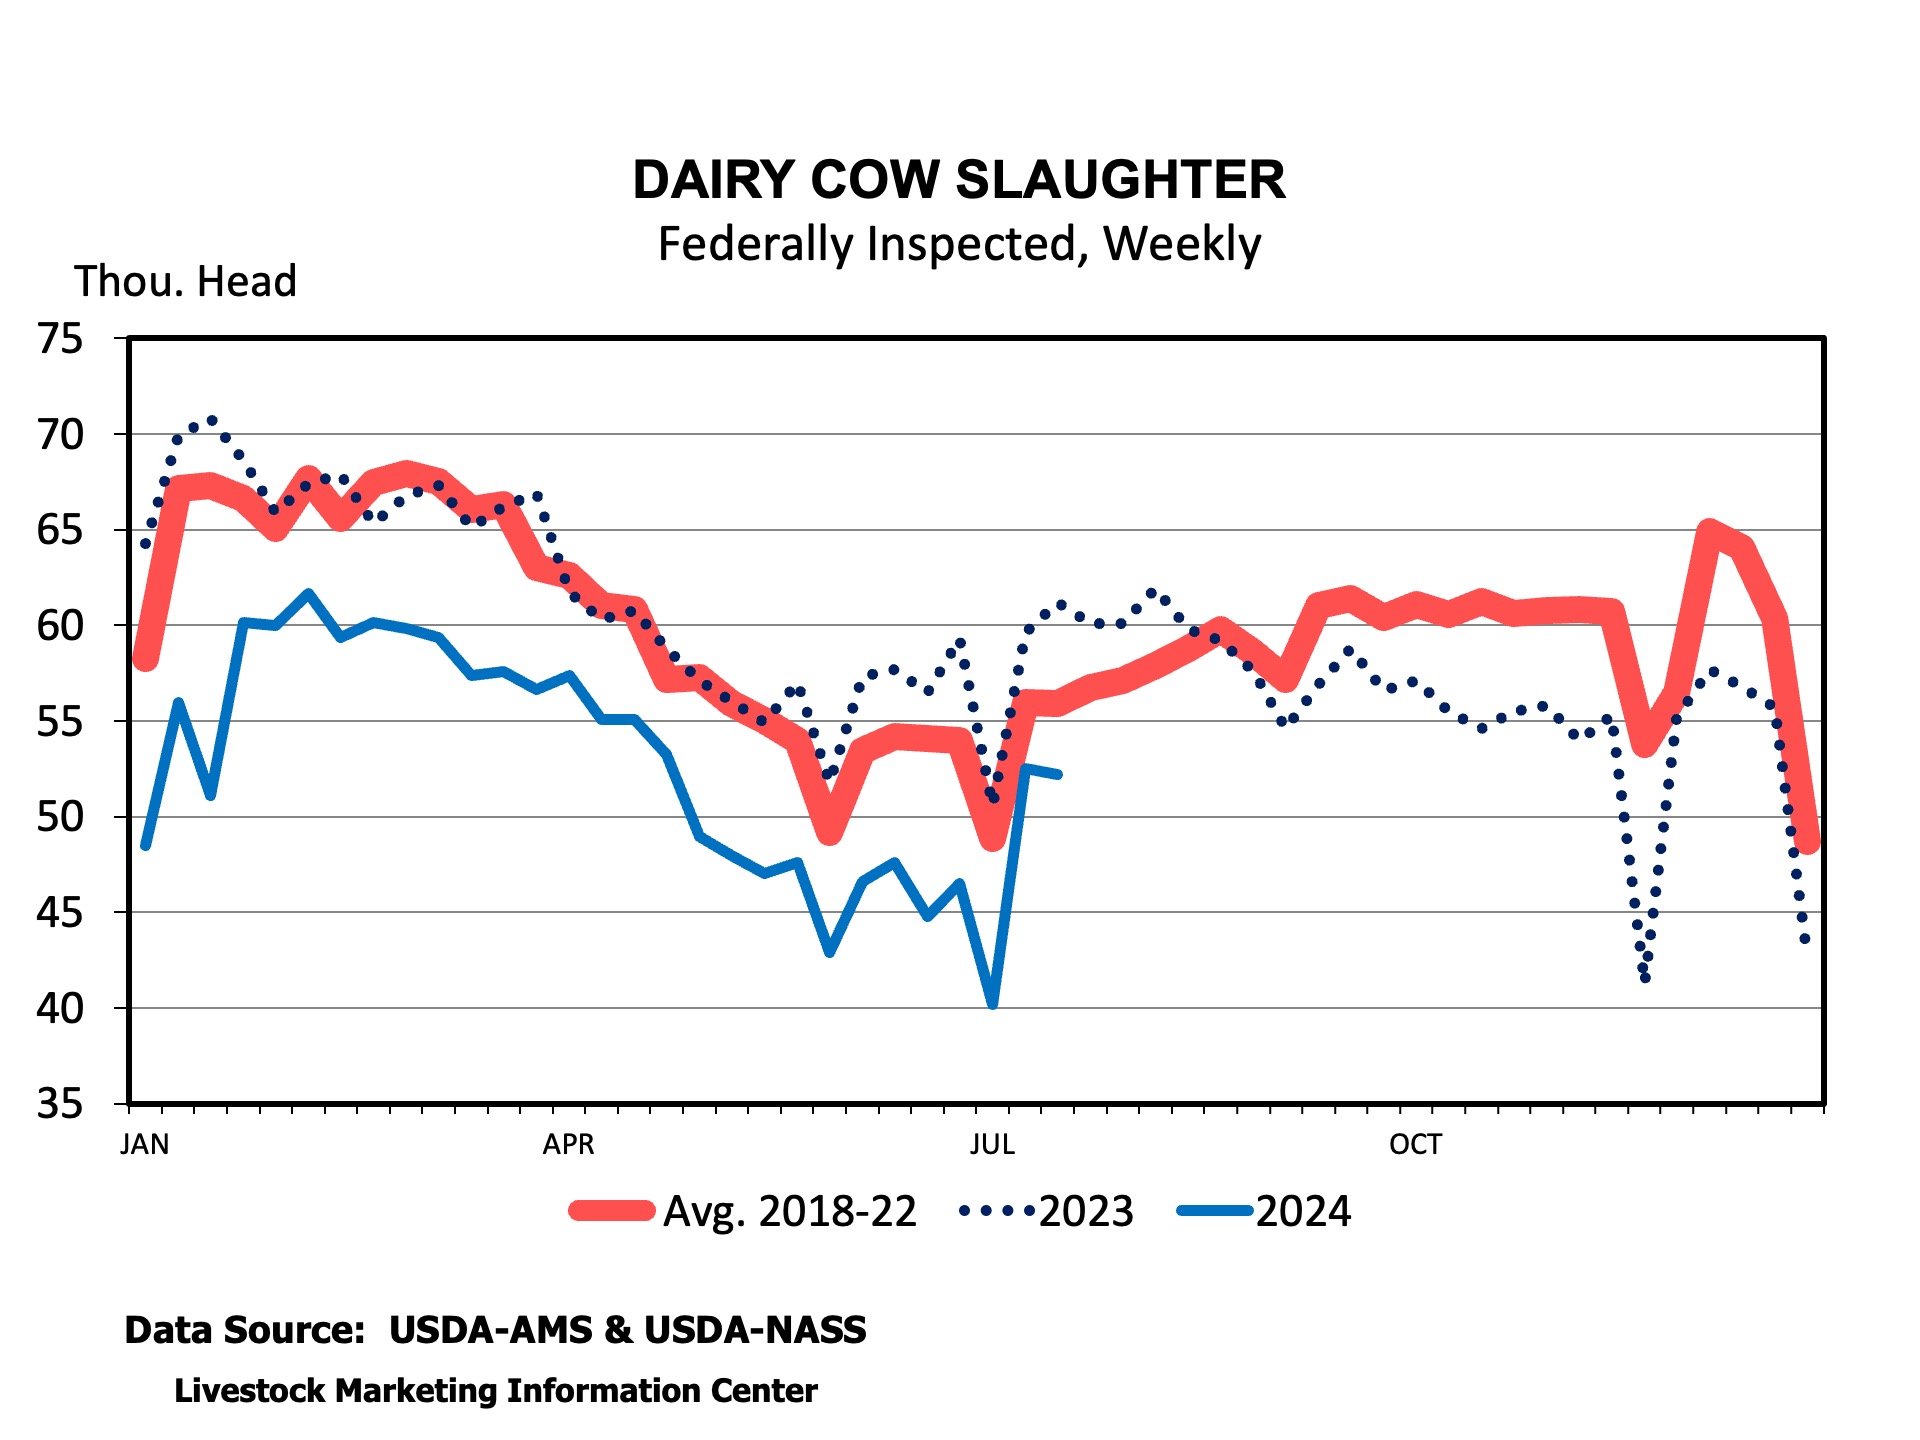
    Dairy cow slaughter rebounded sharply in the two weeks after the holiday shortened fourth of July week.  It’s pretty normal for dairy cow slaughter to climb seasonally after early July but, the magnitude of this weekly increase is larger than usual.  Even with the rebound in culling, weekly slaughter remained smaller than last year and the average of the last 5 years.  The trend of smaller dairy cow culling is likely to continue the rest of the year, even though culling may increase seasonally.  

    Over the last 8 weeks dairy cow culling is 18 percent smaller compared to the same time period last year.  Dairy cow slaughter is reported by region.  Region 4 (Southeastern states), region 6 (Texas, Arkansas, and Louisiana), and region 3 (Virginia and Pennsylvania) include Southern states.  Dairy cow slaughter in regions 3 and 4 are down 10 percent and 8 percent, respectively.  Slaughter in region 6 is down 32 percent.  Regional differences in slaughter rates continue to indicate shifts in regional milk production with faster than average culling rates in the South but slower culling in the Southern Plains.  On an interesting note, region 8, which includes Colorado and the Dakotas, has reported larger dairy cow slaughter this year than last year and is the only region to do so.  Dairy cow culling is likely to remain relatively low in coming months due to fewer dairy cows in total, relatively few replacement heifers, and rising milk prices.

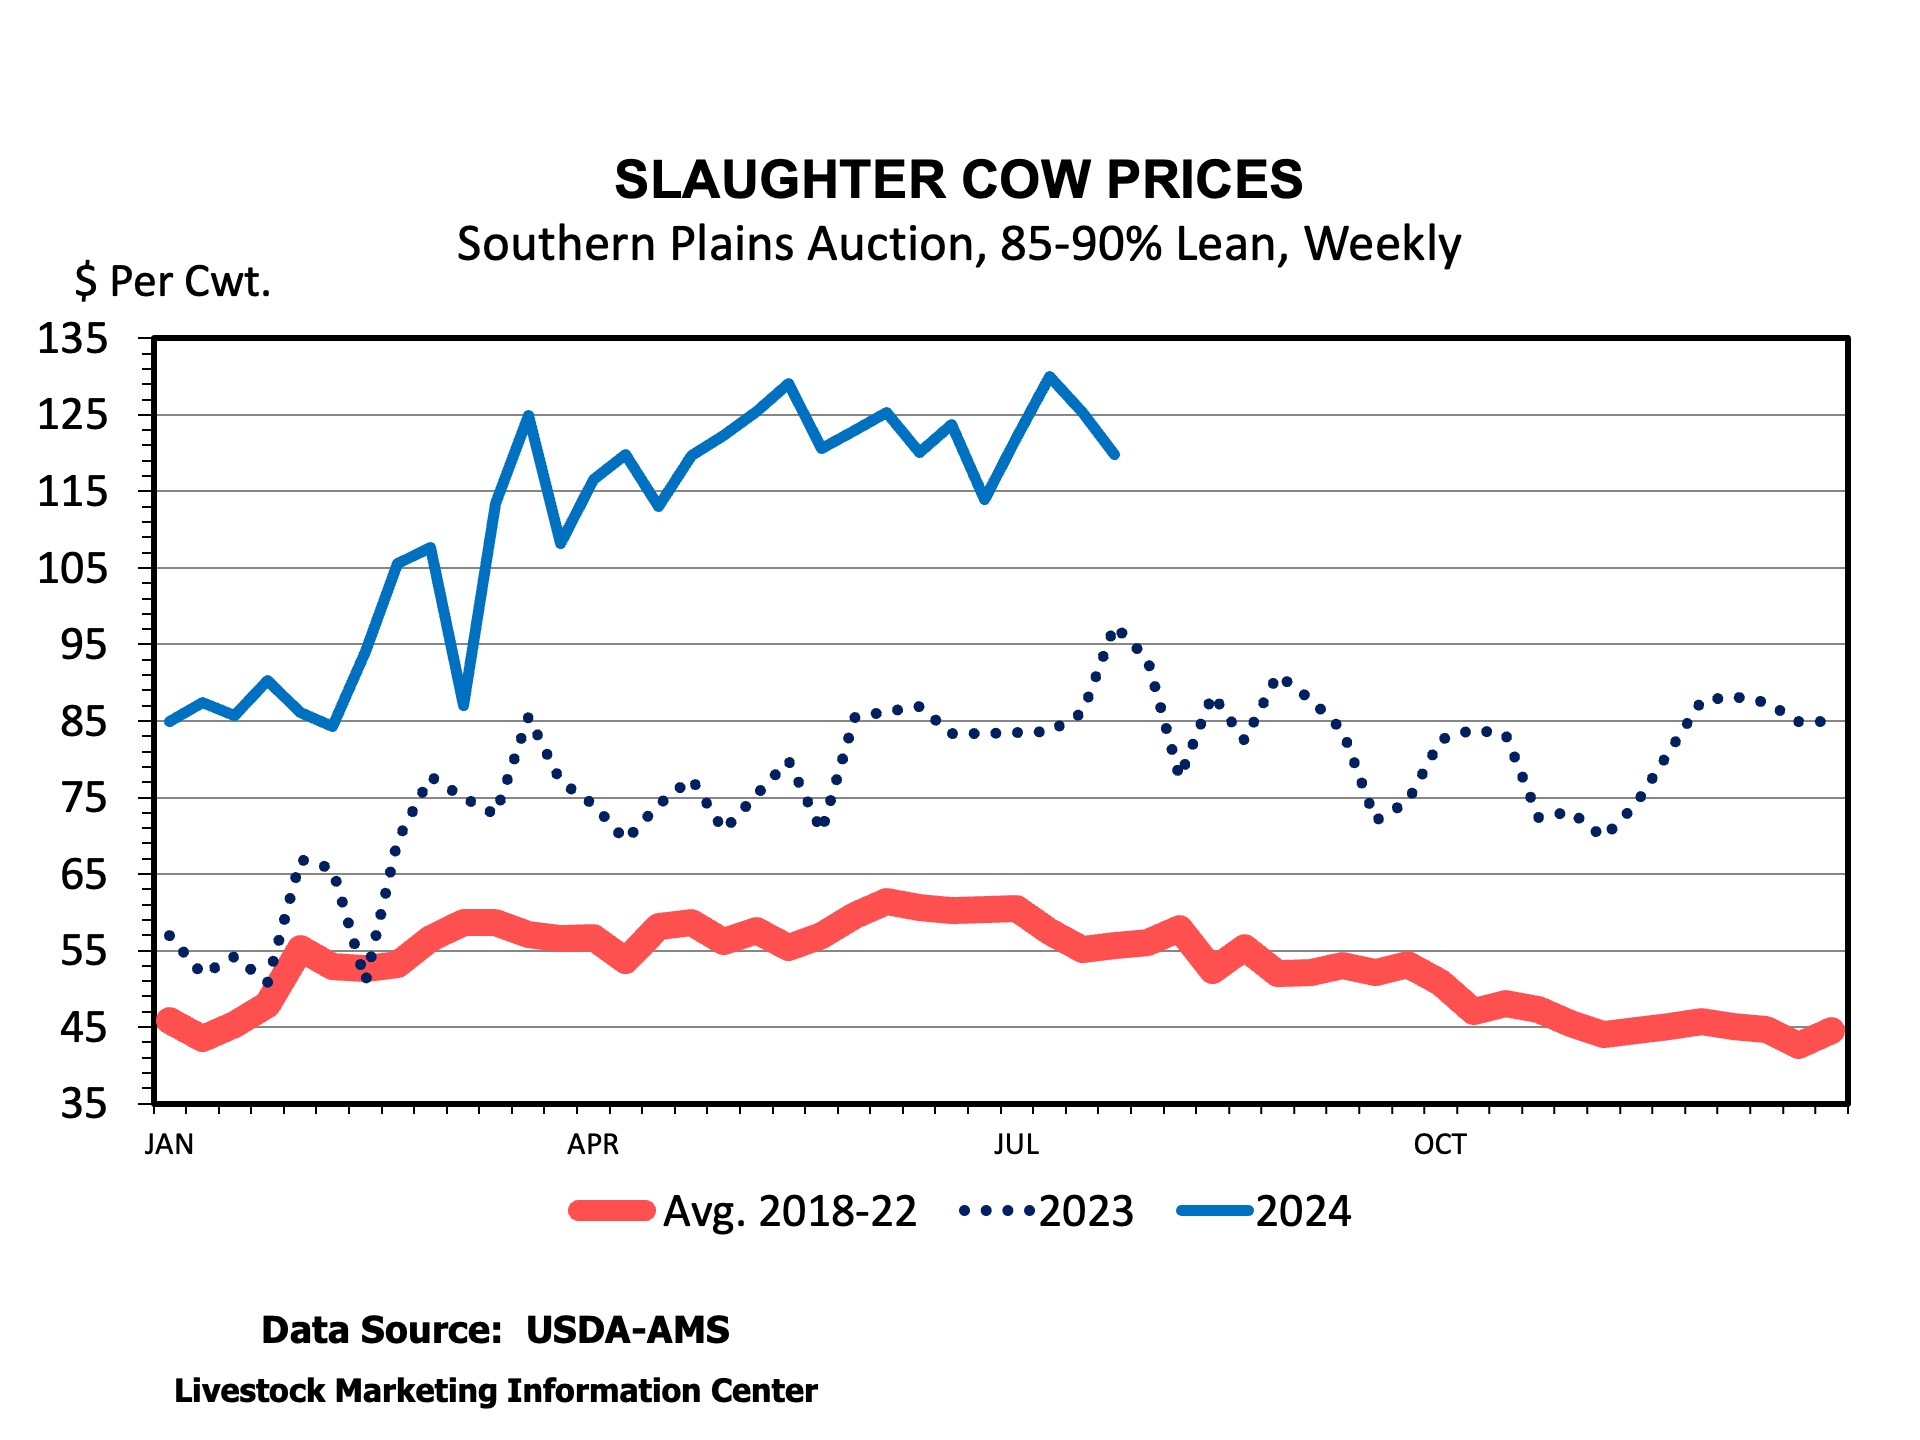
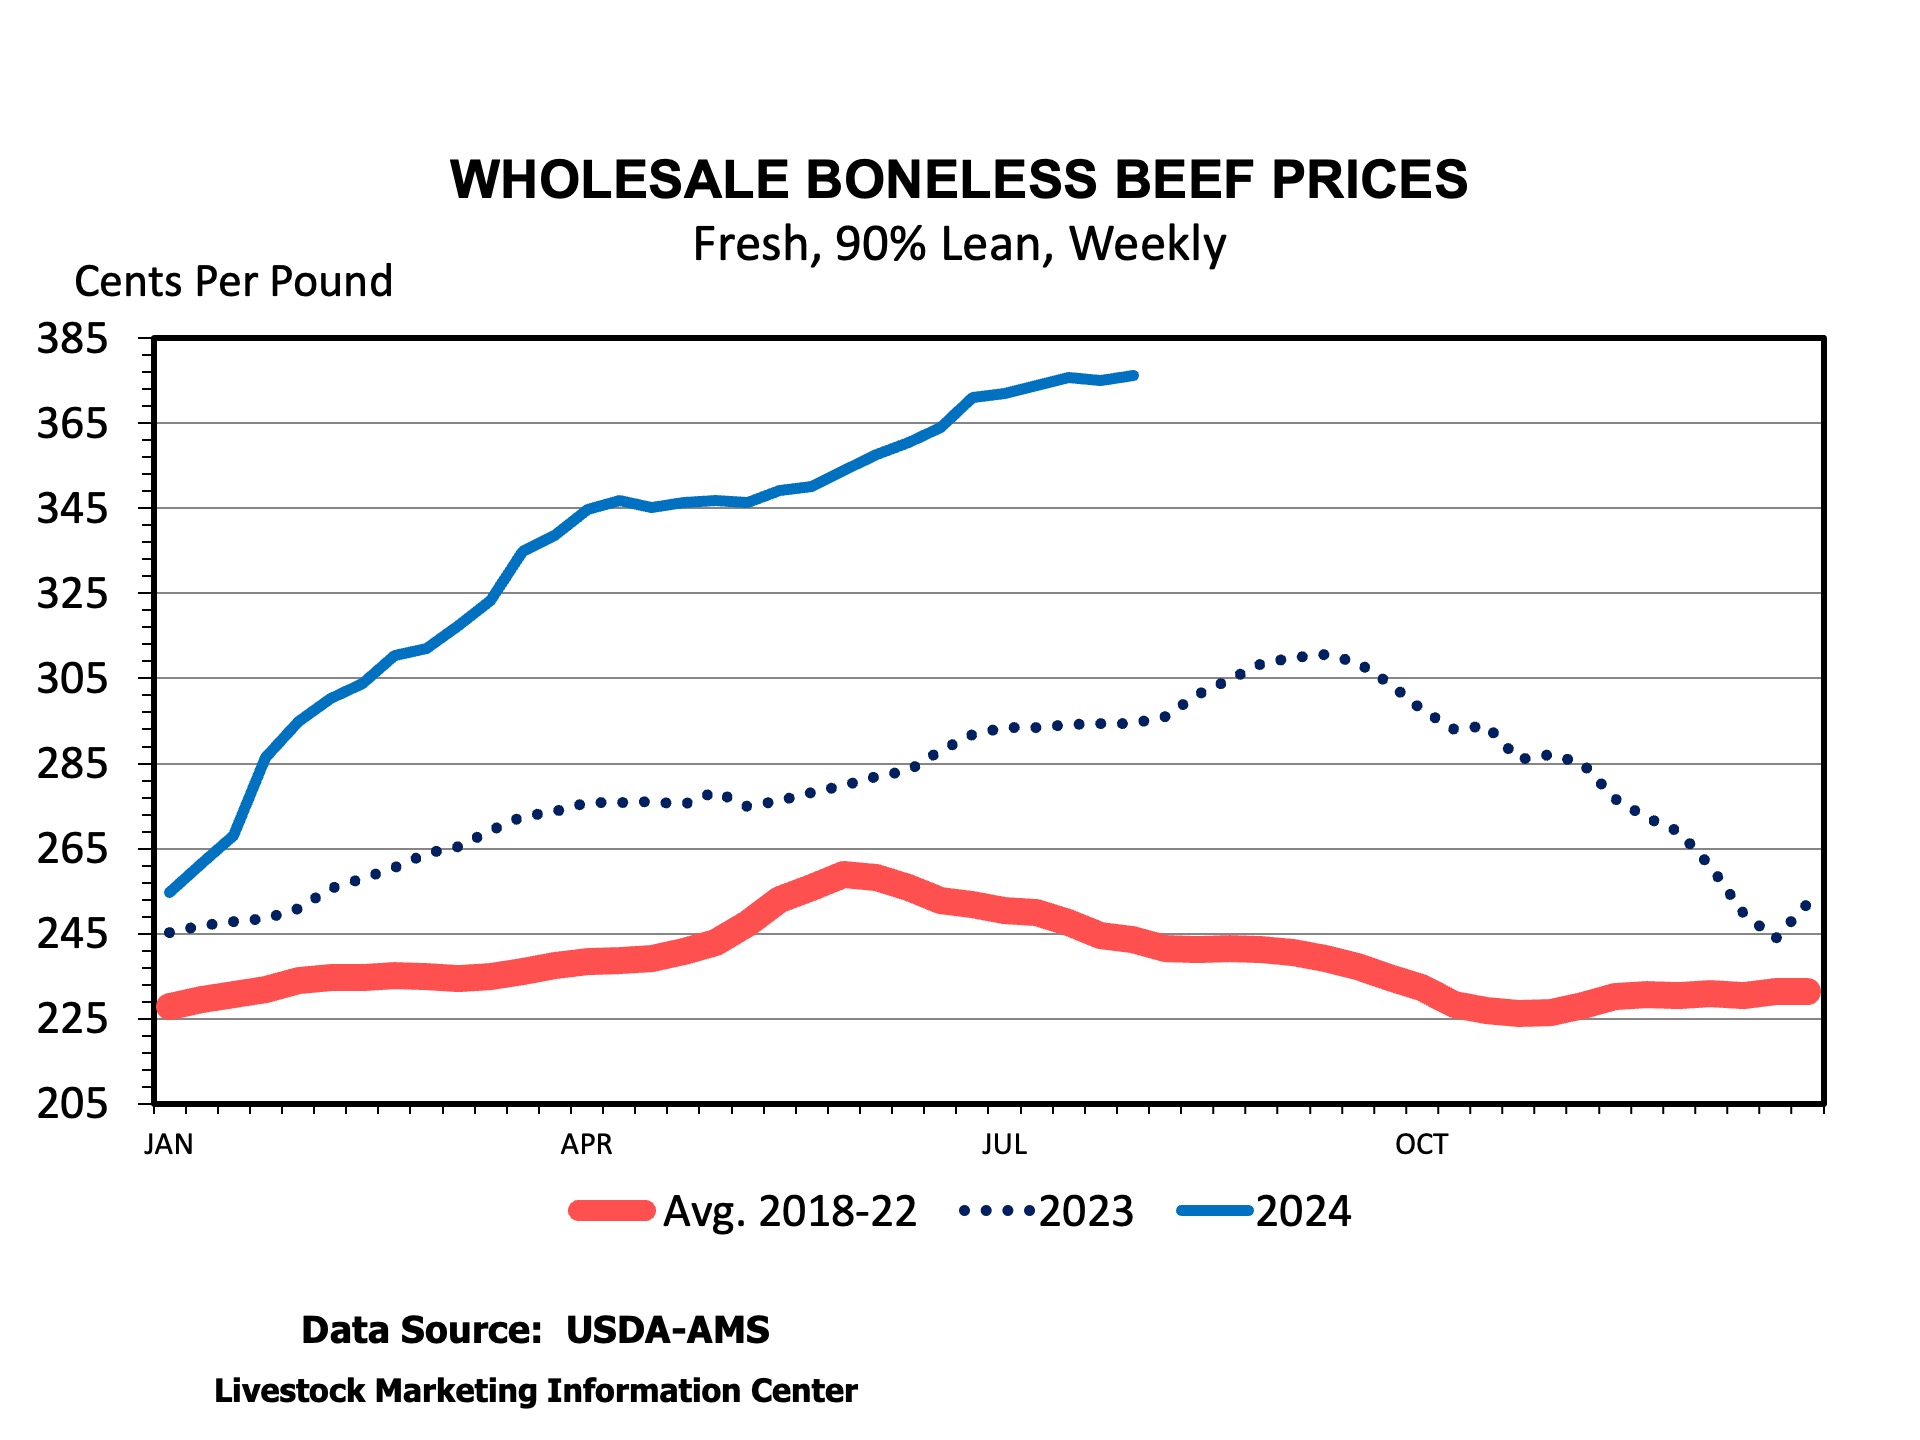
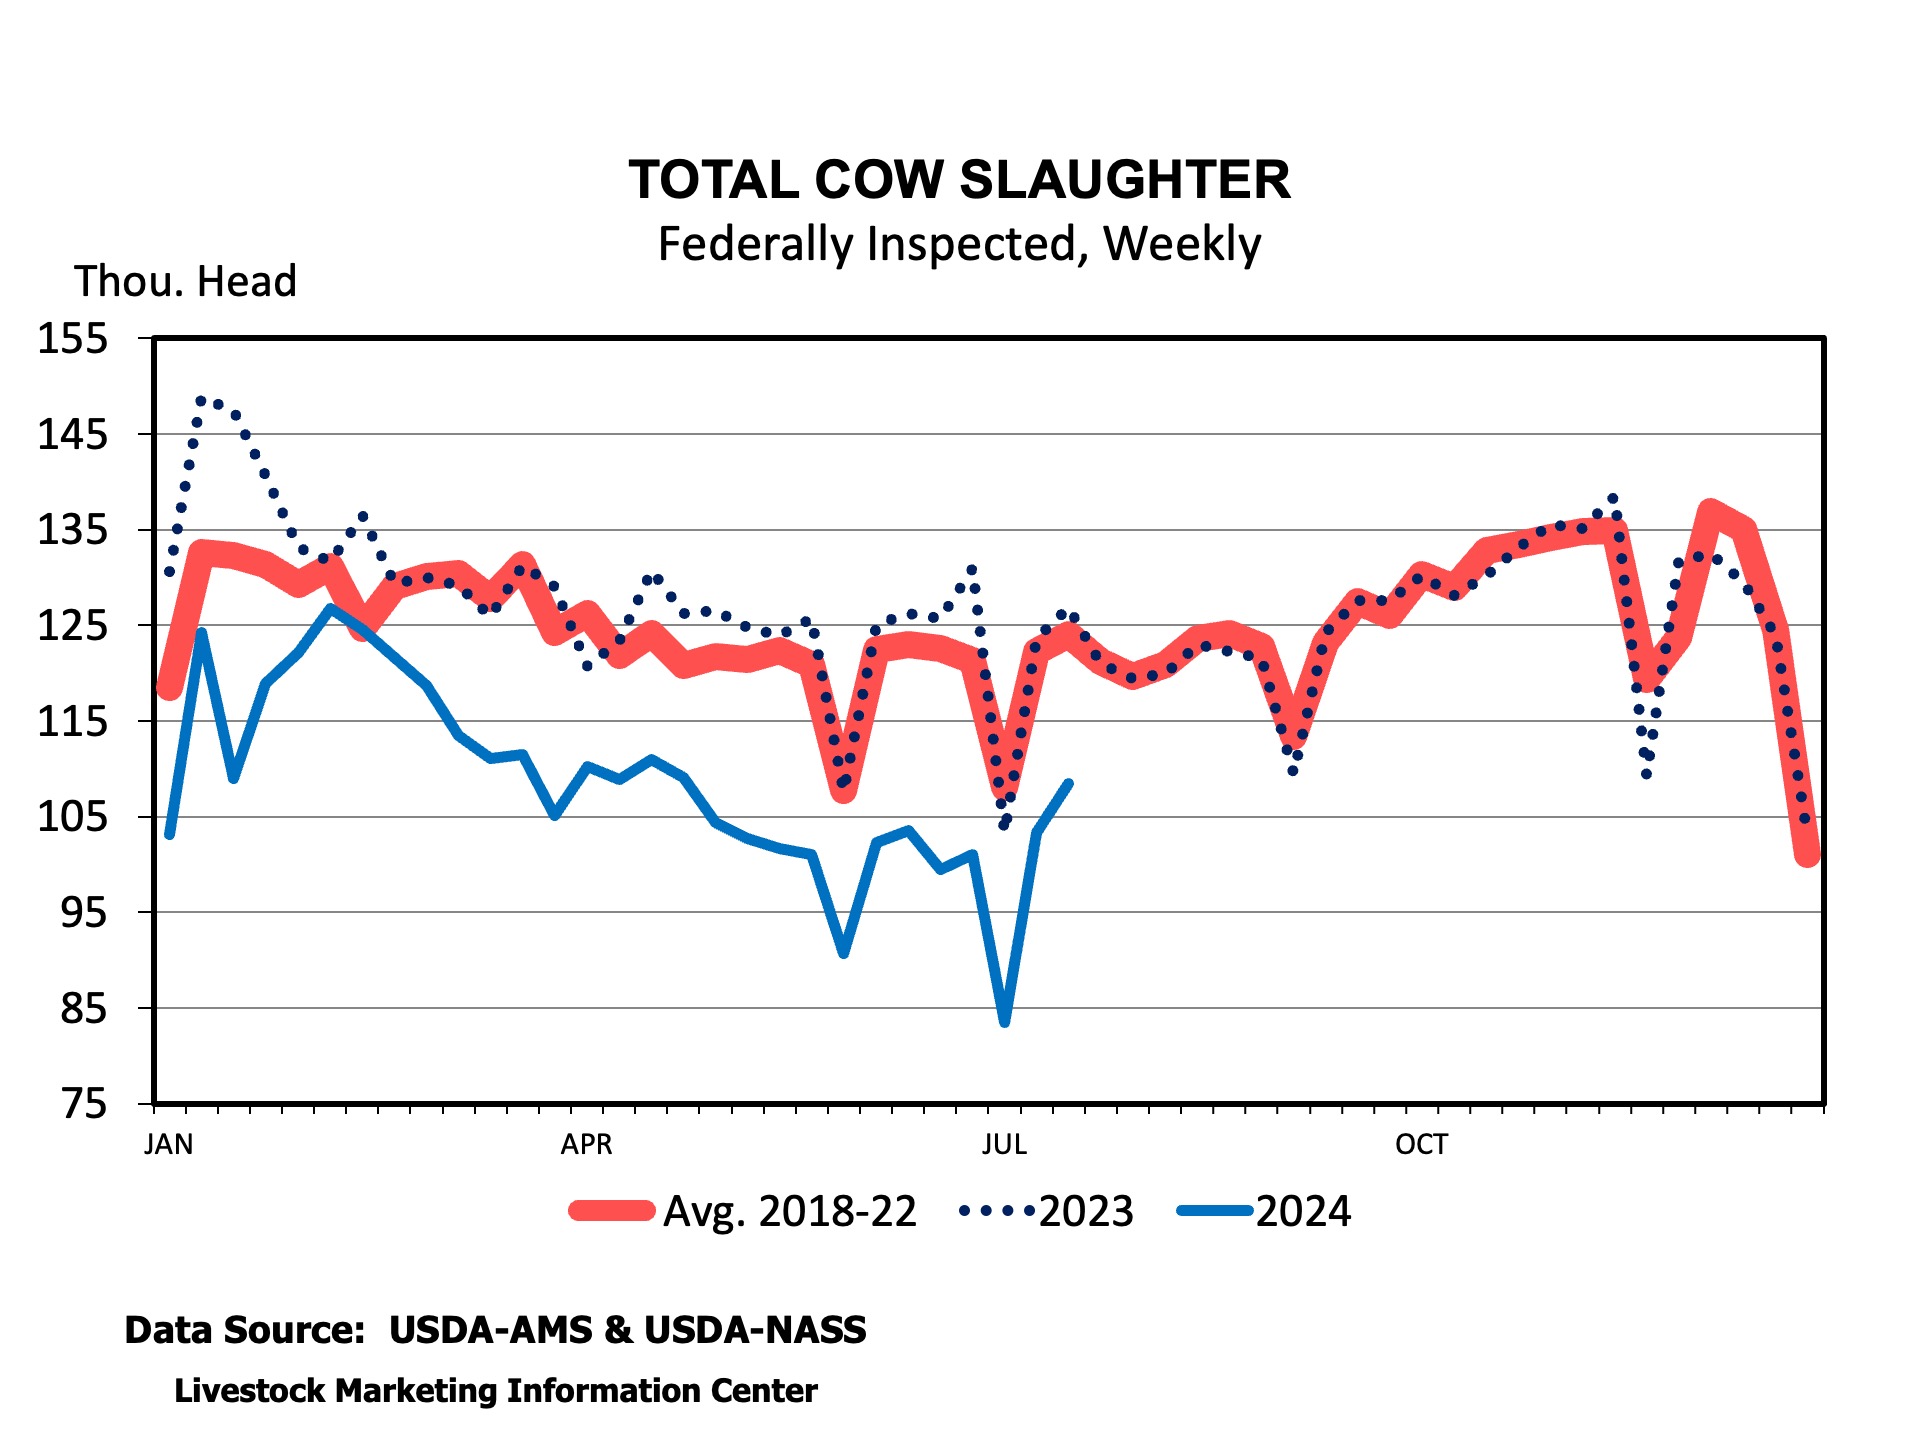
    The overall decline in dairy cow slaughter is further supporting cull cow prices across the South and the country.  Dairy cow slaughter has made up, on average, about 48.6 percent of all cow slaughter over the last decade.  This year dairy cow slaughter represents 48.3 percent of all cow slaughter.  Reduced dairy cow culling coinciding with reduced beef cow slaughter is further cutting supplies of lean beef.  Wholesale boneless 90 percent lean beef hit a new high of $3.76 per pound last week.  The cow-beef cutout is in record territory at over $290 per cwt.  Lean slaughter cows at auction continue to hover around $125 per cwt.  The lack of dairy replacements and need for replacements by some has bred dairy cow and heifer prices up from $300 to $600 per head in Kentucky dairy auctions.  

    Overall, reduced dairy cow culling is supporting cull cow prices.  Reduced total cow culling is putting additional strain on cow packing plants across the region.   

    Anderson, David. “Dairy Cow Slaughter Posts Strong Rebound.” Southern Ag Today 4(32.2). August 6, 2024. Permalink

  • GDP and the Farm Economy

    GDP and the Farm Economy

    Gross Domestic Product (GDP) is likely the most closely watched and commonly cited economic indicator. GDP is “…the market value of all goods and services produced within a country in a given period of time” and is “…the best single measure of a society’s economic well-being” (Mankiw, 2007). While tracking and forecasting GDP is important for businesses, labor, investors, policymakers, and economists, it has important implications for the farm economy as well.  GDP can be thought of as how well off your customers are to buy the things you produce. 

    The International Monetary Fund uses GDP to track global economic growth by country and country groups. Real GDP growth (adjusted for inflation) has exhibited interesting trends since 1980 that have implications for grain markets (Figure 1).  From 1980 to 2000, there was very little difference between growth rates of GDP between advanced economies (e.g., U.S., Japan, most of Europe, Canada, Australia, U.K), and emerging market and developing economies (e.g., Brazil, Russia, India, China, Mexico). Advanced economies grew at an average rate of 2.9%, with emerging market and developing economies growing by 3.5%. 

    Figure 1. Global Economic Growth, real GDP, 1980-2029

    In the early 2000s, world economic growth rates began to be driven by emerging economies. Gains in productivity, rising per capita incomes, and a growing middle class have made many emerging economies more competitive as suppliers to world export markets and increased the size of their domestic markets (Kose and Prassad, 2010). From 2000 to 2019, the growth rate of advanced economies was 1.9%, with emerging and developing economies growing by an average of 5.5%. 

    Since 2020, economic growth rates in emerging economies have slowed. Global conflicts, trade tensions, inflation, and rising interest rates are a few of the factors cited for a slowdown in economic growth, factors that hit emerging and developing economies especially hard (IMF, 2024).  Estimates for 2020-2024 show advanced economies growing by an average of 1.5% and emerging and developing economies by 3.6%. Including forecasts by the IMF for the next five years, average GDP growth from 2020-2029 is projected to be 1.7% for advanced economies and 3.8% for emerging and developing. 

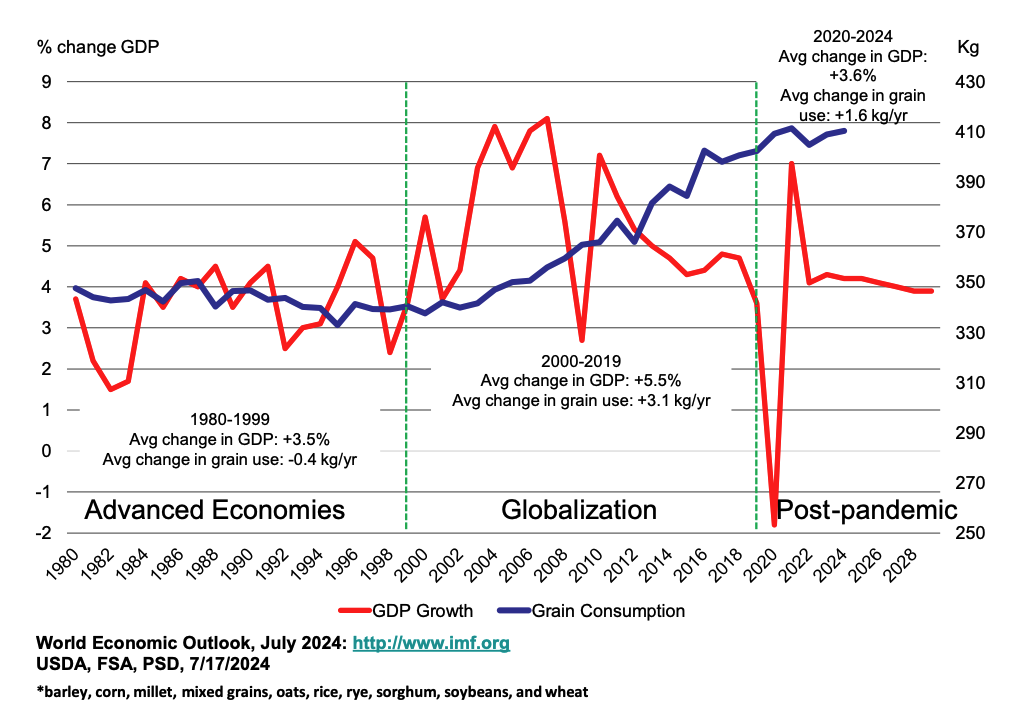
    Figure 2. Real GDP growth in emerging and developing economies and world per capita grain consumption   

    Trends in world grain consumption have shown significant changes since 1980 as well (Figure 2; blue line).  In 1980, consumption of barley, corn, millet, mixed grains, oats, rice, rye, sorghum, soybeans, and wheat was 348 kg per person.  By the end of the 1999/2000 marketing year, that number was down to 340 kg. Then, per capita consumption began to grow, reaching over 400 kg by 2019.  With increasing protein in diets and grain for fuel, the most recent estimate of world per capita grain consumption in 2024 is 410 kg. 

    An overlay of GDP growth in emerging and developing economies and world per capita grain consumption shows the relationship between these factors (Figure 2). From 1980-1999, a period with little difference between growth in advance economies and emerging economies, GDP grew by 3.5% while grain use per capita fell by 7 kg (-0.4 kg/yr).  From 2000-2019, an era of globalization and expanding economic impact in emerging economies with GDP on the rise, grain use increased by 62 kg (+3.1 kg/yr). Since 2019, post-pandemic, with slower rates of growth in GDP, grain use has increased by 8 kg (1.6 kg/yr), about half the rate of growth of the previous 20 years. 

    Per capita grain consumption is one measure of global grain demand. Even if per capita consumption is unchanged, growth in the population base would still mean an increase in grain consumption. In 1980, the world population was increasing by 1.6% per year. In 2000, population growth was 1.3%. That growth rate is down to 0.9% in 2024 and forecast to be 0.8% by 2030, half the rate of growth in 1980 (USDA, ERS, 2024).  

    Important to levels of grain use are patterns of global economic growth, especially GDP growth in emerging and developing economies. As growth rates in this region slow down over the next decade, per capita grain use may yet increase, but at a slowing rate. 

    The combination of slowing population growth and a slowdown in economic growth may alter recent patterns in world grain use.  That means gains in productivity (weather permitting) have a higher likelihood of exceeding gains in use. When that happens, that is a recipe for lower prices. 

    References:

    International Monetary Fund (IMF). World Economic Outlook, July 2024, http://www.imf.org.

    Kose, M.A. and E. Prassad. “Emerging Markets Come of Age”, Finance and Development, Vol. 47, No 4, December 2010.

    Mankiw, Gregory. Brief Principles of Macroeconomics, Fourth Edition, Thompson South-Western, Mason, Ohio, 2007.

    USDA, Economic Research Service. “International Macroeconomic Data Set”, https://www.ers.usda.gov/data-products/international-macroeconomic-data-set/.

    USDA, Foreign Agriculture Service. “Production, Supply, and Distribution (PSD) database”. https://apps.fas.usda.gov/psdonline/app/index.html#/app/home.


    Welch, J. Mark. “GDP and the Farm Economy.Southern Ag Today 4(32.1). August 5, 2024. Permalink

  • Texas v. New Mexico

    Texas v. New Mexico

    On June 21, 2024, the United States Supreme Court issued an opinion in the long-running dispute between Texas and New Mexico over the 1938 Rio Grande Compact. The Court, in a 5-4 decision, held that the federal government could block an agreement between Texas and New Mexico to resolve their dispute. Although the compact relates to the river, the dispute centers on groundwater pumping. 

    Texas filed suit against New Mexico in 2013, alleging that excessive groundwater pumping in New Mexico deprived Texas of its fair share of Rio Grande water under the compact.  Note that lawsuits between states originate in the United States Supreme Court. The Court appoints a Special Master to hold hearings and make recommendations to the Court, which ultimately decides the issues.

    Unlike most compacts, the Rio Grande Compact requires New Mexico to deliver water not to the New Mexico/Texas border, but to Elephant Butte Reservoir, a federal project about 100 miles north of the border. Texas alleged that groundwater pumping along the river between the Elephant Butte Reservoir and the state line took water from the river that rightfully belonged to Texas.  

    The federal government filed a motion to intervene in the litigation in 2014, alleging that its interest in the federal project at Elephant Butte allowed intervention to protect the government’s rights and obligations. The federal government, through Downstream Contracts, was required to deliver water to an irrigation district in New Mexico, and one in Texas. The Court allowed the federal government to intervene, a relatively rare occurrence, because of the unique circumstances of the case and the fact that its interests aligned with those of Texas.

    Texas’ lawsuit focused on increased groundwater pumping between the Elephant Butte Reservoir and the state line. While the federal government had operated the reservoir based on data from 1951 to 1978 (“D2 data”), a time period where groundwater pumping increased significantly in New Mexico, Texas asked for allocations to be based on 1938 data, when there was much less groundwater pumping in New Mexico. The United States, which had operated based on the later for decades, did not request a change.

    After 10 years of hearings and litigation, Texas and New Mexico agreed on a consent decree, settling the issues between the states. The agreement continued water allocations based on the D2 period, which favors New Mexico, but measured the water delivery at El Paso, which favors Texas. Complex accounting measures in the agreement ensured that Texas would receive the state’s fair share of water. 

    However, the federal government objected to the agreement, claiming that its interests in administering the water project were threatened. In addition, for the first time, the federal government claimed that the water allocation should be based on 1938 levels of groundwater withdrawals. New Mexico estimates that a forced reduction in groundwater withdrawals to 1938 levels would mean a loss of 50,000 jobs and 10% of the state’s gross domestic product.

    Justice Jackson, joined by Chief Justice Roberts and Justices Sotomayor, Kagan, and Kavanaugh wrote the majority opinion. The majority found that the federal government had independent claims that would be resolved by the agreement. Given that the government was now a party, the agreement could not resolve the government’s interests without its consent. Since the government’s interests were aligned with those of Texas, and Texas had requested a 1938 baseline, the government was deemed to make a similar request. Given the close connection between the compact, the federal project and the irrigation contracts, the government must agree to any resolution of the case.

    Justice Gorsuch, who also authored the Court’s 2018 unanimous opinion allowing the United States to intervene, wrote the dissenting opinion, and was joined by Justices Thomas, Alito, and Barrett. The dissenters summarized their position as follows:

    The Court’s decision … defies 100 years of this Court’s water law jurisprudence. And it represents a serious assault on the power of States to govern, as they always have, the water rights of users in their jurisdictions. The Special Master issued a detailed 115-page report laying all this out. His views were wise, his recommendations sound, and, respectfully, we should have done as he suggested.

    The dissenters opine that the Court denied the entry of the consent decree “[b]ecause the federal government demands as much.” In addition, the federal government could not assert these claims alone in the Court but would have to file a lawsuit in the lower court.

    Given the number of federal water projects in the United States, and increasing disputes between surface water and groundwater users, this decision could allow the federal government to take control of groundwater allocations in a large number of situations. Groundwater users generally lose these disputes because groundwater withdrawals generally began after surface water withdrawals. Since the surface water users have seniority, surface water withdrawals receive priority. The decision may cause large cuts in groundwater withdrawals in New Mexico, as well as put groundwater users in jeopardy wherever federal water projects exist. As in this case, the competing uses will likely include large agricultural users. New Mexico and Texas will now have to start back at square one.

  • Will We See a New Farm Bill This Year?

    Will We See a New Farm Bill This Year?

    The U.S. House of Representatives departed Washington, DC, for the August recess last week, and the Senate is currently wrapping up its business. When Congress returns in September, most of the legislative agenda prior to the Presidential election will be focused on funding the government past September 30, 2024. This naturally raises the question: will we see a new farm bill this year?

    We can look to the past 10 farm bills (over the course of the last 50 years) for guidance. As noted in Table 1, only 2 of the last 10 farm bills were enacted during presidential election years (1996 and 2008 Farm Bills), and both of those were signed into law before Congress left town for the August recess. The remaining 8 farm bills were enacted in the Congress following the Presidential election, with 2 of those (1990 and 2018 Farm Bills) coming in the lame duck session following the midterm elections.

    Table 1. Enactment of the Past 10 Farm Bills

    Enacted during a…Farm Bill (Month Enacted)
    Year Following Presidential Election:1996 Farm Bill (April)
    2008 Farm Bill (June)
    Year Following Presidential Election:1973 Farm Bill (August)
    1977 Farm Bill (September)
    1981 Farm Bill (December)
    1985 Farm Bill (December)
    Midterm Election Year:1990 Farm Bill (November*)
    2002 Farm Bill (May)
    2014 Farm Bill (February)
    2018 Farm Bill (December*)
    Year Following Midterm Election:None
    *Enacted during a lame duck session of Congress.

    While history does not bode well for wrapping up a farm bill this year (i.e., none of the last 10 farm bills were completed immediately prior to or following a presidential election), it’s not out of the realm of possibility. So, what would it take to get it wrapped up? Following are the key issues holding up completion: 

    • Improving the farm safety net. As we’ve said for the last two years – and there seems to be growing agreement on this point – there is no point in doing a farm bill absent improvements to the farm safety net, namely improving the Reference Prices in the Price Loss Coverage (PLC) program and the loss thresholds in the Agriculture Risk Coverage (ARC) program. With that said, there is still disagreement on the extent of the improvements and how to pay for them.
    • Commodity Credit Corporation (CCC). Discretionary use of the CCC has long been a sticking point for lawmakers, but that concern has grown dramatically over the course of the last two Administrations, where the CCC has been used to deliver tens of billions in aid to agricultural producers and, more recently, climate-smart programming. Many in Congress would like to restrict the Secretary’s use of the CCC, returning decisions about funding to Congress. Doing so would save money that could be used to offset improvements to the farm safety net. While we discussed CCC funding in detail last Fall, the Congressional Budget Office (CBO) will officially weigh in on this topic tomorrow when they release the cost estimate for the House Agriculture Committee-passed farm bill. 
    • Inflation Reduction Act (IRA). While there seems to be growing consensus over bringing the IRA conservation funding inside of the farm bill, there are ongoing disagreements about whether that funding should continue to be restricted to climate-smart practices. Some lawmakers would like to put those decisions – like most other conservation decisions – in the hands of local decisionmakers.
    • Thrifty Food Plan (TFP). There is still considerable frustration among most Republican lawmakers over the Biden Administration’s roughly $250 billion unilateral increase to the Supplemental Nutrition Assistance Program (SNAP) via adjustments to the TFP in 2021. Similar to the discussion on the CCC, many lawmakers would like to return decisions about future increases in SNAP spending to Congress.

    While there are certainly disagreements, in our view, the list above is by no means insurmountable. While there is very little legislative runway prior to the election, we do think it’s possible to wrap up the farm bill during the lame duck session, perhaps as part of a supplemental. Why?

    A recent hearing before the House Agriculture Committee highlighted the mounting concerns about financial conditions in the countryside. With sustained high input costs and prices that continue to collapse, growers are facing a precarious situation as they plan for the 2025 crop year. That dynamic – coupled with natural disasters like the wildfires in the Texas panhandle – are triggering alarm bells and resulting in calls for additional disaster assistance.

    Congress has a lot on its plate going into a new Congress. For example, the debt limit – which dominated much of the conversation in the first half of the current Congress – is currently suspended through January 1, 2025. In addition, several major provisions from the Tax Cuts and Jobs Act of 2017 – including several that are important to the agricultural community – are set to expire at the end of next year. Rather than punting the farm bill into the new Congress and relying on another year of disaster assistance, Congress could choose to reauthorize the farm bill in the lame duck session – improving the farm safety net and side-stepping the need for disaster assistance – all the while keeping the farm bill out of what will already be a very crowded legislative calendar in 2025.


    Fischer, Bart L., and Joe Outlaw. “Will We See a New Farm Bill This Year?Southern Ag Today 4(31.4). August 1, 2024. Permalink