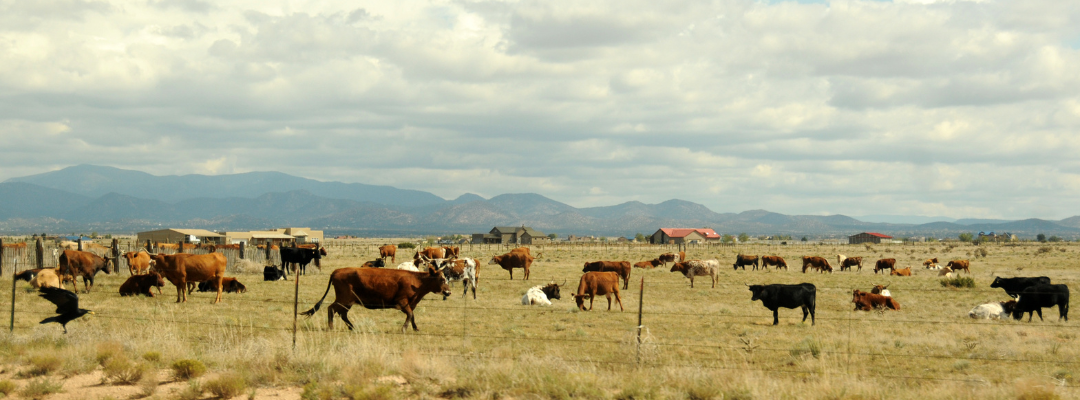
The July Cattle Inventory report confirmed another year of herd liquidation. July beef cow inventory totaled 30.4 million, down 2 percent from the previous year. It also appears that very few are looking to expand their herds with replacement heifers down 3.5 percent. With the July numbers in hand, everyone’s attention will turn to the second half of 2022 and the January Cattle inventory report.
This summer, drought conditions have intensified in the Southeastern U.S., impacting forage production. According to the most recent USDA Crop Progress Report, 21% of pasture is in poor or very poor condition in the Southeast. In Arkansas, conditions are much worse, with 75% of pastures in poor or very poor condition. The Southern Plains are also in extreme drought. The USDA Crop Progress report shows that 68 percent of pasture is in poor or very poor condition.
Many producers are deciding between feeding hay now or culling cows. The auction data confirms high volumes of cull cows and bulls coming to market. The table provides July cull cow and bull auction volumes for Arkansas, Missouri, and Oklahoma. July cull cow and bull volume in Arkansas totaled 4,455 head, up 37.2 percent year over year. Volumes were 83.8 percent and 105.3 percent higher in Missouri and Oklahoma, respectively.
July Slaughter Cattle (Cows and Bulls) Auction Receipts
State
Jul-22
Jul-21
% Chg. Y/Y
Arkansas
4,455
3,246
37.2%
Missouri
15,794
8,593
83.8%
Oklahoma
12,396
6,038
105.3%
Large volumes of cull cows have pushed beef cow slaughter even higher. The graph shows cumulative beef cow slaughter for the first 29 weeks of the year. Currently, beef cow slaughter is at its highest in the last 30 years, totaling 2.21 million head. Based on the January 2022 beef cow inventory estimate, we slaughtered 7.3 percent of the herd. Based on current slaughter totals, we could see the January 2023 beef cow inventory decline at least 3 percent, the largest decline since the mid-1980s.
The change in the November soybean futures price from the market open on July 1 to market close on August 1 was down $0.56/bu. However, the open-to-close change does not capture the volatility that occurred in July 2022. The trading range for the month (contract high-low) was $2.01/bu, with 11 out of 21 trading days having moves of greater than (+/-) 25 cents (Table 1). Volatility reflects uncertainty regarding drought/production, geopolitics, trade, the global economy, and many other factors. Futures markets reflect the opinion of market participants on factors affecting current and future supply, demand, and prices. Market participants, including producers, merchandisers, end users, and speculators, will weigh factors differently; however, at any point in time, the futures market can be deemed as the best guess of future value as indicated by trades for various contract months. The constant flow of new information causes markets to move continuously.
As mentioned above, numerous factors have attributed to the dramatic price swings in soybean markets. However, one factor that will be watched closely moving forward is the change in the CME crush margin and the allocation of soybean value embedded in soybean meal and soybean oil. Crush margins can provide producers with valuable information regarding the drivers of demand for soybeans and soybean futures market prices. The CME crush margin is defined as:
CME Crush Margin = [(Price of Soybean Meal ($/short ton) x 0.022) + (Price of Soybean Oil (¢/lb) x 11)] – Price of Soybeans ($/bu)
In 2022, the value of the September soybean CME crush margin had ranged from $1.38/bu to $2.26/bu, with an average of $1.80/bu. The CME crush margin on August 1 was $2.18/bu, near the top of the 2022 range indicating a rebound in the June low and a strong incentive for more crush (Figure 1). When the CME crush margin peaked on April 27, the percent of value embedded in a bushel of soybeans was 52% meal and 49% oil. In other words, oil was leading the charge for soybean value (the value of a bushel of soybeans attributed to oil and meal has ranged from 60:40 to 50:50 in 2022). Now, as of August 1, that ratio has moved to 58:42 indicating meal is providing a greater influence on soybean value.
Both soybean oil and meal have provided strong influence in soybean markets this year and demand for both products remains strong. Strong demand and shrinking USDA 2022/23 U.S. ending stock numbers (230 million bushels in the July WASDE) will continue to support soybean prices. Bearish influences, economic growth and geopolitical tensions, primarily with China, are still present in the market, but demand continues to be a positive factor supporting soybean prices.
Table 1. November Soybean Futures Price July 1 – August 1, 2022
Figure 1. Percent of Soybean Value Attributed to Meal and Oil Compared to CME Cush Margin (September Contracts)
Farmers all around the country are experiencing difficulties recruiting and retaining agricultural workers. The farm labor scarcity problem is particularly acute for key sectors in the Southeastern United States like specialty crops (fruits and vegetables), the green industry (ornamental plants and other commodities), and livestock (cattle and dairy) which are heavily reliant on labor. As shown in Figure 1, a significant fraction of farmworkers is believed to be undocumented. There are two projects currently under discussion in the Senate (which passed the House) that if approved, would substantially change existing immigration rules. Both initiatives include legalization avenues for farmworkers.
The first project, the 2021 U.S. Citizenship Bill, was sent to Congress by the President on his first day in office. The bill substantially changes all the current immigration system and has three main goals: a) providing pathways to citizenship and strengthening labor protections, b) prioritizing smart border controls, and c) addressing the root causes of immigration.
The second project, the Farm Work Force Modernization Act, is specific to the agricultural sector. The bill has three main objectives. First, it creates a pathway to citizenship for unauthorized farmworkers. Second, it substantially modifies and expands the H-2A program by allowing some workers to stay year-round and granting overtime payments. Third, the bill requires all agricultural employers to use E-Verify to check that newly hired individuals are legally authorized to work in the United States.
Any changes to the current immigration system could affect producers of labor-intensive agricultural commodities via at least two channels. First, by affecting the number of foreign workers willing and able to continue farming (as opposed to switching jobs to competing sectors like construction). Second, the changes would alter the costs of hiring workers. The fate of these two projects may be defined in the following months.
Figure 1. Legal Status Breakdown of Hired Crop Farmworkers: 1991-2016
Source: Economic Research Service, U.S. Department of Agriculture using data from the U.S. Department of Labor.
On March 11, 2021, President Biden signed the American Rescue Plan (ARP) Act of 2021 into law. Section 1005 of the act required the Secretary to make payments to socially disadvantaged farmers or ranchers “in an amount up to 120 percent of the outstanding indebtedness” of eligible producers for both direct and guaranteed loans administered by various USDA agencies.[1] While USDA immediately went to work implementing the provisions, multiple lawsuits were filed – alleging that the provision was unconstitutional because it violates the Due Process Clause of the Fifth Amendment – and 3 courts have issued injunctions prohibiting USDA from issuing any payments, loan assistance, or debt relief pursuant to Section 1005.[2] According to USDA, the injunctions “do not prohibit FSA from completing administrative actions leading up to payments, including providing payment notifications to potentially eligible borrowers.”[3] At the time of passage, the Congressional Budget Office (CBO) estimated the provision would cost $3.98 billion over the next 10 years.[4]
In the meantime, the Build Back Better Act (BBB) of 2021 – which passed the House on November 19, 2021 – sought to remedy the concerns raised about Section 1005 in the American Rescue Plan. Specifically, Section 12101 of the BBB amends Section 1005 of ARP, in part, by changing the focus of the debt relief to “economically distressed borrowers” with eligibility tied to eight (8) broad criteria ranging from debt delinquency metrics to whether the farm or ranch was headquartered in a county with a poverty rate of 20 percent or greater.[5] With the presumably expanded list of eligible borrowers, CBO estimated that the provision would cost $6.647 billion over the next 10 years.[6] Due, in part, to the price tag of the overall bill, the BBB has languished in the Senate for the last several months.
Last week, Senators Schumer and Manchin announced a joint agreement to add various provisions from the BBB – via the Inflation Reduction Act of 2022 – to the FY2022 Budget Reconciliation Bill.[7] In our review of the draft legislation posted last week, it does not appear that debt relief for farmers and ranchers was included. While Congressional leaders may have plans for including debt relief in another legislative vehicle, unless and until they do – or unless and until the courts rule on the pending cases or lift the existing injunctions – potentially eligible farmers and ranchers will have to keep waiting.
[2]SeeHolman v. Vilsack, 21-1085-STA-jay, Order Granting Motion for Preliminary Injunction (July 8, 2021); Miller v. Vilsack, 4:21-cv-00595-O, Order (July 1, 2021); Wynn v. Vilsack, 3:21-cv-00514-MMH-JRK, Order (June 23, 2021).
Research into cover cropping has shown some benefits to soil health and conservation. However, adoption of cover cropping has been relatively low due in part to uncertainty about its profitability. When considering whether to adopt this practice it is important to understand the associated costs.
Seed and planting cost make up the bulk of additional costs of cover cropping. Table 1 shows examples of the cost of planting various cover crops from prices obtained in Mississippi. Seed costs range from $18.00/ac for oats to $43.80/ac for Austrian winter peas. Planting costs are estimated at $11.68/ac including direct expenses as well as indirect equipment costs (estimates derived from the Mississippi State Enterprise Budgets assuming a 20’ grain drill). Total costs of cover cropping range from $29.68/ac to $55.48/ac. Your costs will vary depending on local conditions, seeding rates, and equipment. In some cases, an additional herbicide application is also needed to terminate the cover crop.
Table 1. Costs of Cover Cropping
Crop
Seed Cost $/lb
Seeding Rate lb/acre
Seeding Cost $/ac
Planting Cost $/ac
Cover Crop Costs $/ac
Austrian winter pea
0.73
60
43.80
11.68
55.48
Crimson Clover
1.80
20
36.00
11.68
47.68
Cereal Rye
0.39
60
23.40
11.68
35.08
Tillage radish
2.40
8
19.20
11.68
30.88
Oats
0.36
50
18.00
11.68
29.68
Rye+Clover (89/11 Mix)
0.45
50
22.36
11.68
34.04
For cover cropping to be profitable there needs to be a positive yield benefit to offset the added costs. However, research has shown that cover cropping may have no effect on yield or in some cases decrease yield. The impact on yield is highly dependent on which crop is being grown. Spencer et al. (2021) found that Austrian winter pea and cereal rye decreased corn yield by 37 and 45%, respectively, in the first year of implementing cover crops. In subsequent years there was no significant differences in yield found. But, net returns were significantly reduced in 2 out of the 4 years examined. Bryant et al. (2020) found that, relative to reduced tillage-subsoiling, a cereal rye cover crop had no impact on soybean yield but a radish cover crop reduced soybean yield by 12%. However, these results are atypical for what is usually observed in soybeans under cover cropping. Regardless, the lack of a positive yield response led to lower net returns under both the cereal rye and radish cover crops in that study. Lastly, Denton et al. (2021) found no yield response from cover cropping in cotton. This led to lower net returns of $20.34/ac to $124.64/ac under cover cropping. These studies show why cover cropping may not be profitable in the Mid-South.
One way to help alleviate the lack of profitability would be to secure Environmental Quality Incentives Program (EQIP) payments. As shown in Table 2, payments vary from state-to-state and by cover crop. Producers are only eligible for payments on land that is not currently under cover cropping. There are also limitations on payment amounts and duration. More information on your specific state’s EQIP payments can be found at: https://www.nrcs.usda.gov/wps/portal/nrcs/detailfull/national/programs/financial/?cid=nrcseprd1328426
Table 2. Environmental Quality Incentives Program Payments for Cover Cropping 2021
Alabama
Arkansas
Louisiana
Mississippi
Oklahoma
Tennessee
Texas
Practice
EQIP Payments $/ac
EQIP Payments $/ac
EQIP Payments $/ac
EQIP Payments $/ac
EQIP Payments $/ac
EQIP Payments $/ac
EQIP Payments $/ac
Cover Crop-Basic (Organic and Non-organic)
$52.36
$50.22
$50.05
$51.73
$48.60
$52.14
$33.74
Cover Crop-Multiple Species (Organic and Non-organic)
$64.02
$61.75
$61.71
$63.26
$60.25
$63.79
$41.51
The results discussed here may differ from what is found on your farm. When deciding whether to adopt cover cropping it is important to test if the practice is profitable on a small area first. Once it is determined if it is profitable for you then larger scale adoption can be implemented. Your local NRCS office can also help with additional information about obtaining EQIP payments.
References
Bryant, C.J., Krutz, L.J., Reynolds, D., Locke, M., Golden, B.R., Irby, T., Steinriede, R., Spencer, G.D., Mills, B.E., & Wood, W. (2020) Conservation Soybean Production Systems in the Mid-Southern USA: II. Replacing Subsoiling with Cover Crops. Crop, Forage & Turfgrass Management. http://dx.doi.org/10.1002/cft2.20058
Denton, S.D., Dodds, D.M., Krutz, L.J., Varco, J.J., Gore, J., Mills, B.E., & Raper, T.B. (2021). Impact of Cover Crop Species on Soil Physical Properties, Cotton Yield, and Profitability. Journal of Cotton Science. 25:68-78.
Spencer, G.D., Krutz, L.J., Locke, M., Gholson, D., Bryant, C., Mills, B.E., Henry, W., & Golden, B. (2021)Corn productivity and profitability in raised, stale seedbed systems with and without cover crops. Crop, Forage & Turfgrass Management. http://dx.doi.org/10.1002/cft2.20142