Blog

  • Promoting the Importance of Southern Farm Raised Oysters

    Promoting the Importance of Southern Farm Raised Oysters

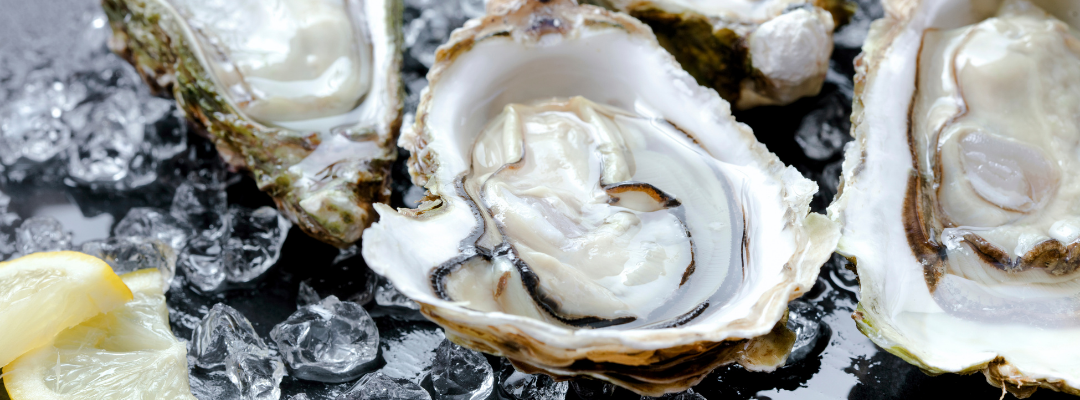
    Southern oysters are an important food source with a rich cultural and culinary history. Because of this, it is not surprising that southern consumers tend to eat more oysters than those in other parts of the US. And, with wild oyster harvests diminishing, the south is experiencing a dramatic rise in oyster aquaculture farms. However, unlike most seafood products, farmed oysters cost more than wild harvested oysters. This places the marketing burden on oyster producers to differentiate their farm-raised products to justify higher prices. 

    To help oyster marketing efforts, several southern land grant universities have researched oyster consumers to determine key marketable oyster traits. Clemson University researchers have also completed an oyster consumer preference study, with results forthcoming. In addition to oyster consumer preferences, Clemson research also discovered two key findings about consumer perception of oyster farming: more than half of consumers (58%) did not know that most oysters are farm-raised (worldwide), and almost half (45.6%) were unsure whether farmed oysters are good or bad for the environment.

    This finding represents a golden marketing opportunity for oyster farmers to educate the public on the importance of supplementing wild harvests and the environmental benefits of oyster farming. Rather than try and manage public perception after the fact, oyster producers can get in front of the news and manage a positive narrative about oyster farming. Because of the appeal to the general public, this message may be easily amplified through public-service-announcements (free) sources such as the local media, land grant universities and cooperative extension, Sea Grant, and Farm Bureau. Local and state restaurant associations and chambers of commerce may also be prime audiences, as they can communicate this message to their members.

    It is also important to collaborate with other southern oyster producers to strengthen communication and marketing efforts. An excellent example of this sort of collaboration is Oyster South, whose annual symposium will be held February 3-5, 2022, in Biloxi, Mississippi. For more information on the symposium, please visit www.oystersouth.com. For more information on the findings of Clemson’s oyster consumer preference survey, please contact the author directly.


    Richards, Steve. “Promoting the Importance of Southern Farm Raised Oysters.” Southern Ag Today 2(5.5). January 28, 2022. Permalink

  • U.S. Imports and the Continued Rise in Fertilizer Prices

    U.S. Imports and the Continued Rise in Fertilizer Prices

    Last November, I wrote an article for Southern Ag Today about the spike in fertilizer prices. Since that time, import prices have continued to rise. As mentioned in the previous article, U.S. fertilizer imports have averaged nearly $6 billion over the last five years (around 25 million metric tons), accounting for a significant share of total U.S. fertilizer use (USDA-ERS, 2019). Additionally, the global fertilizer market had already been tightening before plants were forced to cut production given the rise in the cost of natural gas, a key feedstock (Larkin, 2021). Given the continued rise in U.S. fertilizer prices, a more detailed look at imports could help explain why the price of some fertilizers have increased more than others.

    In 2020, the U.S. imported about $6.5 billion in fertilizer. That year, the top imports included potassium chloride ($2.7 billion), urea ($1.3 billion), monoammonium phosphate ($590 million), urea-ammonium ($400 million), and diammonium phosphate ($400 million). In January 2020, import prices ranged from as low as $130 per metric ton (MT) for urea-ammonium to about $267/MT for and diammonium phosphate. In 2021, diammonium phosphate increased to over $1000/MT and monoammonium phosphate increased to over $700/MT; urea increased to over $500/MT. Interestingly, the price of imported diammonium phosphate fell in November 2021 to $625/MT, which was a significant decline from the $1,008/MT high the previous month. Other trends, however, suggest that fertilizer import prices will continue to increase.

    U.S. Fertilizer Import Prices Significantly Higher in 2021 Due to Global Supply and Demand Issues

    Source: U.S. Department of Agriculture, Foreign Agricultural Service’s Global Agricultural Trade System (2022). https://apps.fas.usda.gov/GATS/default.aspx

    References

    Larkin, N. (October 15, 2021) Supply Lines Fertilizer Crisis Piles More Pressure on World’s Future Food Supply. Bloomberghttps://www.bloomberg.com/news/newsletters/2021-10-15/supply-chain-latest-warnings-mount-over-fertilizer-crisis

    U.S. Department of Agriculture, Economic Research Service (USDA-ERS) (2019). Fertilizer Use and Pricehttps://www.ers.usda.gov/data-products/fertilizer-use-and-price.aspx  

    U.S. Department of Agriculture, Foreign Agricultural Service (USDA-FAS) (2022). Global Agricultural Trade System. GATSFertilizer Use and Pricehttps://apps.fas.usda.gov/gats/default.aspx


    Muhammad, Andrew. “U.S. Imports and the Continued Rise in Fertilizer Prices.” Southern Ag Today 2(5.4). January 27, 2022. Permalink

  • The Perfect Fertilizer Storm

    The Perfect Fertilizer Storm

    Sky-rocketing fertilizer prices have dominated ag industry discussions over the last year, and for good reason.  By now, the peaks & valleys of the price chart below should be familiar, and most of you remember living through these price cycles.  The price climb that began in late summer 2020 is the most dramatic since 2008 and we are now seeing spot prices more than double and even triple the average prices seen over the 4-5 years preceding 2020.  The discussion generally starts with: what is causing these kinds of prices?  In this particular case, there does not seem to be any one culprit.  Instead, it might be best described as a perfect storm of factors that are all creating upward price pressure.  

    Demand:  An increase in commodity prices (particularly corn price) is expected to lead to an increased demand for fertilizer.  Corn rose above $7.00/bu in the summer of 2008; fertilizer prices spiked soon after.  Again in 2021, corn broke through $7.00/bu, and we have seen what has followed with fertilizer.  There is an obvious connection.  What about residential fertilizer demand?  We know the Covid Era of increased work from home created higher demand for landscaping, lawn equipment, etc.  People were home more often, therefore paying more attention to the lawn and garden.  Without finding the specific data, it is a safe bet we are collectively demanding/using more residential fertilizer, as well.

    Supply:  Often times, demand is met by ramping up supply to satisfy the increased need and moderate upward price pressure.  However, we find the fertilizer market (along with so many other industries) currently overwhelmed with supply struggles.  Global natural gas prices have increased the cost of fertilizer production, some traditional exporting countries are shipping less to ensure their own domestic supply, and the geo-political landscape of trade battles and imposed tariffs have further slowed supply.  Finally, physical supply chain disruptions and increased cost of product transportation have slowed supply to the point of questionable availability at given times/locations.  

    The challenge moving forward is that we have yet to see a light at the end of the tunnel.  History would suggest prices will eventually ease, but no evidence today indicates any relief throughout the 2022 production season.  Next week, we will examine the farm level financial impacts of producers enduring higher input costs.  Tomorrow (Southern Ag Today, Jan 27, 2022), Dr. Andrew Muhammad will dig a little deeper into the trade/import markets for specific fertilizer products.   

    Monthly Average Fertilizer Nutrient Prices, January 2000 to October 2021

    Source: AFPC Briefing Paper 22-01, compiled from DTN spot market price data for the last trading day of each month. The markets include New Orleans, Corn Belt, Southern Plains, South Central, Southeast and Florida. The phosphorous price is specifically for diammonium phosphate (DAP).

    Reference: 

    Outlaw, et al. Economic Impact of Higher Fertilizer Prices on AFPC’s Representative Crop Farms.  Texas A&M University System, Agricultural and Food Policy Center Briefing Paper 22-01. January 2022.  


    Klose, Steven, and J. Marc Welch. “The Perfect Fertilizer Storm.” Southern Ag Today 2(5.3). January 26, 2022. Permalink

  • Seasonal Price Indices for Cull Livestock

    Seasonal Price Indices for Cull Livestock

    The thought of marketing cull livestock is generally not at the top of mind for most livestock producers. However, it is an important decision from both a marketing and management standpoint. More specifically, most livestock producers are entering a period in which cull livestock prices tend to be increasing for cattle and hogs or they will be drastically decreasing for small ruminants. Thus, these seasonal price tendencies can be extremely useful when making marketing and management decisions.

    Utility cow prices typically experience their largest price increase in February with prices for this class of animal peeking in May or June. Selling cows at the highest price point in the year may or may not be the best decision, but there is a nice marketing window for this class of animal from February through June. Hog producers generally experience a similar seasonal pattern for slaughter sows. The price of slaughter sows will increase from February through the summer months with a nice marketing window between April and August.

    From the small ruminant standpoint, slaughter ewe and doe prices are typically at their peak in January and begin to decline in February. Prices then tend to decline through most of the year. Thus, sheep and goat producers may want to consider marketing cull ewes and does in the near term to capitalize on their current value.


    Griffith, Andrew P. . “Seasonal Price Indices for Cull Livestock.” Southern Ag Today 2(5.2). January 25, 2022. Permalink

  • 2022 Price Outlook for Hard Red Winter and Soft Red Winter Wheat

    2022 Price Outlook for Hard Red Winter and Soft Red Winter Wheat

    In the last 2-1/2 years, wheat futures prices have doubled, from just over $4.00 per bushel in June 2019 to over $8.50 per bushel this past November. This has occurred in both the hard red winter wheat (Kansas City contract) and soft red winter wheat (Chicago contract) markets.  But over most of this period, hard red winter wheat, which normally trades at a premium to soft red winter wheat, traded at a discount. From January 2006 to December 2018, the average premium for hard red winter wheat to soft red winter wheat was 34 cents. From January 2019 through August 2021, hard red winter wheat traded at an average discount of 53 cents to soft red winter wheat. September 2021 to date, hard red winter wheat is back to an average 16-cent premium to soft red winter wheat.

    Figure 1. Wheat futures prices, Kansas City hard red winter and Chicago soft red winter, Tuesday close, cents per bushel

    The increase in wheat prices generally is associated with tightening world supplies.  Wheat acres globally have increased over the last several years, but the world average yield has declined. Total wheat production is up only 600 million bushels (about two percent) since the 2019/20 marketing year while world domestic use has grown by 1.6 billion bushels (about six percent). World wheat days of use on hand at the end of the marketing year have declined from a 146-day supply to a current estimate for 2021/22 of 130 days.  A decline in this measure of stocks-to-use has put upward pressure on prices.  

    World Wheat2019/20202020/20212021/2022
    Area Harvested, mil ac533546552
    Yield, bu per ac52.652.251.9
    Production, mil bu28,00628,51028,609
    Domestic Use, mil bu27,21828,46228,867
    Ending Stocks, mil bu10,87610,64210,236
    Days of use on hand145.9134.7129.8
    USDA, FAS, PSD, 1/12/2022

    Hard red winter wheat is the dominant class grown in Kansas, Oklahoma, and Texas with soft red winter wheat the most common class east of a line from Dallas to Kansas City. While the price of both classes of wheat are higher in the current global environment, there are important differentials in stocks-to-use by class which may help explain the premiums and discounts between these markets. 

    U.S. Wheat Associates, Planted Area, by Class, 2013-2019 http://maps.heartlandgis.com/storymaps/uswheatassociates/uswheatsupplychain/

    As with the global wheat situation, the stocks-to-use ratio for both hard and soft winter wheat have been on the decline in the U.S. the last several years. However, the decline in the stocks-to-use ratio for soft red has been sharper relative to the decline in the stocks-to-use ratio for hard red. 

    U.S. Wheat by Class: Days of Use on Hand at the End of the Marketing Year

    USDA, WASDE, January 2022

    In the 2017/18 marketing year, days of use for soft red was 34 less than hard red winter. By 2020/21, soft red days on hand were 103 less than for hard red—the soft wheat supply got tighter relative to hard wheat.  The hard red winter wheat premium declined from +8 cents to a 74-cent discount.  That situation appears to be reversing in the 2021/22 marketing year. The stocks-to-use ratio for soft red winter wheat has declined at a slower rate compared to hard red winter wheat and days on hand are back to a 54-day differential—soft winter wheat supplies are more plentiful relative to hard red winter wheat.  The price relationship to date this marketing year has hard red winter back on par with soft wheat. The latest weekly price shows a premium for hard red of 22 cents.  

    SRWW days of use on hand minus HRWW days of use on hand and the HRWW price premium

    USDA, Wheat Data and WASDE, Updated 1/13/2022

    With the U.S. only accounting for about six percent of world wheat production, supply and demand dynamics globally will largely influence the price of wheat overall.  But important distinctions in supply and use levels by wheat class can be important in local markets. For the time being, the fundamental (supply and demand) and price relationship between hard red winter and soft red winter wheat appears to be moving back toward long-term norms.    


    Welch, Mark. “2022 Price Outlook for Hard Red Winter and Soft Red Winter Wheat.” Southern Ag Today 2(5.1). January 24, 2022. Permalink