Blog

  • Flood Impact Estimates on Cropland Using Satellite Imagery

    Flood Impact Estimates on Cropland Using Satellite Imagery

    Satellite imagery has been widely promoted as a decision-making tool in agricultural production. Many agricultural software companies, crop consultants, and farm managers have integrated satellite imagery into their data analytics for production monitoring and management. Such data and analytics show promise for supporting field zone mapping, identifying relative variations in crop yield, and monitoring water use. There are tradeoffs between satellite platforms in terms of the scale and usefulness of the data collected depending on the application at hand. There are also cases where satellite imagery can be useful for mapping the impacts of extreme events such as flooding, drought, or derechos. 

    In June 2021, a 100-year flood event occurred in Southeast Arkansas. When such events happen, it is imperative that impact estimates are conducted as soon as possible to identify how and where to best support producers. The public imagery typically available for agricultural applications comes primarily from the NASA/USGS Landsat or EU Copernicus Sentinel missions. While imagery from these platforms comes at sub-monthly time-steps and relatively high spatial resolutions (30 and 20 meter pixels, respectively), it often isn’t available for several weeks after the images are taken due to processing. However, commercial imagery such as that produced by Planet Labs, offers opportunities for higher spatial resolution of 3-5 meters at near daily time-steps and becomes available in hours to days. When more than 15 inches of rain dropped over Southeast Arkansas, Planet Scope imagery was used to estimate the flood extent over cropland and illustrates the potential for more rapid cropland monitoring applications.

    Figure 1 shows the color-infrared (CIR) imagery, flood extent, and heavy flooding (>1 ft) by crop type based on USDA NASS’s cropland data layer (CDL). Planet Scope records four bands of multispectral data for each pixel, including red (R), green (G), blue (B), and near-infrared (NIR). Many producers are familiar with the normalized difference vegetation index (NDVI), which is derived from NIR and R bands and corresponds to crop greenness. NIR reflects strongly when vegetation is present, and absorbs heavily when water is present. This relationship is very useful, as in this case, for mapping flooded fields. Based on the flood extent identified with thresholds for NIR, the CDL, and ground reference information provided by local county extension agents, there were 254,323 soybean, 190,150 rice, 54,817 corn, and 34,864 cotton acres estimated to have heavy flooding during this event in Arkansas. This information was generated within days of the flood event for the seven hardest hit counties. After a few weeks, impact estimates were generated for the broader area including 12 counties. Economic impacts from the event were estimated at approximately $60 million for corn, $6 million for cotton, $68 million for rice, $71 million for soybeans, and $1 million for wheat at an approximate total of $206 million.

    Satellite imagery applications for agriculture are most commonly thought of for in-season monitoring and post-season assessment of maximum greenness to map field management zones. However, a lesser known but useful application of satellite imagery is for flood or natural disaster mapping. When flood events, derechos, or other natural disasters occur, estimating the extent of crop damage in a short timeframe is of utmost importance to best support recovery. We often rely on conversations and phone calls with county extension agents, producers, and crop consultants to gain an initial estimate of crop impacts. Satellite imagery can provide an additional tool for making damage estimates in those critical days and weeks following an event, especially when combined with on-the-ground conversations and validation. Planet and other satellite platforms will continue to play a role in improving and supporting agricultural production as wider access becomes available. This case represents one of many opportunities for satellite imagery to increase in its adoption and applications in crop production.

    Figure 1: Estimates of Flood Extent and Acreage Impacts in Southeast Arkansas, June 2021.

    Source: Acreage counts are from the 2020 Cropland Data Layer published by USDA NASS (https://nassgeodata.gmu.edu/CropScape/). Raw satellite imagery is from June 14th, 2021 and sourced from 4-band Planet Scope Scenes (https://www.planet.com/).

    Recommended citation format: Davis, Jason, and Aaron M. Shew. “Flood Impact Estimates on Cropland using Satellite Imagery“. Southern Ag Today 2(3.3). January 12, 2022. Permalink
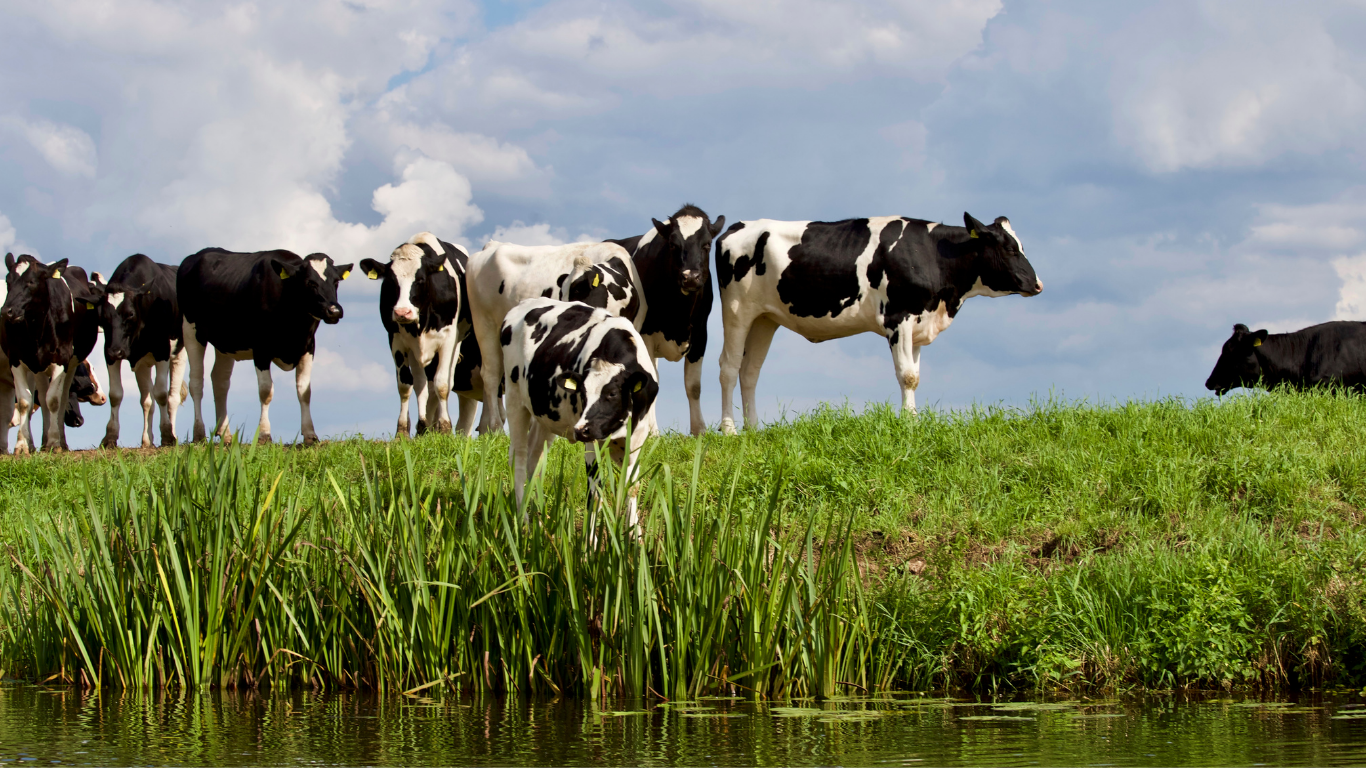
  • Cattle Areas in Drought

    Cattle Areas in Drought

    Drought conditions have troubled livestock producers in many parts of the U.S. over the past few years. According to the latest report, approximately 50 percent of cattle inventory is in an area currently in some level of drought conditions. Most of the severe drought areas are in the Great Plains and Western U.S. The Western and Great Plains regions ended 2021 with about 60 percent of pasture in poor or very poor condition. Drought has contributed to beef cow herd liquidation in severe regions. 

    Drought areas in the Southeast are not widespread, with many areas receiving much precipitation in recent weeks. However, some drought areas have developed in the Southeast in recent months across TX, LA, AR, and MS. Cool season forages such as winter ryegrass or winter wheat are the primary forages grown during this time of the year and will need moisture through the winter. The latest drought monitor shows approximately 65 percent of U.S. winter wheat production is in an area experiencing drought. While most of this production is in the Plains region, some is in the Southeast. Cattle producers with lower winter forage production due to lack of moisture may need to increase supplementation for cattle over winter – with higher feed and hay costs. 


    Recommended citation format: Maples, Josh. “Cattle Areas in Drought“. Southern Ag Today 2(3.2). January 11, 2022. Permalink

  • Input Price and Availability is Influencing 2022 Planting Intentions

    Input Price and Availability is Influencing 2022 Planting Intentions

    Historically, the harvest futures price from December 1 to March 31 can be a key predictor of planted acreage for spring crops. From 2010 to 2021, the monthly average futures price from December 1 to March 31 for soybeans (SX) divided by corn (CZ) has been 2.39, and corn (CZ) divided by cotton (CTZ) has been 5.85. A soybean-to-corn price ratio below 2.39 would tend to favor planting corn over soybeans and a corn-to-cotton price ratio above 5.85 would favor corn over cotton (Figure 1). So, with relative prices favoring corn and cotton, should we expect a reduction in soybean acres in 2022? Maybe not. 

    Figure 1. December 1 to March 31 monthly average futures closing price ratio for the harvest contract (December = Corn; Soybeans = November; and Cotton = December), 2010-2022*

    Commodity price ratios may not dictate producer decisions on what to plant in 2022. Instead, input cost and availability may be the driving force. High input crops, like cotton and corn, are at a disadvantage compared to lower input crops like soybeans and sorghum. High input prices reduce profit margins, and potential lower input availability increases production risk. 

    Using fertilizer as an example, retail prices (Figures 2 & 3), are up 62-176% compared to last November. To put this in context, from 2010 to 2020 for the Mississippi Portal Region, USDA ERS estimates the cost of fertilizer to be 4.49 times more expensive for an acre of corn than for an acre of soybeans and 2.64 times more expensive for an acre of cotton compared to an acre of soybeans. As such, a doubling in fertilizer prices can add $100-150 or more per acre to producer’s production costs for corn, whereas for soybeans, fertilizer costs may only go up $20-35 per acre with a doubling of fertilizer prices. Producers will need to estimate profitability and risk for each commodity when making planting decisions. 

    Figure 2. Select weekly fertilizer prices November 2019 to November 2021

    Figure 3. Select weekly fertilizer prices November 2019 to November 2021

    Currently, the availability and cost of inputs for the 2022 crop is a major concern for producers. This is likely to continue well into 2022. Producers who purchase inputs in winter 2021/22 at high prices should strongly consider mitigating downside commodity price risk to avoid potentially catastrophic financial outcomes — inputs purchased at high prices combined with the potential sale of commodities at substantially lower prices (than are currently offered). Controlling input costs and managing output price risk this winter will be key to set the foundation for a successful 2022 crop year for midsouth producers.  

    References:
    Barchart.com. 2021. https://www.barchart.com/futures/grains and https://www.barchart.com/futures/quotes/CT*0/futures-prices?viewName=main (Accessed December 1, 2021).
    Dehlinger, K. and Russ Quinn. 2021. “DTN Retail Fertilizer Trends.” https://www.dtnpf.com/agriculture/web/ag/crops/article/2021/11/10/nitrogen-fertilizer-prices-shatter-1 and https://www.dtnpf.com/agriculture/web/ag/crops/article/2021/12/01/nitrogen-fertilizer-prices-end-2021(Accessed December 1, 2021).
    U.S. Department of Agriculture Economic Research Service (USDA-ERS). “Commodity Costs and Returns.” https://www.ers.usda.gov/data-products/commodity-costs-and-returns/ (Accessed December 1, 2021).


    Recommended citation format: Smith, Aaron. “Input Price and Availability is Influencing 2022 Planting Intentions“. Southern Ag Today 2(3.1). January 10, 2022. Permalink

  • The COVID Effect and Southeast Consumers’ Plant Purchasing Behavior

    The COVID Effect and Southeast Consumers’ Plant Purchasing Behavior

    The COVID-19 pandemic drastically changed the retail environment. Due to safety concerns, lockdowns, social distancing protocols, and other actions to minimize disease spread, consumers shifted from buying plants through traditional brick and mortar stores to online and curbside pickup options. Online plant purchases increased the most for mass merchandisers and box stores. Conversely, curbside pick-up increased the most for independent garden centers, followed by box stores. Customers who increased their online plant purchases were less likely to revert to their pre-pandemic buying behaviors after the pandemic while curbside pick-up customers were more likely to revert to their pre-pandemic buying behaviors. Several factors likely contributed to these results. First, online plant sales provide several benefits including increased convenience and accessibility, especially for consumers who do not live near the retail outlet. Additionally, as customers gained experience with online plant shopping, their confidence in receiving a high-quality product likely increased. As a result, e-commerce may be an attractive sales option for some firms, especially if they saw a strong increase during the pandemic. Secondly, curbside pick-up shoppers likely live near the retail store, so accessibility is not an issue. These individuals may also value the plant shopping experience meaning they perceive the retail environment positively and want to be physically present to shop for plants. 


    Recommended citation format: Rihn, Alicia. “The COVID Effect and Southeast Consumers’ Plant Purchasing Behavior“. Southern Ag Today 2(2.5). January 7, 2022. Permalink

  • 2022 Farm Safety Net Decisions

    2022 Farm Safety Net Decisions

    For the 2022 crop year, producers will have several decisions to make over the next few months.  For example, the U.S. Department of Agriculture’s Farm Service Agency (FSA) has announced that producers will have until March 15, 2022, to make their Agriculture Risk Coverage (ARC) and Price Loss Coverage (PLC) elections and enrollments for the 2022 crop year.  In addition, many of the sales closing dates for crop insurance for spring-planted crops are rapidly approaching.

    For the ARC-County (ARC-CO) and PLC decision, the Agricultural & Food Policy Center (AFPC) at Texas A&M University provides a decision tool to evaluate the trade-offs between the two programs on a crop-by-crop and farm-by-farm basis.  AFPC also offers a spreadsheet calculator for producers who are considering ARC-Individual (ARC-IC).  Given the current price outlook – where producers may expect to receive little (or no) assistance from ARC and PLC – it arguably makes the crop insurance coverage decisions even more important.  

    To that end, we offer the following “rules of thumb” for you to consider as you make farm safety net decisions for the 2022 crop year:

    • Similar to the 2021 crop year, ARC and PLC are less likely to pay.  That’s okay!  Most producers tell us they would rather get their income from the market than the government anyway. 
    • Rather than focusing on expected ARC/PLC payments (when neither may trigger), consider instead where you are most vulnerable.  Is it lower prices due to trade disruptions or slow economic recovery?  Is it lower yields due to persistent drought?
    • Talk to your crop insurance agent to make sure you’ve evaluated all yield enhancement options (e.g., Yield Exclusion) and unit structures.
    • With current price elections on crop insurance, perhaps now is the time to focus more on adding area-wide tools like the Stacked Income Protection Plan (STAX) for upland cotton, the Supplemental Coverage Option (SCO), and the Enhanced Coverage Option (ECO).
      • You can have STAX on a farm if the seed cotton base on the farm is not enrolled in ARC/PLC.
      • You can purchase SCO for a crop on a farm as long as it’s not enrolled in ARC.
      • You can purchase ECO on the farm regardless of ARC/PLC enrollment.
    • At a minimum, on farms with little (or no) seed cotton base, be sure to take a close look at area-wide policies like STAX.  
    • If your APH is relatively higher than the county average yields, then be sure to compare STAX against both SCO and ECO.  Because of the 10% limitation in ARC, you may find SCO to be a more attractive alternative (and PLC can be utilized as well, providing some downside price protection, even if you do not expect to need it).

    Recommended citation format: Fischer, Bart L., and J. Marc Raulston. “2022 Farm Safety Net Decisions“. Southern Ag Today 2(2.4). January 6, 2022. Permalink