Blog

  • Southern Timber Market Update

    Southern Timber Market Update

    Lumber prices have been on a roller coaster since the pandemic. They skyrocketed to a record high in May 2021, about quadruple the pre-pandemic five-year average prices, retreated swiftly over the summer, and started to surge again since mid-September. Lumber prices have made headlines and even been addressed by the Federal Reserve Chair. The South is often considered the wood basket of the country because of its significant role in wood supply. People would naturally think that southern timber prices increase dramatically as lumber prices soar because sawmills use timber as raw material to produce lumber. Timber prices and lumber prices are even used interchangeably by some news reporters. However, lumber and timber products are governed by different demand and supply factors. 

    Despite the marked rise in lumber prices, timber prices in the South have barely increased in the past two years until recently. According to TimberMart-South (TMS), the average southern sawtimber price (nominal) hovered around $23-25/ton from 2010 to 2020, compared with $37/ton in 2007. The southern timber market was among the hardest hit by the 2008-2009 economic recession. Roundwood harvest in the South dropped more than 30% compared to the peak in 2007 and timber prices declined more than 40%. Most mills curtailed their production. Some less efficient mills closed permanently. Trees continue to grow vigorously no matter what is going on in the economy. As a result, a significant volume of sawtimber has been accumulated on the stump over the past decade.  Although demand for timber products has gradually improved with improvement in the housing market, the amply supply of standing timber has put constant downward pressure on timber prices in the region. 

    Fortunately, landowners have started to see a gradual increase in timber prices in 2021. Timber prices across the South averaged at $26.24/ton in the third quarter, a 15% increase year-over-year. In some parts of the region (e.g., South Georgia, Florida, and East Alabama), the prices could be more than $45/ton due to strong demand from local sawmills. Record high lumber prices and continued improvement in the housing market support investment in sawmills. Softwood lumber production capacity in the South has increased 2.9 billion board feet (bbf) from 2017 to 2020, an increase of 16%. Newly announced greenfield construction and existing mill expansion suggest that the capacity could increase by another 3.0 bbf by 2023 (TMS). Canadian firms account for most of the increase mainly due to the high timber costs in Western Canada. This is good news for private forest landowners in the South since the increased demand is likely to translate into higher timber prices. 

    Whether the recent rise in timber prices can be sustained largely depends on factors from the demand side. Positive signs include a stable growth in single-family housing starts, continued increase in home improvement and repair expenditures, sawmill capacity expansion, and recovery in log exports. Additionally, the U.S. Department of Commerce recently announced that it will double the tariffs on Canadian softwood lumber to 17.9%. This may push U.S. domestic lumber prices even higher but may also accelerate the pace of Canadian firms’ investment in southern lumber mills. Overall, standing timber prices are expected to hold their recent strength in the near term. However, supply chain disruptions and labor shortage in the logging, transportation, and sawmilling sectors add uncertainties to the market. 


    Recommended citation format: Li, Yanshu. “Southern Timber Market Update“. Southern Ag Today 2(2.3). January 5, 2022. Permalink

  • Calf Prices Start the New Year Higher

    Calf Prices Start the New Year Higher

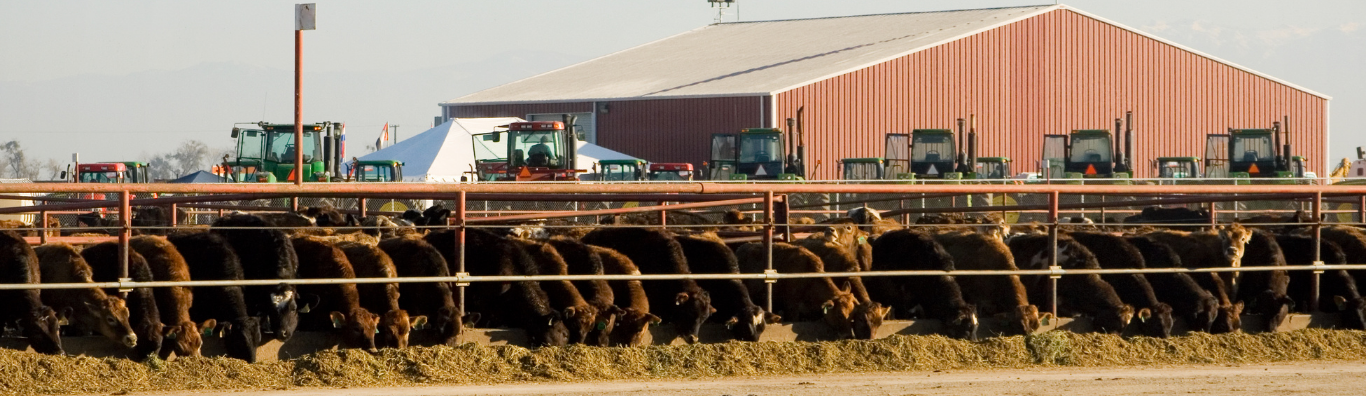
    Maybe we’re starting the new year on a high note with calf prices higher.  Lighter weight steer calves in the Southern Plains topped $200 per cwt at the end of 2021.  5-600 pound steers were over $180 and heavier feeders were over $160.  All of those prices were at least 10 percent higher than at the end of 2020.  Markets across the country were above a year ago along with those in the Southern Plains.

    Expectations are for higher calf prices in 2022 than in 2021.  The continuing contraction in beef cow numbers means fewer calves for sale later in the year.  Tighter supplies combined with good demand means higher prices.

    High feed costs will create some management choices this year.  Fine tuning fertilizer needs this year may pay off.  Targeting hay quality to cow needs could cut costs.  The area of the country in drought has been expanding across the South.  Some planning ahead for drought management strategies might include culling earlier, reviewing stocking rates, reserving some pasture for later needs, or even buying some feed ahead.  

    On balance, the new year brings a bunch of reasons for optimism, in spite of higher costs.  The higher prices to start the year promises more to come later.  Best wishes to you in the new year! 


    Recommended citation format: Anderson, David. “Calf Prices Start the New Year Higher“. Southern Ag Today 2(2.2). January 4, 2022. Permalink

  • Is Shelled Use of Primary Peanut Products Softening?

    Is Shelled Use of Primary Peanut Products Softening?

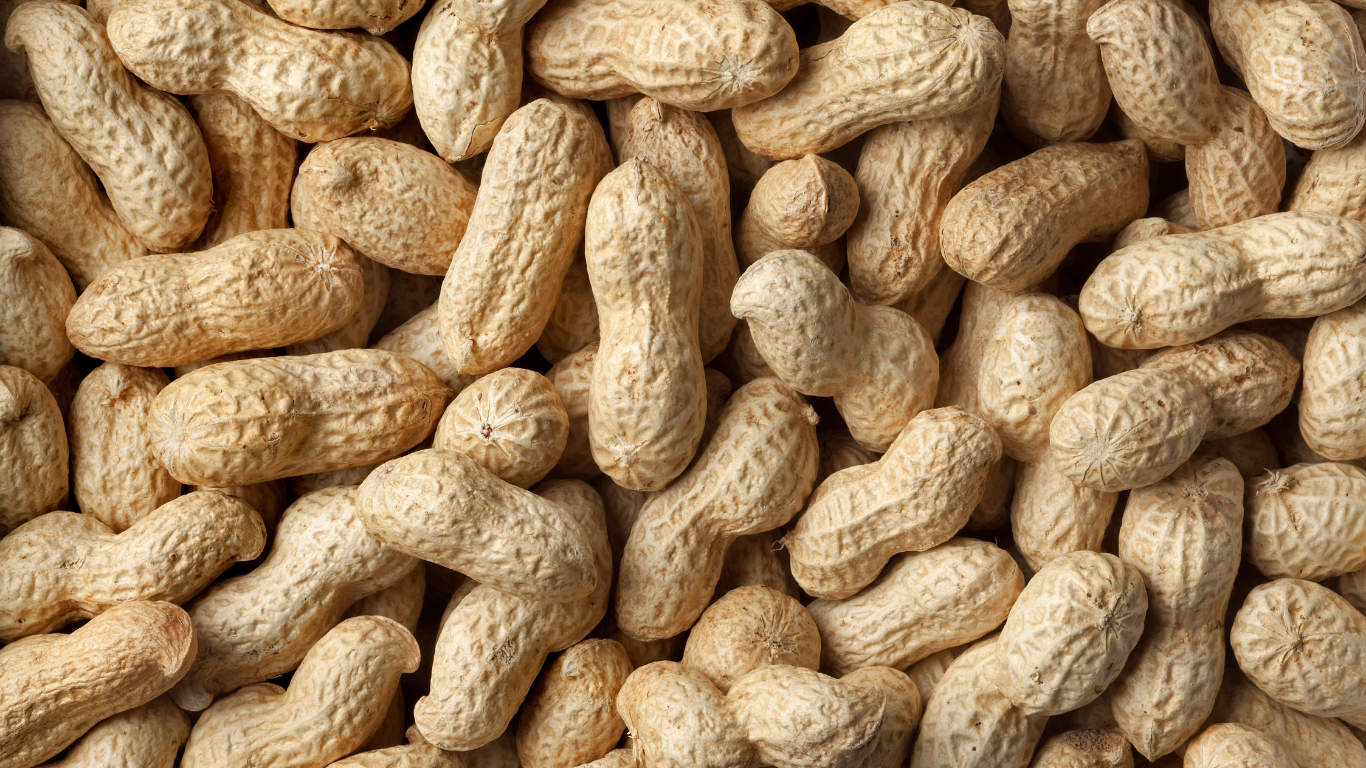
    The National Peanut Board recently reported that per capita peanut consumption in the U.S. reached an all-time high of 7.9 pounds in 2021 (National Peanut Board, 2021). This is an increase from a record 7.6 pounds per capita in 2020.  Peanut consumption has increased domestically since the beginning of the pandemic led by peanut butter use.  The industry faced challenges of restocking grocery shelves after shoppers emptied them of peanut butter.  The JM Smucker Company reported 7.1% growth in peanut butter consumption in 2020 (JM Smucker Co., 2021). The growth was due to increased consumers working and schooling at home and an increased demand from food banks.  Peanut butter usage on a shelled raw basis was up 2.7% from August 2020 to July 2021 according to the USDA National Agricultural Statistics Service (2021).  This was above the six-year average of 1.93%.  Peanut butter makes up 58.9% of total shelled usage followed by snacks at 20.6%, candy at 17.6% and other uses at 2.95%.

    Figure 1. Shelled Peanut Use (Raw Basis) of Primary Peanut Products, 2015-2020 Marketing Years.

    Source: USDA/NASS. Available at: https://usda.library.cornell.edu/concern/publications/02870v87z?locale=en

    The trends for shelled peanuts used domestically in primary peanut products is shown in Figure 1.  Peanut butter has increased at a rate of 1.9% over the last six years and averaged 2.6% since 2017.  Candy usage has grown at a rate of 2.5% over the last six years and averaged 3.5% since 2017.  Snack usage has remained flat over the same time period.  What about the 2021 crop marketing year beginning August 1, 2021?  The latest data shows usage for the first three months of the marketing year to be below last year by 2.9%.  Peanut butter usage is down 4.3%, candy up 2.7% and snacks down 5.7%.  The data suggest there might be a softening of shelled peanut usage.  The first three months of the marketing year represent old crop peanuts and a larger 2021 crop should start having an impact as we enter 2022.   Consumers have returned to the workplace and children are back in school.  Time will tell if shelled peanut domestic use has softened or if logistic challenges are impacting reporting. 

    Citations:

    JM Smucker Co., (2021) “Peanut Butter and Jelly: The Ultimate Pandemic Comfort Foods”  Press Release.  December 17, 2020. https://www.jmsmucker.com/news-stories/stories/22876.

    National Peanut Board, (2021) “Peanut Per Capita Consumption Breaks New Record for Second Year in a Row” Press Release. October 21, 2021,https://www.nationalpeanutboard.org/news/peanut-per-capita-consumption-breaks-new-record-for-second-year-in-row.htm

    USDA National Agricultural Statistics Service, (2021) “Peanut Stocks and Processing” ISSN: 1949-1875, August 27, 2021, https://downloads.usda.library.cornell.edu/usda-esmis/files/02870v87z/41688g448/9593vt44b/pnst0821.pdf


    Recommended citation format: Smith, Nathan. “Is Shelled Use of Primary Peanut Products Softening?Southern Ag Today 2(2.1). January 3, 2022. Permalink

  • More Cattle Placed and Marketed Expected

    More Cattle Placed and Marketed Expected

    Against a backdrop of rising cattle and calf prices and falling wholesale beef prices, USDA is to release the final Cattle on Feed report of the year on December 23rd.  Cattle producers in the South are significant suppliers of feeder cattle throughout the Plains and Corn Belt.    

    Both feedlot marketings and placements in November 2021 are expected to be about 4.5 percent larger than November 2020.  There was one more slaughter day this November implying slightly lower daily average marketings than last year.  If correct, these marketings would also be larger than in 2019.  While placements this year are expected to be larger than in 2020, if the estimates are correct, they would be fewer than in each November from 2017 to 2019.  Fewer feeder cattle were imported from Mexico during the month while slightly more were imported from Canada.  Placements in the expected range would follow the normal pattern of declining sharply from October’s placements.

    The combination of marketings and placements leaves the number of cattle on feed slightly below last year.  On feed inventories typically increase from November to December and the December inventory is often the highest for the year.  December 2021 should be an exception to that with on-feed inventories in February being larger.  If the estimates are correct, this December would be the 6th consecutive month with fewer cattle on feed than the year before.  

    Merry Christmas!


    Recommended citation format: Anderson, David. “More Cattle Placed and Marketed Expected.” Southern Ag Today 1(52.2). December 21, 2021. Permalink

  • Getting to Know FLOID

    Getting to Know FLOID

    Many associate the phrase “breakeven” as the point where revenue and operating expenses are equal.  But for ag producers, this breakeven point may leave significant cash needs unmet.  Producers will need cash for interest obligations, payments on long-term debt obligations and family living and income taxes in addition to operating expenses.  FLOID helps producers calculate their annual total cash requirements for the farming operation.

    In the above example, the producer needs $1,160,000 of revenue to meet its whole farm cash requirements. If operating expenses are removed from FLOID, FL_ID remains, which totals $250,000 in this example.  FL_ID is the earnings (EBITDA-Earnings Before Interest, Taxes, Depreciation, and Amortization) required to fulfill all cash obligations.

    FLOID can also be used to calculate breakeven cash prices for each commodity in consideration.  The table below provides a 2-step process for a hypothetical producer in the southeastern United States.

    This information is useful to help determine the crops to grow by comparing current price expectations to actual prices being offered via futures, cash forward contracts or production contracts.  Producers also use this information to evaluate changes needed in production costs or yield to achieve breakeven commodity prices for their operation.

    Consider attending the 2022 Executive Marketing seminar to develop your own pricing signals using FLOID.  Details can be found at www.clemson.edu/extension/agribusiness.


    Recommended citation format: Mickey, Scott. “Getting to Know FLOID.” Southern Ag Today 1(52.1). December 20, 2021. Permalink