Blog

  • Thoughts on Two Big Cattle Reports

    Thoughts on Two Big Cattle Reports

    USDA released its Cattle on Feed and July Cattle inventory reports on Friday, July 25th.  These reports are a good opportunity to poll some thoughts from our SAT authors across the South.

    Will Secor – University of Georgia

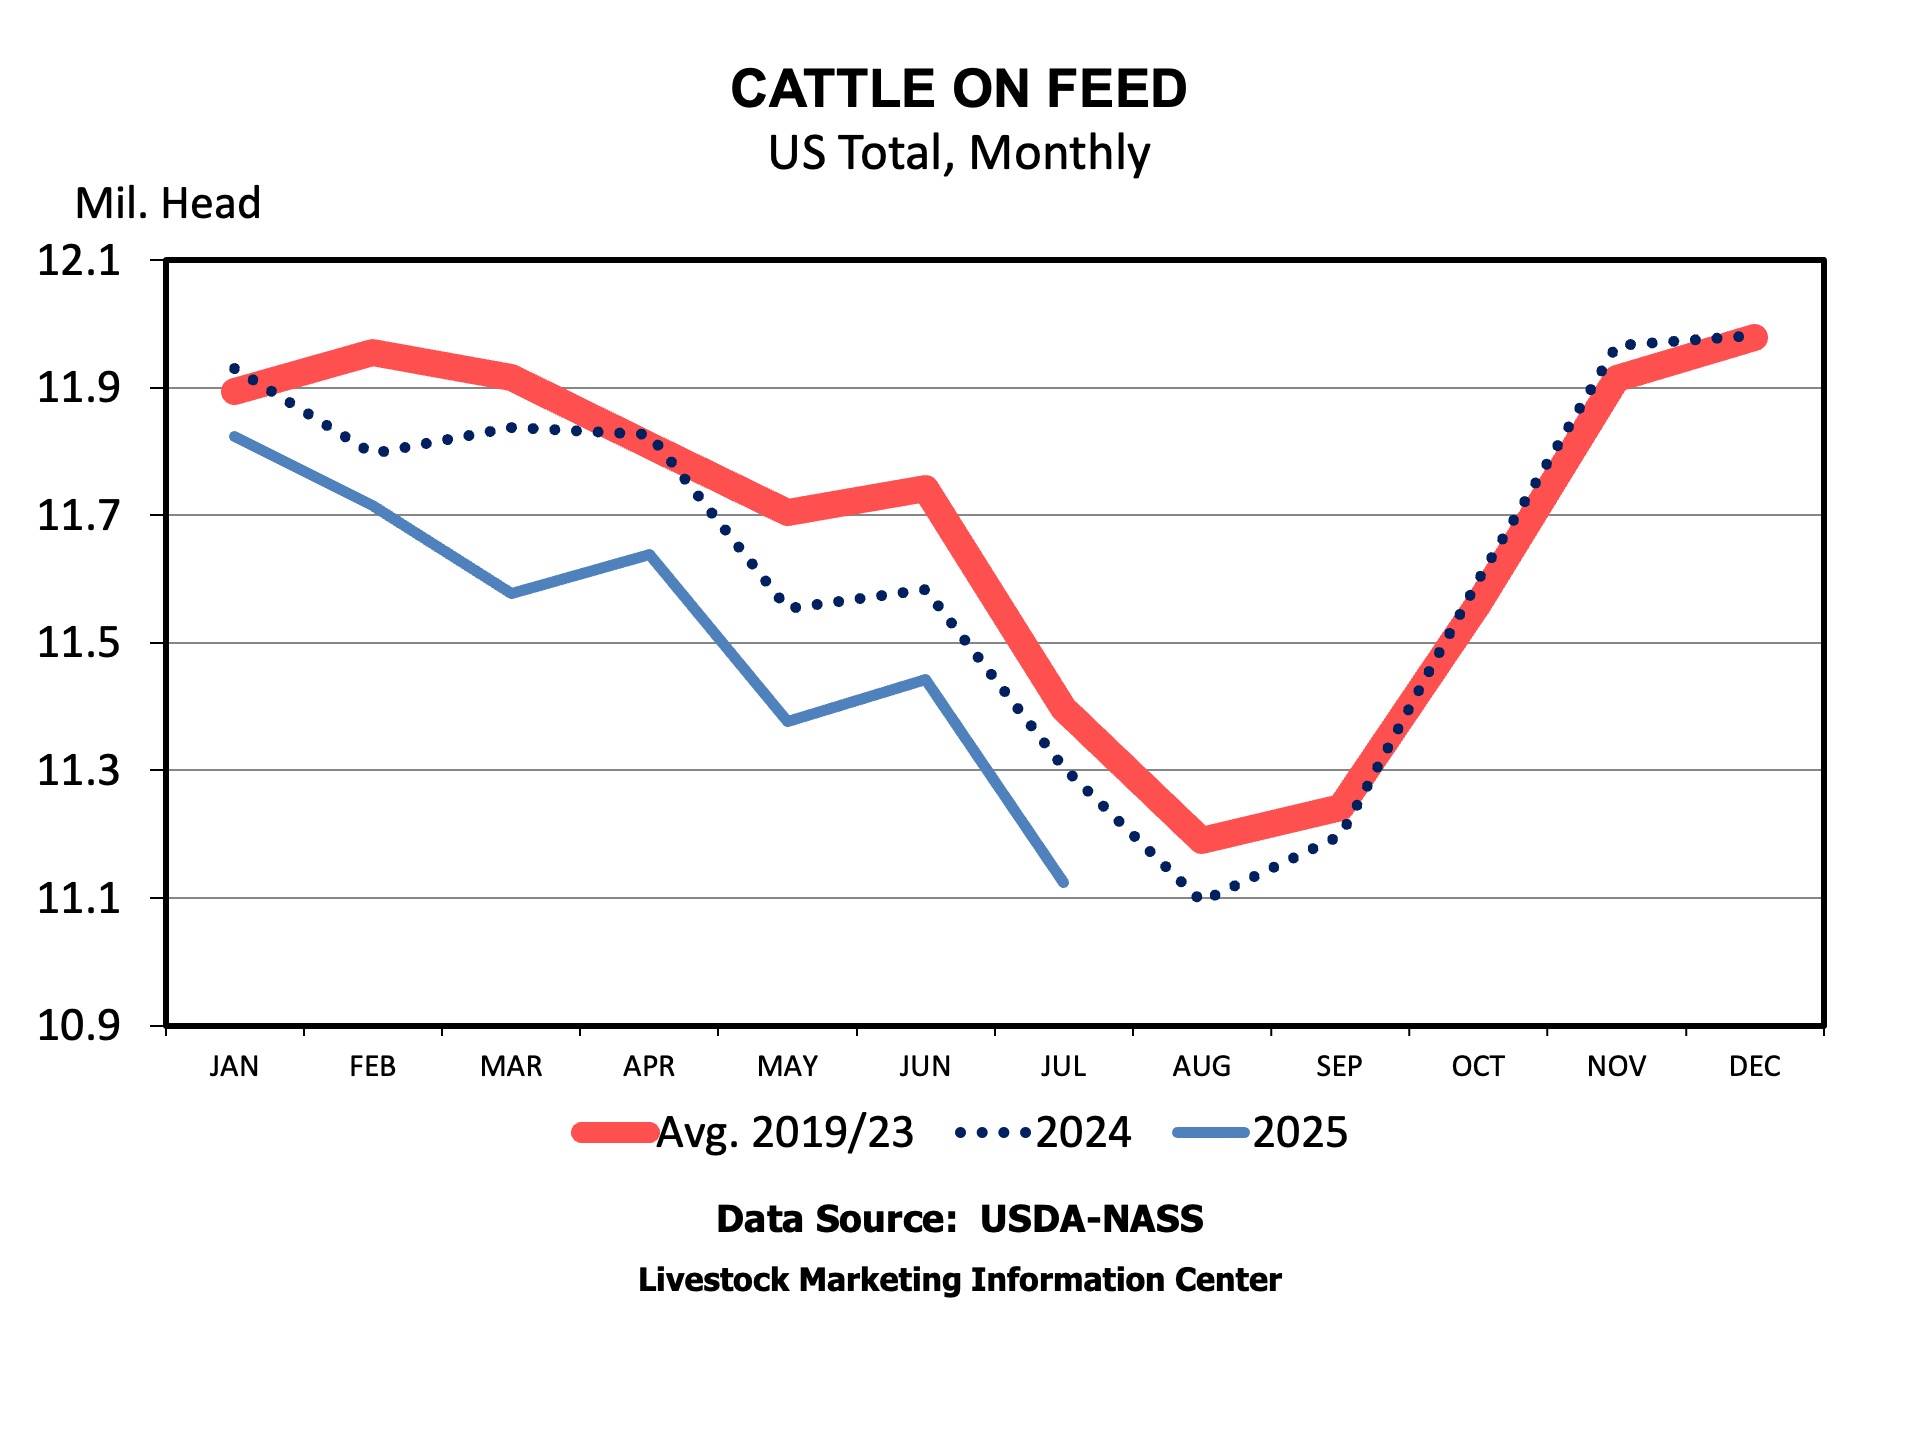
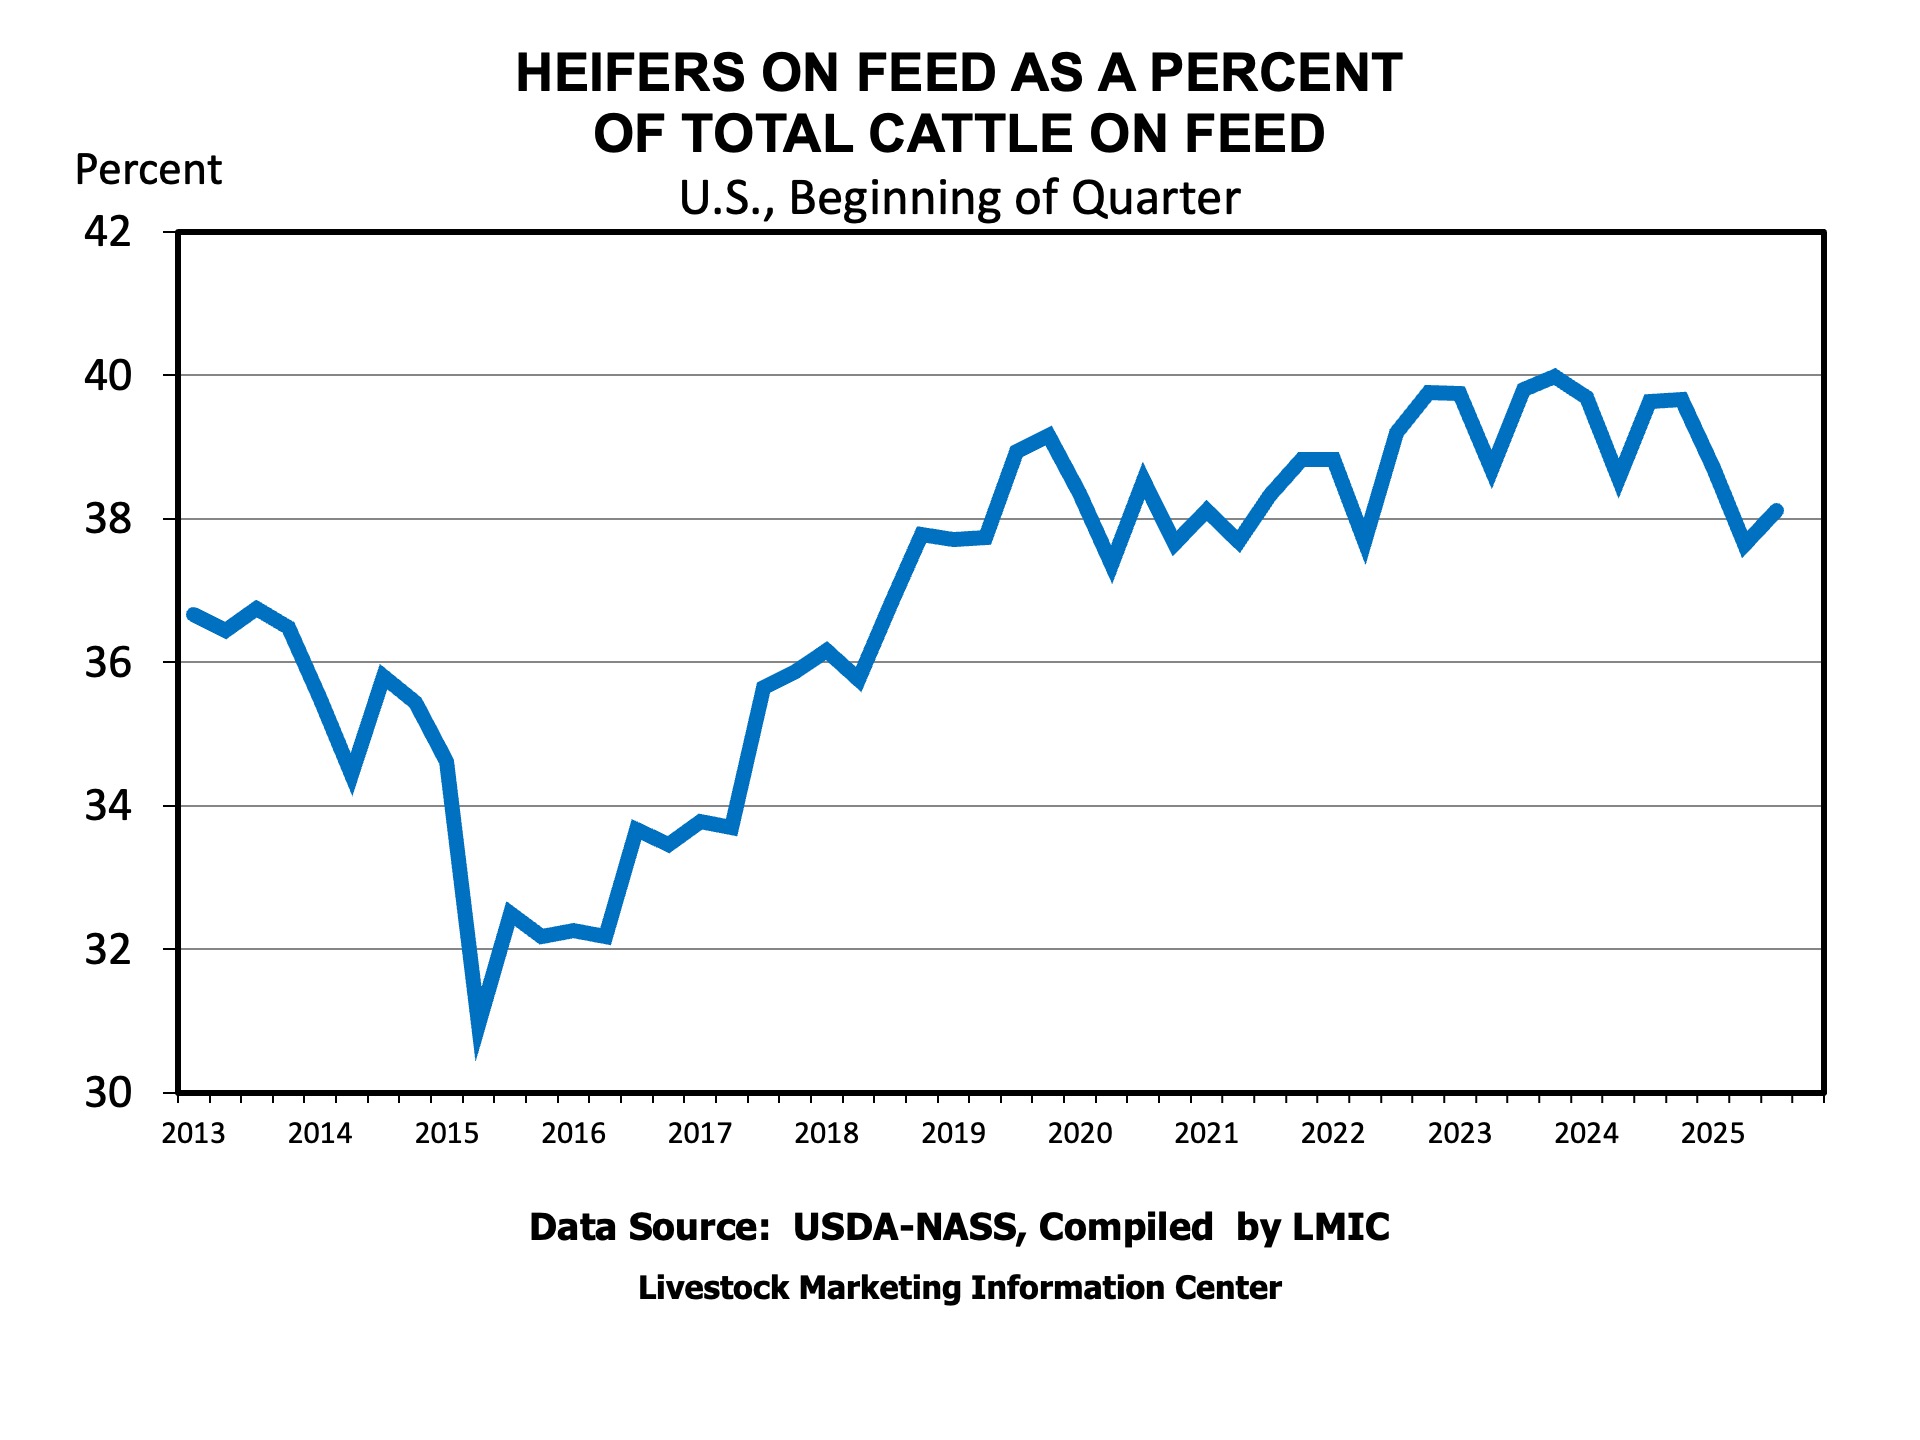
    The July Cattle and Cattle on Feed reports from USDA provided indications that the cattle herd is approaching a low in inventory but may not be there just yet. The mid-year Cattle report provided a first estimate of the 2025 calf crop, which is projected to be roughly 1.3 percent smaller than the 2024 calf crop. Combined with January’s report of fewer beef cow replacement heifers, this is an indication that the cattle herd may still be smaller come January 2026. However, the Cattle on Feed report indicates that the share of cattle on feed that are heifers declined again year-over-year to its lowest July reading since 2019. Overall, these reports show a continued decline in the cattle inventory, but they also shed some light on the potential of a rebuild that may be starting soon.

    Kenny Burdine – University of Kentucky

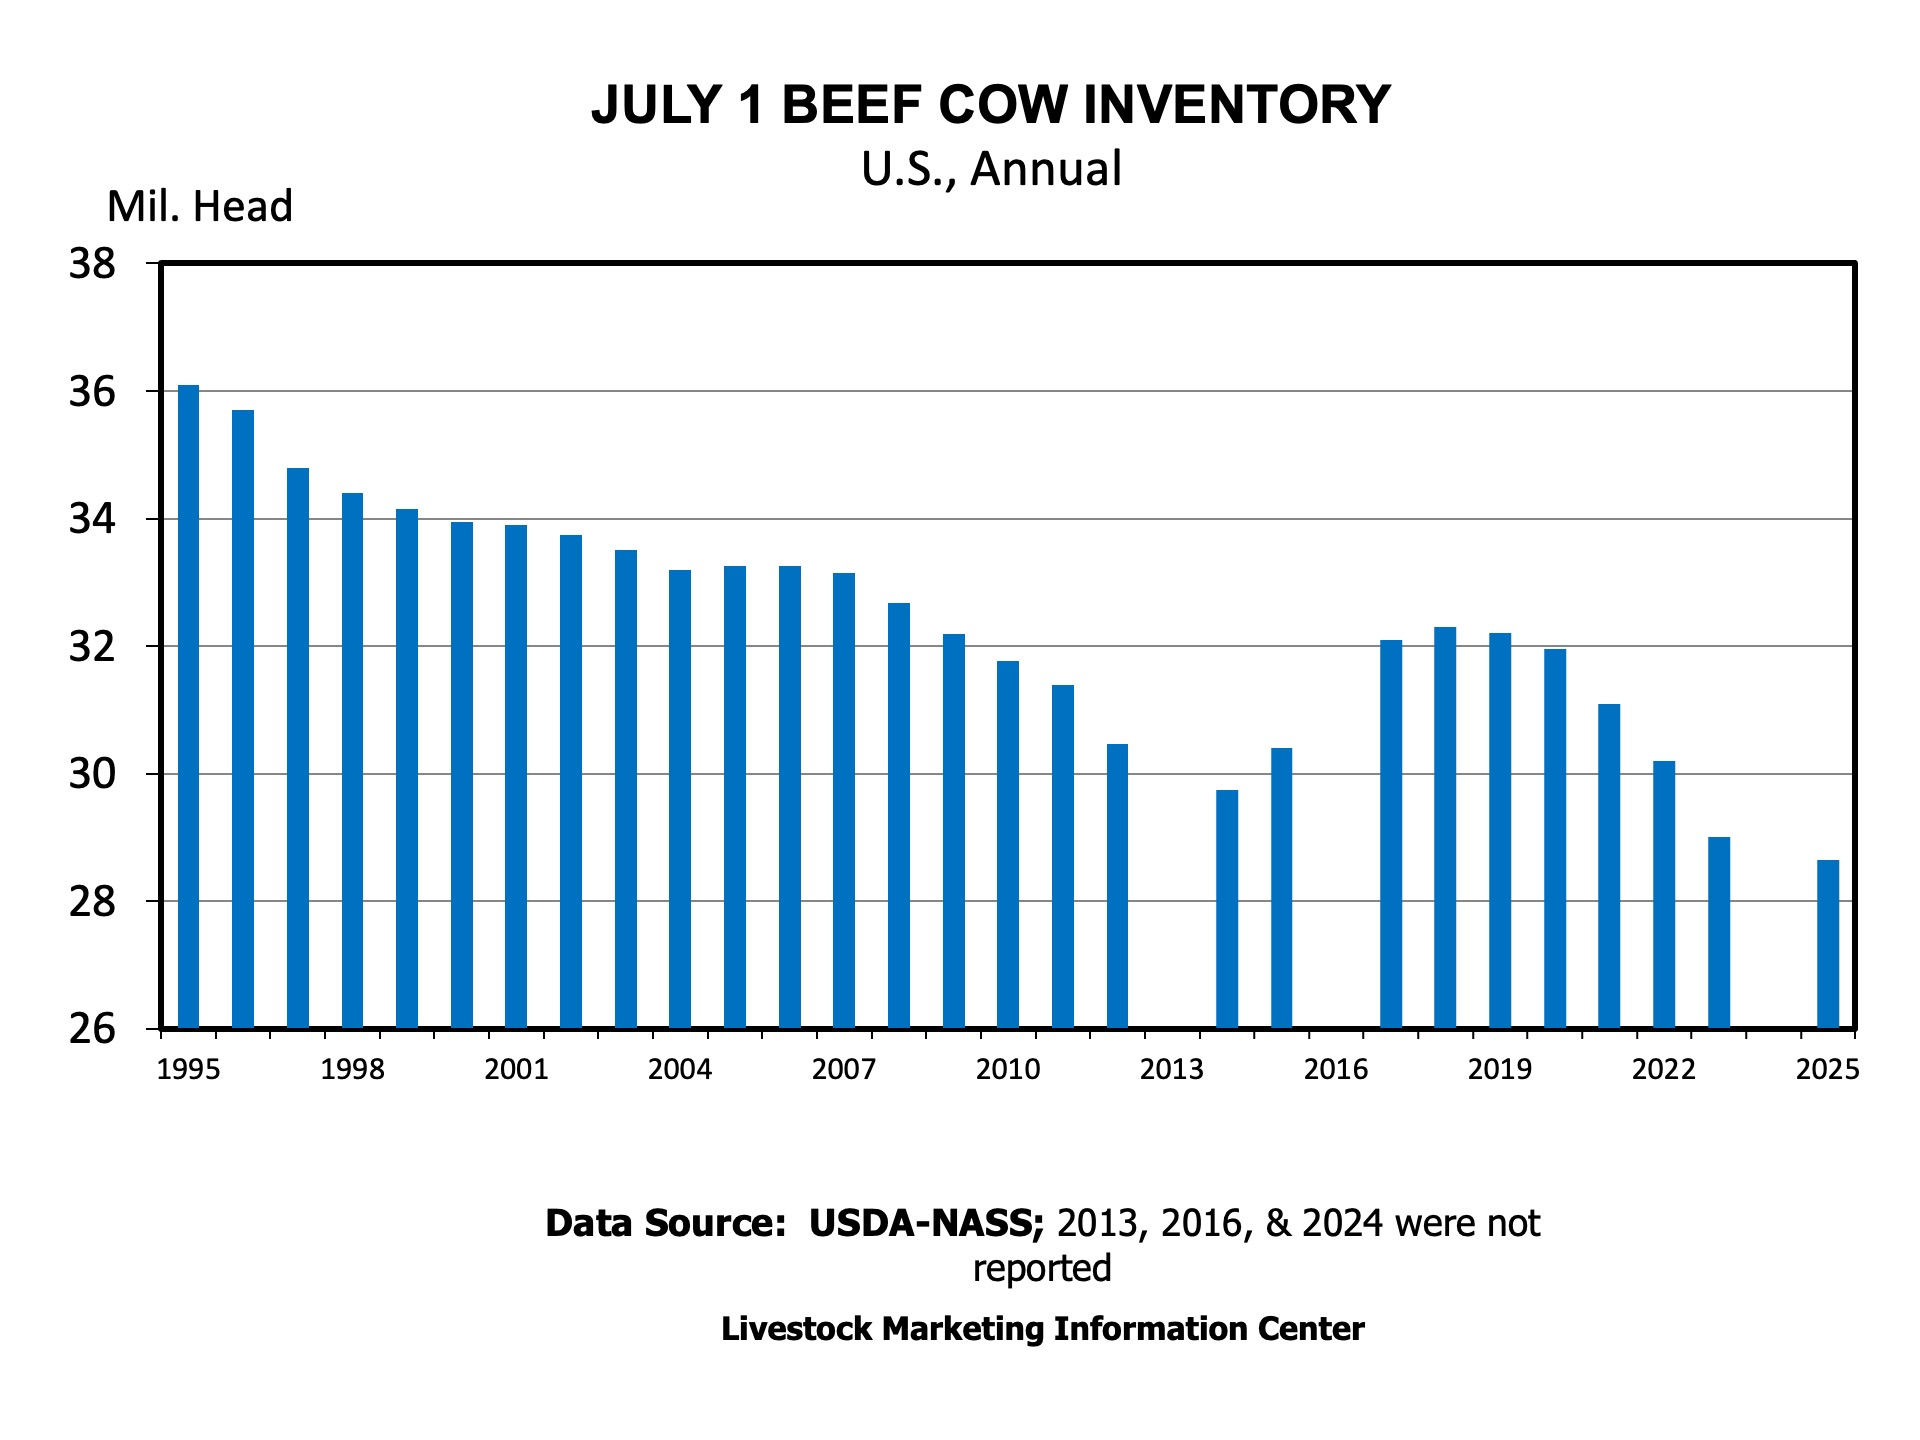
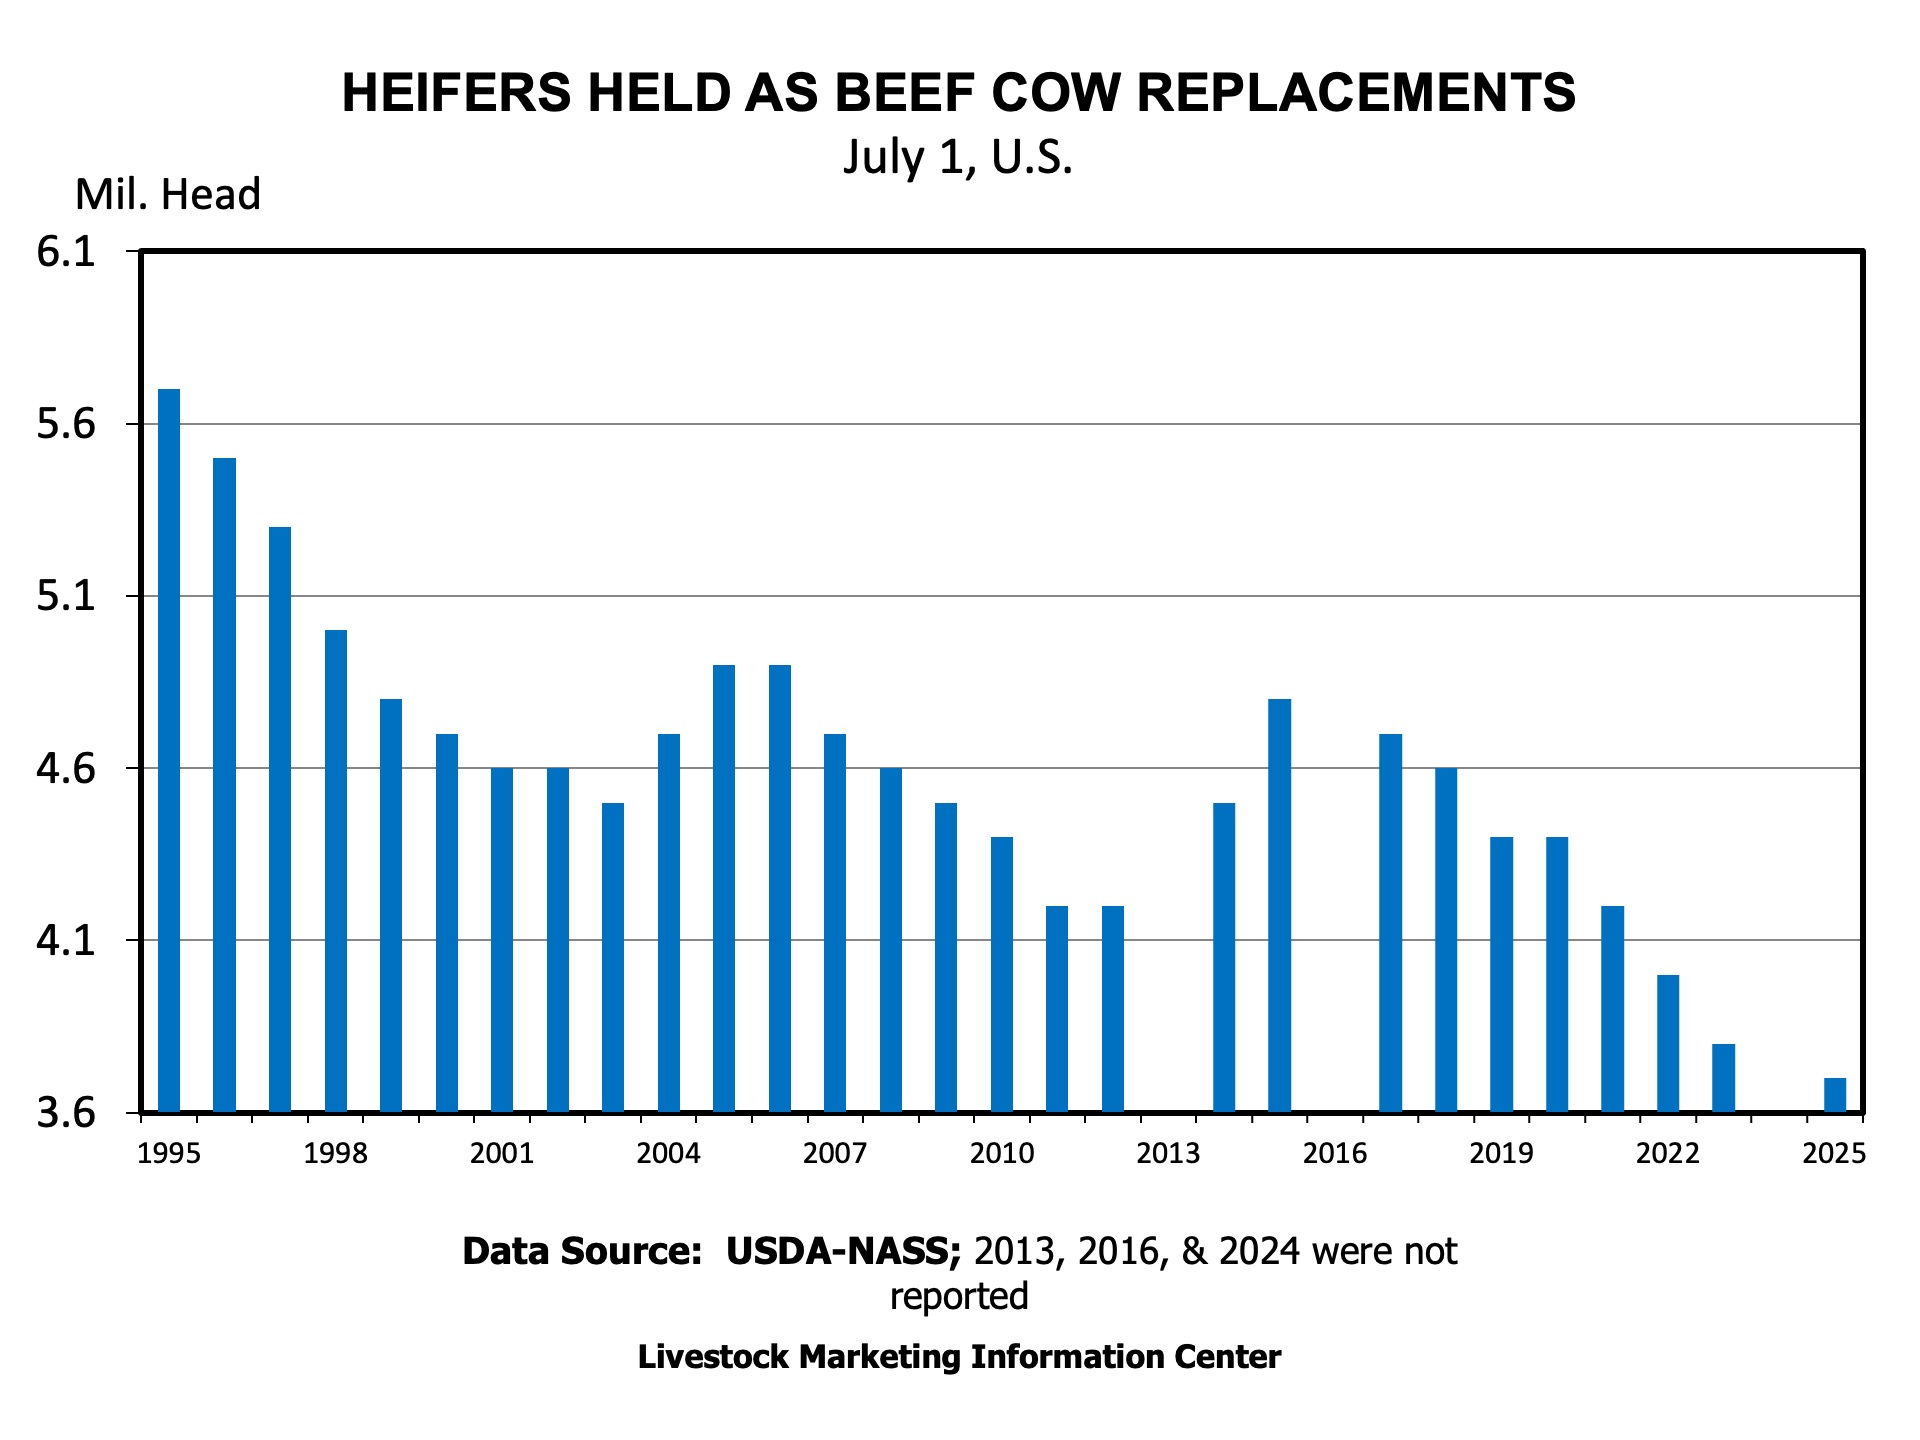
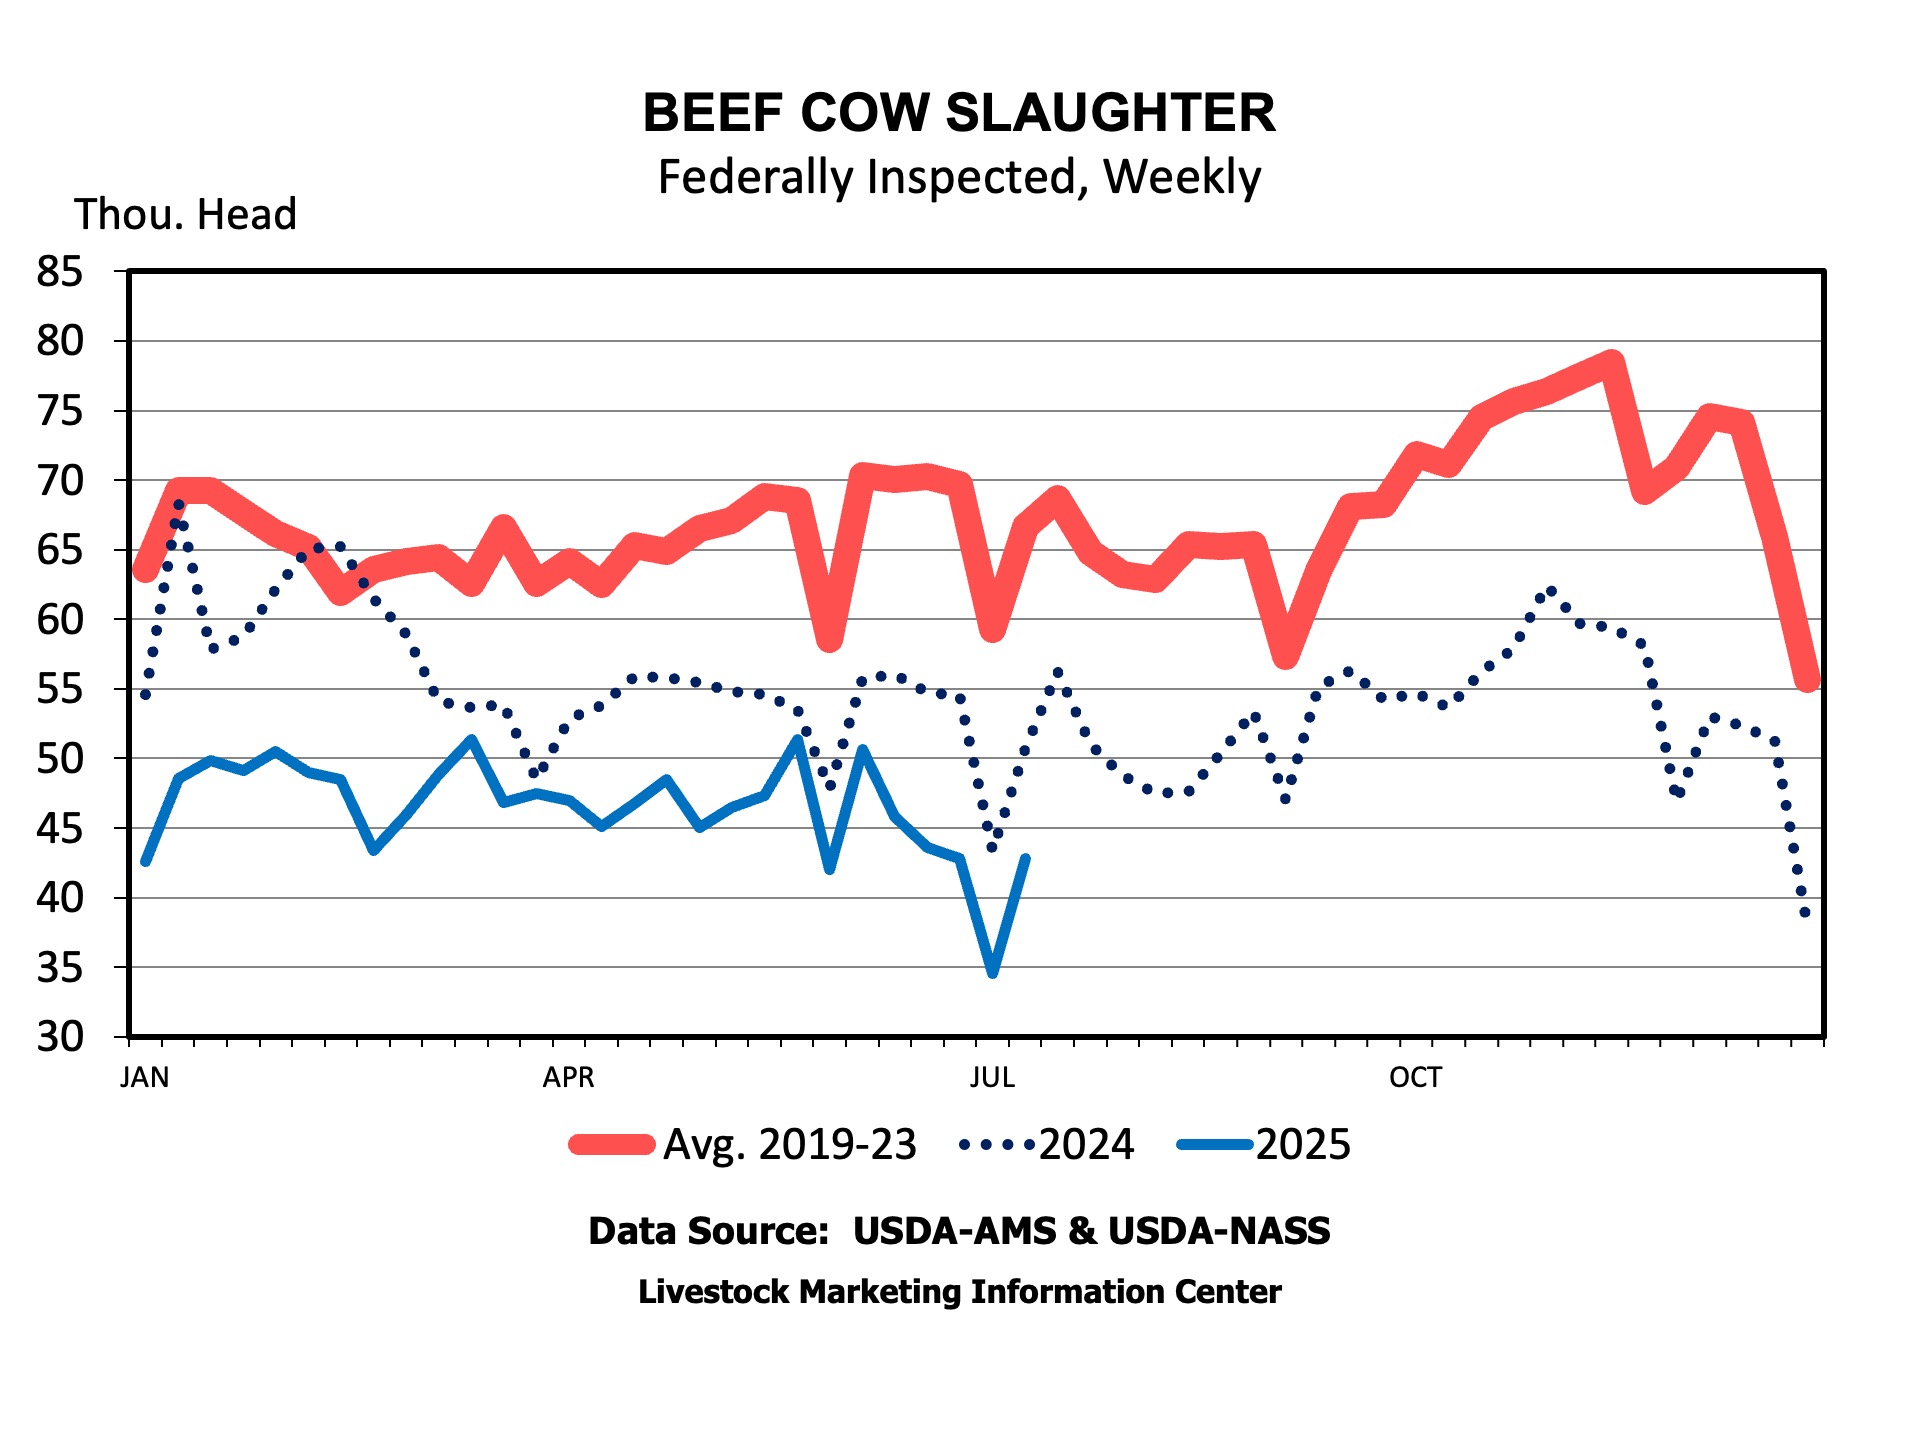
    The fact that there was no mid-year inventory report in 2024 makes comparison a bit difficult. Beef cow inventory was down by 1.2% from July of 2023. Most were expecting beef cow inventory to be down a bit more over the last two years, but I think this speaks to how much lower beef cow slaughter has been running. For the 12 months from July 2024 to June 2025, nearly 650,000 fewer beef cows were harvested than from July 2023 to June 2024. I think it’s likely that beef cow inventory was down by more than that from July 2023 to July 2024, but increased over the last 12 months due to lower slaughter levels.  Heifers held for beef cow replacement were down 3% from 2023, which is a decrease of 100,00 head. The best way to think about this number is to consider it as a percentage of beef cow inventory. When looking at it that way, our heifer retention pace is lower than it was in 2023. 


    The surprise of this quarterly cattle-on-feed report was June placements, which were down 8% from 2024 and outside the range of expectations. Marketings continue to suggest we may be pulling cattle ahead, but placements suggest we are not replenishing them at the same pace.

    Heifers, as a percentage of on-feed inventory, came in at 38.1%. This is about a percent and a half lower than July 1 of 2024, but up about half a percent from April of this year. Much like the beef replacement heifer estimate from the inventory report, this does not suggest much retention is occurring. Any growth in beef cow numbers is coming from reduced cow slaughter.

    Shifting my focus towards home, I don’t think much retention is occurring in Kentucky at present. Anecdotally, producers tell me they are not keeping heifers at these price levels. I also think interest rates are impacting this decision. I do expect some expansion to occur in the Commonwealth over the next few years, but we are limited by land constraints and land costs.

    Andrew Griffith – University of Tennessee

    I don’t really know what to say about these reports. A lot of the time we discuss industry estimates compared to USDA estimates. The main thing in this report is we saw lower beef cow numbers, a smaller calf crop, and fewer cattle on feed.  

    It looks like more heifers are being retained this year and fewer cows are being slaughtered. There is a good chance we see a steady to slightly higher beef cow number come January 1, 2026. Of course, drought could hit once again and further delay rebuilding.


    The one thing I feel certain is that the competition for cattle is going to be fierce the next couple of years. I think we will see closures, idling, or consolidation of packing plants and feedlots. Even if that does not happen, capacity utilization is going to be small. This also feeds back to stocker and backgrounders who will be growing a smaller number of cattle than usual, which will influence profitability.

    Josh Maples – Mississippi State University

    I don’t see significant signs of expansion from these reports. Heifers held for beef cow replacement were down 3% from the 2023 report. The 5% drop in heifers placed into feedlots during the last quarter is the number that jumps out as the question mark. But, taken with all of the other data, I’m not yet ready to call it an obvious sign of expansion. After accounting for fewer imports from Mexico, heifer placement is down 2.5% during the first half of 2025 compared to the first half of 2024. It could just be that we have fewer heifers due to smaller calf crops, and that there are some differences in placement timing.  The overall percentage of heifers on feed ticked back up to 38% after dropping in the previous quarter. I think 2025 is likely a stabilization year for beef cow inventory, with 2026 having the higher odds for modest expansion if pasture conditions cooperate.

    Hannah Baker – University of Florida

    While the 2025 July Inventory Report does not include state breakdowns, the numbers reported in both the inventory and cattle on feed reports reflect what is happening across Florida: some producers are thinking of and starting to retain heifers, but the majority are still capitalizing on record-high calf prices. Beef replacement heifers are down 3 percent from 2023, and the beef cow herd is smaller by 350,000 head. The number of “other heifers over 500 pounds” is also 3 percent lower than 2023, meaning there is also a smaller pool of heifers to pull from for any impulse breeding in the back half of 2025 and early 2026. Signs of slow heifer retention are also shown in the Cattle on Feed report, where the number of heifers on feed was 5% lower than 2024, but the percentage of heifers on feed rose by 0.5% since April to 38.1%. 

    James Mitchell – University of Arkansas

    A statistic I like to track is the ratio of July beef replacement heifers relative to the previous year’s calf crop (as estimated in the January report). I use this as a crude indicator of retention and potential herd expansion. The estimate for July 2025 is 11.04%, nearly identical to July 2023 at 11.03%. For comparison, the ratio was 14.32% in July 2015. We’re not there yet, which makes me wonder: with strong profitability over the last few years, are producers reinvesting in other ways – farm infrastructure, equipment, land? 

    Charley Martinez – University of Tennessee

    It’s unfortunate that we didn’t have last year’s July 1 report. But, when looking at the percentage of changes between 2023 and 2025, I think the trends were expected. The most interesting statistic to me was the expected 2025 calf crop of 33.1 million head. The calf crop was 33.56 million in 2023, and 33.52 million in 2024. The calf crop expectation highlights the impacts of the shrinking herd over the last two years, and the expected tighter feeder calf supply signals continued elevated feeder calf prices. This report also starts the excitement for the January 1 report, where we will have statistics and more detailed data. 

  • Who’s Buying Farmland? A Look at Mississippi’s Agricultural Land Market

    Who’s Buying Farmland? A Look at Mississippi’s Agricultural Land Market

    Farmland is one of the most important assets for agricultural producers, serving as both a source of income and a foundation for their livelihood. With continued strong demand for agricultural land, farmland values in the Southern U.S. have steadily increased over time. According to the USDA Economic Research Service, the compound annual growth rate of farmland values between 2018 and 2024 was around 5 percent. 

    However, in recent years, there has been growing discussion that demand for farmland isn’t coming solely from producers. From media reports and even casual conversations with neighbors, we often hear about billionaires purchasing large tracts of farmland or significant parcels being sold to developers. Yet despite these stories and the concerns they raise, there is little concrete information about how frequently non-producer buyers are participating in the farmland market. This leads us to an important question: How active are non-agricultural buyers in today’s agricultural land market?

    Using transaction-level data from lending institutions in Mississippi covering the period from 2019 through the first half of 2023, we can begin to understand the different types of buyers in the agricultural land market. Buyers are categorized into four groups: (1) individuals and general partnerships (GPs), likely involved in agricultural production; (2) financial and real estate businesses; (3) non-individual/non-GP agricultural businesses; and (4) other industries. Other than the first group (individuals and GPs), the rest are limited partnerships, limited liability companies, and corporations, and they are grouped based on the North American Industry Classification System (NAICS) codes. 

    Figure 1: Number of Agricultural Land Transactions by Buyer Type

    Figure 1 shows the number of farmland transactions completed by four groups between 2019 and the first half of 2023: (1) individuals and general partnerships (GPs), (2) financial and real estate businesses, (3) non-individual/non-GP agricultural businesses, and (4) all other business entities.

    What we find is that the majority of farmland transactions in Mississippi are predominantly carried out by individuals and GPs. Between 75% and 83% of all transactions during this period involved buyers from this group. The presence of financial and real estate businesses in the market has grown over time, even though their overall share still remains somewhat small. Their share of total farmland transactions ranges between 6.36% in 2019 and 10.42% in the first half of 2023—surpassing the share of non-individual/non-GP agricultural businesses, which ranged from 7% to 9% during the same period. The final group—comprised of other businesses such as those in construction, warehousing, and unrelated industries—accounted for approximately 4% to 6% of total transactions.

    In summary, individuals and general partnerships (GPs) remain the most active participants in the farmland market in terms of transaction frequency. However, there is an increase in the number of non-individual/non-GP buyers, particularly financial and real estate developers. While this external demand may help support farmland values, it can also contribute to upward pressure on land prices—bringing both potential benefits and challenges for agricultural producers. Moreover, this shift in ownership patterns coincides with a long-term decline in U.S. farmland acreage, but identifying the actual relationship will require more rigorous examination. As the farmland market continues to evolve, understanding who is buying agricultural land—and why—becomes increasingly important. Continued monitoring of buyer trends can help inform policy discussions, land use planning, and long-term strategies.


    Kim, Kevin, Hudu Abukari, Ayoung Kim, and Brian E. Mills. “Who’s Buying Farmland? A Look at Mississippi’s Agricultural Land Market.Southern Ag Today 5(31.1). July 28, 2025. Permalink

  • Nonprofit Organizations and Community Engagement: Bridging Gaps in Local Support

    Nonprofit Organizations and Community Engagement: Bridging Gaps in Local Support

    In the Centers for Disease Control and Prevention (CDC) 2025 publication Principles of Community Engagement, community engagement is defined as building “sustainable relationships through trust and collaboration, strengthening community well-being”. Wallerstein et al. (2015) emphasized that essential strategies for a wide variety of community and organizational settings can be developed through community engagement and organizing. The recent flash flooding in Central Texas over the July 4th holiday weekend is an example of this engagement with numerous nonprofit charitable organizations involved in search, rescue, cleanup, and support efforts. These organizations include Texas Search and Rescue (TEXSAR), Texas Division of Emergency Management (TDEM), the Federal Emergency Management Agency (FEMA), the Community Foundation of the Texas Hill Country, the Salvation Army, the American Red Cross, Kerrville Pets Alive, and many others. This article explores the contributions of charitable nonprofit organizations to community development, showcasing selected models of engagement and their broader regional impact in the southern U.S.

    Community engagement through charitable organizations is a cornerstone of sustainable economic and social development across the United States (Wallerstein et al. 2015; Balsano 2005). These organizations support jobs and consume goods and services, thereby investing directly and indirectly into the local economy and contributing to community economic development. Furthermore, their community involvement and presence encourage charitable giving. Giving USA (2025) reported an overall increase in charitable donations of 6.3% in 2024, although there have been fluctuations in donations over the past five years. Studies have found that individuals receive some level of personal satisfaction when they donate (Crumpler and Grossman 2008; Hughes 2006; Steinberg 1997). Figure 1 shows that revenue per capita and the share of nonprofit relative to private employment are more concentrated in the northern United States, with relatively lower levels in the southern states. This regional disparity highlights lower nonprofit revenue per capita and fewer paid staff or volunteers relative to the for-profit private sector in southern communities. 

    The Southern region’s unique challenges, including higher poverty rates, food insecurity, and more frequent natural disasters compared to other U.S. regions (Thomas and Liao 2024), underscore the critical role of non-profit organizations in community development. Non-profit organizations such as regional food banks, Lions Club International, and Rotary Club have emerged as crucial partners in addressing some of these challenges through targeted interventions and community mobilization. For instance, the U.S. Department of Agriculture (USDA) reported that 14% of households in the Southern U.S. faced food insecurity between 2021 and 2023, leading to a rise in demand for food assistance from regional food banks. Lions Club International’s southern chapters implemented over 2,500 community service projects in 2022, focusing on vision care, diabetes prevention, and youth development programs. These organizations leverage volunteer networks and community resources to address immediate needs while building long-term resilience through education, health services, and disaster preparedness initiatives.

    A more localized nonprofit is the Texas A&M University’s The REACH Project, which exemplifies innovative approaches to community development through academic-community partnerships. This project has demonstrated remarkable success in supporting essential workers through comprehensive support services. Currently, it has assisted over 3,000 essential workers and their families, providing access to affordable housing solutions, healthcare services, and educational opportunities. Similar initiatives have emerged in Alabama, such as the Black Belt Community Foundation, the foundation awarded over $500,000 in 2024 through 130 grants to community and arts organizations across 12 counties. The initiative supports local efforts in community development and the arts, reflecting its commitment to empowering the Black Belt region. These programs demonstrate the effectiveness of collaborative approaches involving academic institutions, local communities, and non-profit organizations in fostering sustainable development.

    The impact of charitable non-profits on communities extends beyond immediate service delivery to fundamental social and economic transformation. Research indicates that communities with higher levels of non-profit engagement demonstrate greater resilience during economic downturns and natural disasters (Roberts et al., 2021; Searing et al., 2023). According to Giving USA (2025), nonprofits that retained 10% more of their donors experienced up to a 200% increase in fundraising revenue during the 2023 economic downturn, demonstrating how sustained nonprofit engagement enhances financial resilience. As the southern region faces evolving challenges from climate-related disasters to economic disparities, charitable non-profits play an increasingly vital role in community development. Strengthening collaboration with these organizations represents a crucial investment in building more resilient and sustainable communities.

    Figure 1: Nonprofit Revenue Per Capita and Private Nonprofit Employment Share by State in 2023

    Source: Visualized by authors using National Council of Nonprofits, State Nonprofit Data and Report, and U.S. Census Data.

    References

    Balsano, A.B. 2005. Youth civic engagement in the United States: Understanding and addressing the impact of social impediments on positive youth and community development. Applied Development Science 9(4): 188-201.

    Black Belt Community Foundation. Retrieved April 15, 2025, from https://blackbeltfound.org/news/2025artscommunitygrants/.

    Centers for Disease Control and Prevention: CDC/ATSDR. 2025. Principles of community engagement (3rd ed.). https://hsc.unm.edu/population-health/_documents/principles-of-community-engagement_3rd-edition.pdf

    Crumpler, H., and P. Grossman. 2008. An experimental test of warm glow giving. Journal of Public Economics 92(5-6): 1011-1021. https://doi.org/10.1016/j.jpubeco.2007.12.014

    Hughes, P. 2006. The economics of nonprofit organizations. Nonprofit Management and Leadership 16(4): 385-508. https://doi.org/10.1002/nml.119

    Lions Clubs International. Southern Region Community Service Impact Report 2022. Retrieved April 15, 2025, from https://www.lionsclubs.org/en/discover-our-clubs/service-report-2022.

    National Council of Nonprofits. (n.d.). Economic impact of nonprofits. Retrieved July 15, 2025, from https://www.councilofnonprofits.org/about-americas-nonprofits/economic-impact-nonprofits.

    Roberts, F., F. Archer, and C. Spencer. 2021. The potential role of nonprofit organizations in building community resilience to disasters in the context of Victoria, Australia. International Journal of Disaster Risk Reduction 65. https://doi.org/10.1016/j.ijdrr.2021.102530.

    Searing, E.A.M., K. Wiley, and S.L. Young. 2023. Resiliency tactics during financial crisis. In The Nonprofit Resiliency Framework, Routledge. https://doi.org/10.4324/9781003387800-34.

    Steinberg, R. 1997. Overall analysis of economic theories. Voluntas 8 (2): 179–204.

    The REACH Project. Retrieved April 15, 2025, from https://agsreach.networkforgood.com/.

    Thomas, C., and A. Liao. 2024. The Food Insecurity Challenge: A Snapshot of the Southern U.S. Southern Ag Today 4(40.5). October 4, 2024. https://southernagtoday.org/2024/10/04/the-food-insecurity-challenge-a-snapshot-of-the-southern-u-s/

    United States Department of Agriculture. Economic Research Service. Retrieved April 15, 2025, from https://www.ers.usda.gov/data-products/food-security-in-the-united-states.

    Wallerstein, N., M. Minkler, L., Carter-Edwards, M. Avila, and V. Sanchez. 2015. Improving health through community engagement, community organization, and community building. In K. Glanz, B.K. Rimer and K. Viswanath (Eds.), Health behavior: Theory, research, and practice (pp. 277-300). Wiley.


    Thomas, Chrystol, An-Ting Liao, and Sreedhar Upendram. “Nonprofit Organizations and Community Engagement: Bridging Gaps in Local Support.Southern Ag Today 5(30.5). July 25, 2025. Permalink

  • Will Brazil Close the Quality Gap with U.S. Beef in Japan?

    Will Brazil Close the Quality Gap with U.S. Beef in Japan?

    In a recent Southern Ag Today article, Muhammad et al. (2025) explored whether Brazil can compete with the U.S. in Japan’s premium beef market. They found Brazil has the volume but questioned the quality. This article digs deeper, showing how advances in genetics and feeding systems may close the gap.

    Two key forces shape beef quality: genetics and nutrition. Historically, Brazil relied on grass-fed Nellore cattle (Bos indicus), which yield leaner, less marbled meat. However, change is underway.

    Crossbreeding with British breeds such as Angus is increasing rapidly. Angus semen accounted for 49% of all beef semen sales in 2021 (USDA–FAS, 2021). In 2024, British breeds made up a third of sales, driven by demand for marbling and tenderness (ASBIA, 2024).

    Meanwhile, Nellore genetics are also improving. Breeding programs have targeted carcass quality for over two decades. In 2024, more than 14.6 million beef cows, 22.3% of the national beef herd (Figure 1), were artificially inseminated (ASBIA, 2025). Over 420,000 purebred Zebu calves were registered that year, reflecting long-term investments in breeding (ABCZ, 2024).

    Nutritional gains have kept pace with advancements in genetics. Brazil rapidly expanded its feedlot systems, especially in the central-west and southeast regions. These enable grain finishing, improving marbling and consistency, key traits for markets like Japan. In 2024, Brazil had over 8 million head in feedlots (Figure 2), representing a 25% increase in five years (DSM-Firmenich, 2024). In 2023, feedlot-finished cattle made up 21.3% of all beef slaughter, underscoring the growing role of confinement (CNA, 2024). Advances in mineral nutrition, feed conversion, and precision feeding have further improved carcass yield and quality.

    Brazil is no longer just a volume player. Upgrades in genetics, nutrition, and feedlot systems are reshaping its beef industry. It’s increasingly meeting premium standards. The U.S. still leads, but Brazil is narrowing the gap on quality.

    Figure 1: Number and Percentage of Beef-Breeding Cows Inseminated in Brazil 2014-2024 

    Source: ASBIA (2025)

    Figure 2. Cattle on Feedlots in Brazil 2014-2024

    Source: DSM-Firmenich, 2024

    Referneces

    ABCZ – Associação Brasileira dos Criadores de Zebu. (2024). Estatísticas do Registro Genealógico – RGN. https://www.abcz.org.br/produtos-e-servicos/area-tecnica/registro-genealogico/estatisticas

    ASBIA – Associação Brasileira de Inseminação Artificial. (2024). Index ASBIA 2024 – Beef cattle semen sales by breed. https://asbia.org.br/index-asbia/

    ASBIA – Associação Brasileira de Inseminação Artificial. (2025). Anuário ASBIA 2025. https://asbia.org.br/wp-content/uploads/Anuario/ASBIA_anuario_2025.pdf

    CNA – Confederação da Agricultura e Pecuária do Brasil. (2024, August 5). Expectativa de retorno do confinamento em 2024 frente ao cenário de custos [Technical report]. https://www.cnabrasil.org.br/publicacoes/expectativa-de-retorno-do-confinamento-em-2024-frente-ao-cenario-de-custos

    DSM-Firmenich. (2024). Panorama do Confinamento 2024 [Unpublished report].

    Muhammad, A., Martinez, C., & Hossen, M. D. (2025, March 6). Market showdown: U.S. beef faces new challenges in Japan amid Brazilian reentrySouthern Ag Today, 5(10.4). https://southernagtoday.org/2025/03/06/market-showdown-u-s-beef-faces-new-challenges-in-japan-amid-brazilian-reentry/

    U.S. Department of Agriculture – Foreign Agricultural Service. (2021). The Brazilian bovine genetics market and U.S. exports [PDF]. https://usdabrazil.org.br/wp-content/uploads/2021/03/The-Brazilian-Bovine-Genetics-Market-and-US-Exports_Brasilia_Brazil_03-01-2021-1.pdf


    Moreira, Felipe Martins, and Yuri Calil. “Will Brazil Close the Quality Gap with U.S. Beef in Japan?Southern Ag Today 5(30.4). July 24, 2025. Permalink

  • Planted Peanut Acres at 34 Year High

    Planted Peanut Acres at 34 Year High

    Farmers across the United States planted an estimated 1.9 million acres to peanuts in 2025, according to the U.S. Department of Agriculture (USDA) Acreage report released on June 30th. If realized, this would mark a 100,000 acre increase over last year’s value and would be the largest peanut plantings since 1991 (Figure 1). This is also the third consecutive year of peanut acreage increases, up from just 1.45 million acres in 2022. Low competing row-crop prices — especially cotton prices being below 70 cents per lb. — is one factor that made peanuts a somewhat more-favorable alternative in 2025. 

    Figure 1: US Planted Peanut Acres by Year

    Data Sources: USDA-NASS. Acreage Crop Production Annual Summary reports.

    The 2025 planted peanut area for all major peanut-growing states is equal to or greater than what it was in 2024, as shown in Figure 2. Georgia — the largest producing peanut state — had the biggest increase, adding 50,000 peanut acres to last year’s figure for a total of 900,000 acres. Alabama, North Carolina, and Texas added an additional 10,000 acres apiece. Georgia’s total would be its highest since 1991, Alabama’s its highest since 2015, and Texas’ its highest since 2017.

    Figure 2: 2025 Planted Peanut Acres by State and Percent Change from 2024

    Data source: USDA-NASS. Acreage. 2025.

    What could this increased peanut acreage mean for production and markets? The USDA Oil Crops Outlookreleased on July 15th reports an estimated 1.85 million harvested acres and an average peanut yield of 4,000 lb. per acre.1  This would amount to a record-high production of 3.7 million tons, a 476,000 ton increase from the 2024 level. At this level of production and current disappearance projections, 2025/26 marketing year ending stocks are projected to be 1.129 million tons, a 34% increase from the prior year. This expected increase in peanut supply would likely lead to a further decline in peanut contract prices going into next year. Overall, the USDA-ERS projects peanut prices for the 2025/26 marketing year to average $500 per ton, which is in line with the runner contracts offered this spring, and would mark an $18-per-ton decrease from last year. 

    Footnote1Keep in mind that peanut yields have been inconsistent over the past decade, so averaging 4,000 lb. per acre is far from a guarantee.


    References

    Sawadgo, Wendiam. “Peanut Yield Trends.” Southern Ag Today 4(13.1). March 25, 2024. Available at: https://southernagtoday.org/2024/03/25/peanut-yield-trends/

    USDA-ERS. Oil Crops Outlook. July 15, 2025. Available at: https://usda.library.cornell.edu/concern/publications/j098zb08p

    USDA-NASS. Acreage. June 30, 2025. Available at: https://usda.library.cornell.edu/concern/publications/j098zb09z

    USDA-NASS. Crop Production Annual Summary. Available at: https://usda.library.cornell.edu/concern/publications/k3569432s


    Sawadgo, Wendiam. “Planted Peanut Acres at Thirty-four Year High.Southern Ag Today 5(30.3). July 23, 2025. Permalink