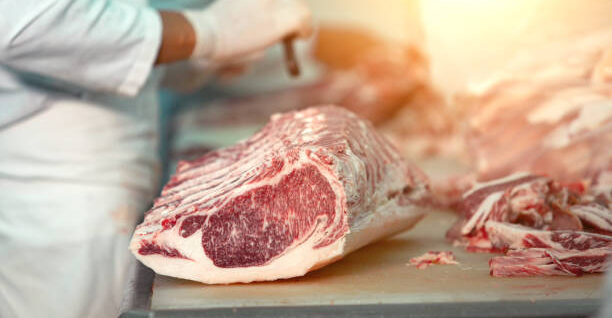
The Choice boxed beef cutout topped $400 per cwt last week and is up about $50 per cwt since the start of the year. The Choice cutout is over $400 for the first time since the 2025 highs in September. The select cutout has also surged and is at levels only surpassed by May 2020. The gap between the Choice and Select cutout has been narrow during the first few months of 2026, indicating there has not been much of a premium for Choice cattle over Select.
Boxed beef values tend to build gradually through the first quarter before accelerating in the spring and reaching a seasonal peak ahead of summer grilling season. In 2026, the cutout has surged earlier in the year as cyclical market fundamentals are outweighing typical seasonality. Cattle supplies and beef supplies are tight. When supplies are tight, wholesale prices tend to respond quickly. Additionally, buyers may be pulling some purchases forward due to expectations of tight supplies and even higher prices later this spring.
Increases in the Rib and Loin primal values since the start of the year are key contributors to the overall cutout value increase. In 2025, the Rib value ran up sharply from March to April, while the Loin value increased from March to June. This year, both primal values have been on a strong uptrend since mid-January. For producers, strong early-year boxed beef prices are supportive of fed cattle markets. Strong demand and tight supplies are supporting beef values in 2026.
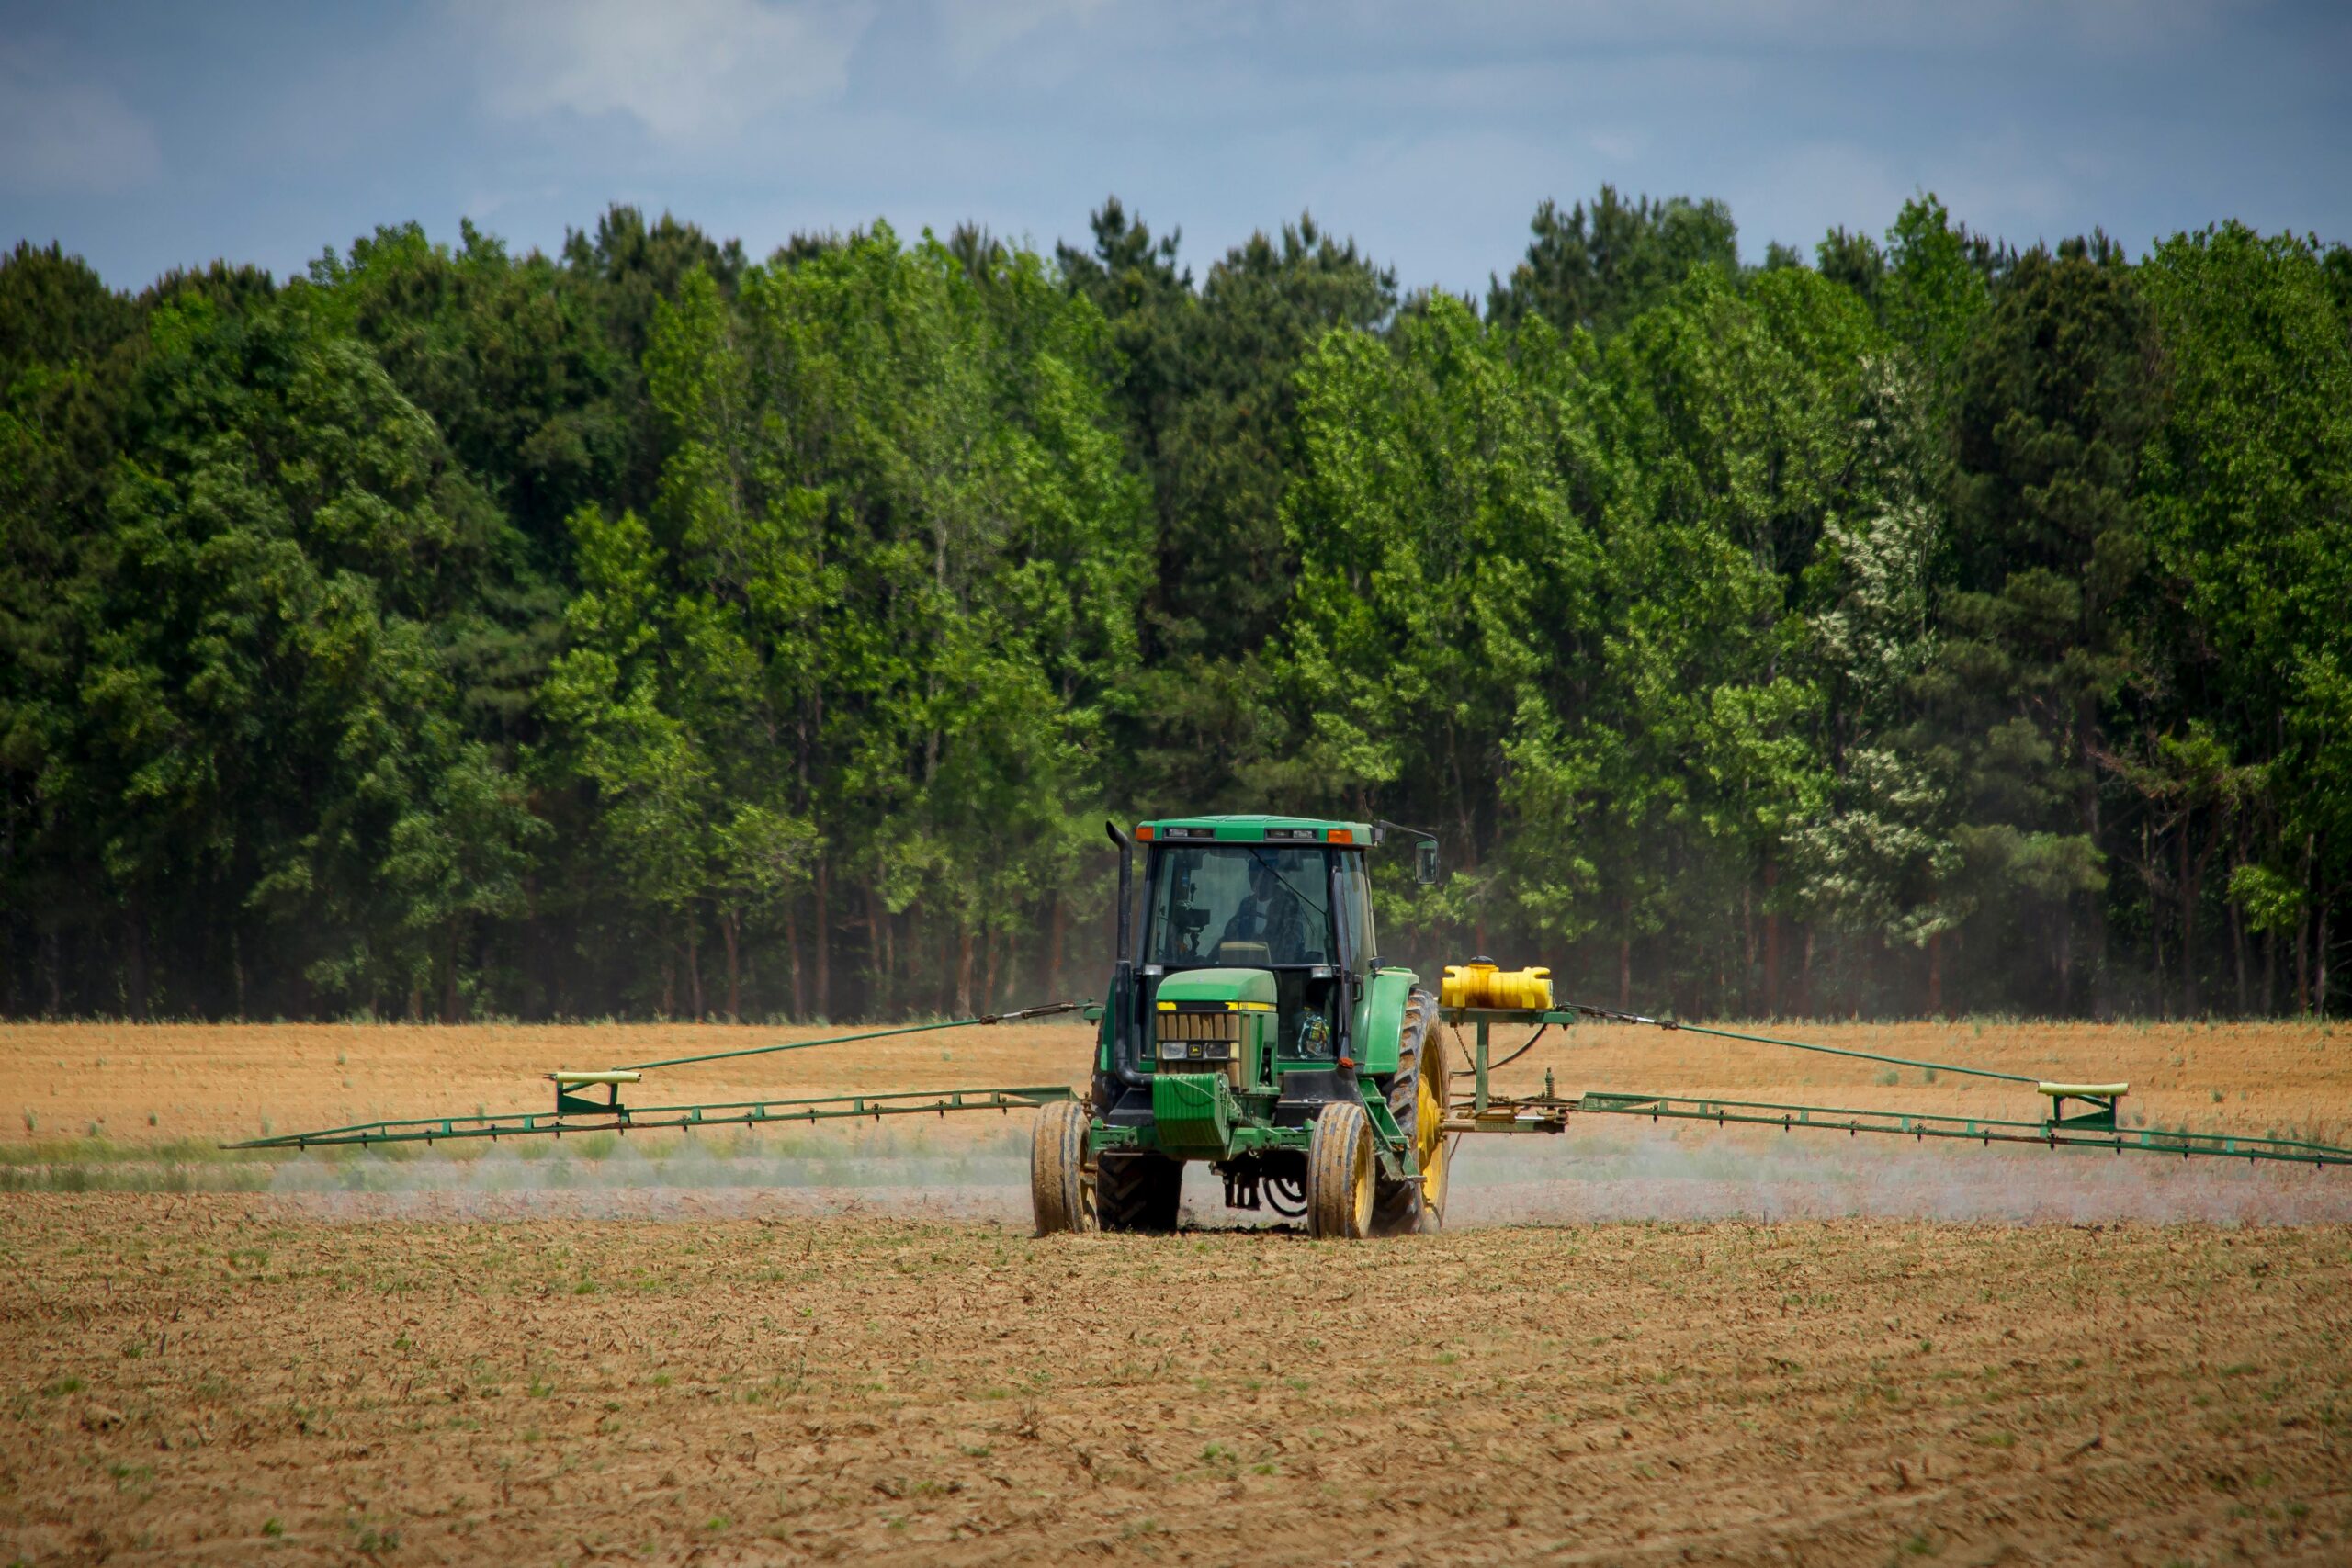
Farm equipment is a significant investment, second only to land investment for farm operations. Therefore, it is important to understand how equipment prices change over time and how that can impact a farm’s bottom line. Mississippi State University collects equipment price data every year for a large number of tractors, harvesters, implements, etc. (Gregory et al. 2025). Using that data, we can see how equipment prices have changed since 2019 and what impact that would have on costs per acre.
Figure 1 shows the purchase price for a 200-249 horsepower tractor across time. In 2019, the cost of buying this tractor was around $191,000. For 2026, the cost of this same size tractor is now $327,000, an increase of 71% (well above the rate of inflation). Also included in Figure 1 are the costs per acre for that tractor. Costs per acre are based on machine cost calculations that include labor, fuel, interest, taxes, insurance, housing, and depreciation costs. In this case, assuming that the tractor is used over 2,000 acres, the costs per acre for this tractor increased from $27.24/ac up to $41.11/ac. In other words, the same size tractor today is going to cost you $13.86/ac more than it did 7 years ago if your acreage has not changed. A producer would have to use the new tractor over 3,018 acres in order to have the same costs per acre, $27.24/ac, as it did in 2019. These per acre costs do go down on occasion, particularly when fuel prices or interest rates decline.
The purchase price and costs per acre for a cotton picker are shown in Figure 2. From 2019 to 2026, the price of a cotton picker has increased from $777,000 to $1,100,000, a 41% increase, resulting in an increase in costs per acre from $126.35/ac to $189.34/ac for the cotton picker. Lastly, the change in purchase price of a 12-row planter increased from $76,800 in 2019 to $123,600 in 2026, a 61% increase (Figure 3). This results in planter costs per acre increasing from $12.26/ac to $19.76/ac from 2019 to 2026.
Clearly, farm equipment prices have significantly increased and are likely to continue. Additionally, higher purchase costs for equipment can lead to higher financing needs and additional debt being incurred by producers. If producers are not spreading the cost of more expensive equipment across more acres, their costs of production will go up. The trend makes it harder for smaller producers to remain profitable and encourages farms to get larger and larger through economies of scale. Buying used or leasing are options to consider. Of course, some will just keep older equipment longer. Other options include equipment sharing partnerships or doing custom work for others to spread your equipment cost across more acres.
Authors: Kuan-Ming Huang, Daniel Petrolia, and Zhifeng Gao
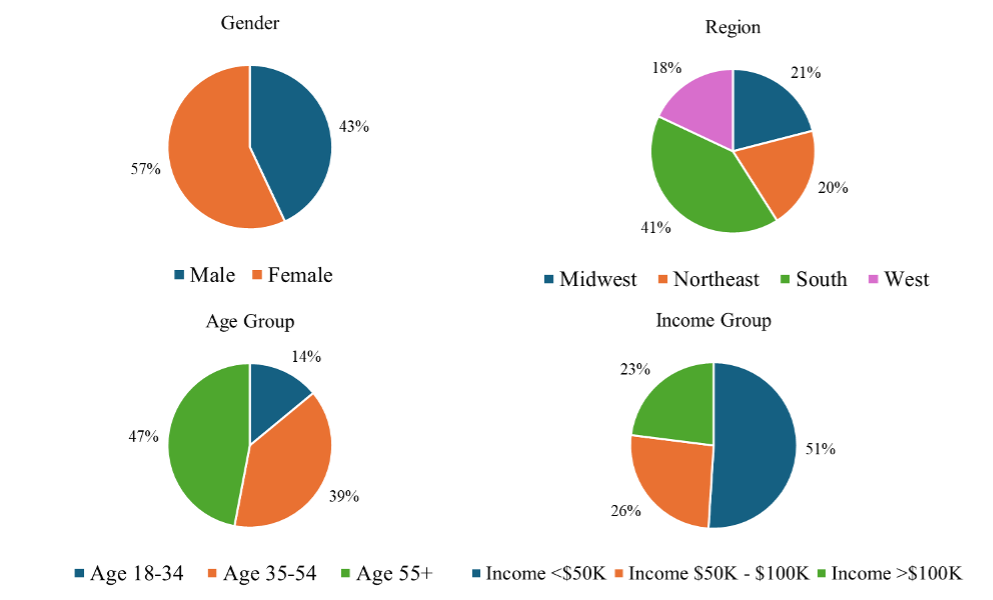
Catfish holds a special place in U.S. food culture, especially in the South, where it’s a beloved staple of regional cuisine. The South is also a major producer of farm-raised catfish, with most (96%) production concentrated in Mississippi (60%), Alabama (27%), Texas (5%), and Arkansas (5%) (USDA NASS, 2021). Outside the South, however, catfish is less popular, and its availability is more limited (House et al., 2003; Muhammad & Jones, 2009). This article presents findings from a recent survey of 5,760 primary household grocery shoppers from across the U.S. experienced in buying and preparing fish. We focus on this specific group of shoppers because 63% of seafood by weight is consumed at home (Love et al., 2020). Home-cooked seafood is likely to be bought and prepared by shoppers who have experience purchasing and preparing it. Thus, understanding these shoppers’ experiences and opinions on catfish is critical for the industry as it seeks to expand the market. We aim to address key questions for catfish farmers and industry stakeholders to refine their marketing strategies: Which consumer segments have never purchased catfish to cook at home? Furthermore, how many of these non-buyers would be willing to buy and try catfish if it were available at their local stores? By understanding where potential resistance exists across regions and sociodemographic groups, the industry can better design strategies to encourage first-time trials in buying and preparing catfish at home. With the right marketing approach, today’s nonbuyers may become tomorrow’s regular catfish home chefs.
Figure 1: Distribution of Respondents by Demographic Characteristics (n=5,760)
From our survey, 24% respondents indicated they never purchased catfish to prepare at home. Figure 2 highlights several notable patterns in the share of respondents who have never purchased catfish to cook at home. Note that these results specifically reflect grocery shopping and home-cooking habits. Women (30%) are nearly twice as likely as men (16%) to report never buying catfish to prepare at home, and this gender gap is statistically significant. This significant gap may suggest that it’s not just a matter of whether one likes catfish. Instead, it is possible that current retail packaging or specific product attributes simply aren’t hitting the mark for many female shoppers. Differences across age groups are also significant and even more pronounced: more than one-third (37%) of respondents aged 55 and older have never purchased catfish to cook at home, compared with only about 10-14% among younger groups. This is consistent with and partially supported by a Global Seafood Alliance report indicating that younger generations are more likely to cook seafood at home, and to do so more frequently, compared to older generations (Craze & Crocker, 2024). As younger consumers cook more seafood at home, they should have more opportunities to try cooking different types of fish, including catfish. Significant disparities emerged across income levels as well. Only 13% of households earning $100k+ have never bought catfish, whereas more than a quarter of those in lower income brackets report no experience purchasing it for home preparation. Catfish (about $6 – $10 for a pound of fillets) is an affordable alternative to premium protein options like steak or salmon, but it is still more expensive than budget-friendly proteins like tilapia and chicken. As expected, geographic location significantly influences purchasing history. The South has the highest market penetration, with a never-purchased rate of only 21%, which is statistically lower than the Midwest (26%) and the Northeast (28%). This disparity likely reflects the industry’s distribution, where catfish is mainly produced, has higher local availability, and holds deep-rooted cultural significance in the South.
Figure 2: Percentage of Respondents Who Never Purchased Catfish to Cook at Home in Each Sociodemographic Group (n=5,760)
Source: Survey data collected and compiled by authors
Recognizing that limited availability may be why some respondents have never purchased catfish to cook at home, we asked a follow-up question to respondents who said they have never purchased catfish: Would you bewilling to buy and try catfish if it were available in your local stores? Of these 1,375 respondents, 36% said yes they would be willing to buy and try catfish if it were available at their local stores. This suggests that a proportion of non-buyers are not inherently opposed to the product but may rather be constrained by product accessibility. This conclusion is supported by House et al. (2003), who found that the lack of availability is one of the main reasons why non-consumers do not consume catfish.
Taken together, these findings highlight a strong foundation for the industry and point toward exciting avenues for expansion. First, the data underscores a more solid and larger consumer base in the South, compared to other regions. This home-field advantage serves as a powerful model for success that can be leveraged in other markets. The greater number of non-buyers in the Northeast and Midwest should be viewed as an opportunity. As supply chains continue to evolve, these regions represent emerging market opportunities where increased visibility can turn unfamiliarity into new demand. Furthermore, as younger generations prioritize convenience when buying seafood (Craze & Crocker, 2024) and catfish consumers are more likely to eat it in a restaurant than cook at home (House et al., 2003), introducing quick-prep packaging and simplifying the home-preparation experience can allow the industry to empower more households to make catfish a staple in their home-cooked meal rotations. By focusing on these high-potential segments and bridging the geographic gap, the industry is well-positioned to convert curious non-buyers into lifelong customers, ultimately driving long-term growth across the national market.
House, L., Hanson, T., Sureshwaran, S., & Selassie, H. (2003). Opinions of US consumers about farm-raised catfish: Results of a 2000-2001 survey. Mississippi Agricultural & Forestry Experiment Station Bulletin, 1134.https://www.mafes.msstate.edu/publications/bulletins/b1134.pdf
Love, D. C., Asche, F., Conrad, Z., Young, R., Harding, J., Nussbaumer, E. M., Thorne-Lyman, A. L., & Neff, R. (2020). Food sources and expenditures for seafood in the United States. Nutrients, 12(6), 1810.
Muhammad, A., & Jones, K. G. (2009). An assessment of dynamic behavior in the US catfish market: An application of the generalized dynamic Rotterdam model. Journal of Agricultural and Applied Economics, 41(3), 745-759.
While pressure for an enhanced crop producer safety net was reduced when Congress passed the One Big Beautiful Bill Act (OBBBA) last summer, there still remains work to be done to pass a new farm bill by September 30th of this year when the current extension of the 2018 Farm Bill expires. Farm Bill 2.0—or the Skinny Farm Bill as some call it—is still important to producers and rural America for what it does beyond commodity programs. Farm Bills are far more than the producer safety net programs contained in Title I. For example, the Farm, Food, and National Security Act of 2026 (Farm Bill 2.0) passed out of committee in the House of Representatives on March 5th and contains 12 titles (commodity, conservation, trade, nutrition, credit, rural development, research, extension, and related matters, forestry, energy, horticulture, marketing and regulatory reform, crop insurance, and miscellaneous) and is 802 pages. For comparison purposes, the 2018 Farm Bill also contained 12 titles but was only 529 pages.
The House Committee-passed bill included 181 marker bills that were introduced by Members of Congress. The bill also addresses California’s Prop 12, clarifying that “producers of covered livestock have a Federal right to raise and market their covered livestock in interstate commerce and therefore no State or subdivision thereof may enact or enforce, directly or indirectly, a condition or standard on the production of covered livestock other than for covered livestock physically raised in such State or subdivision.” Among a whole host of other changes, the bill also reauthorizes the Conservation Reserve Program at 27 million acres and increases farm credit borrowing limits—both of which are needed during this downturn in the farm economy.
So, what is next? House Agriculture Committee Chairman GT Thompson is looking to leadership in the House of Representatives to find time on the House calendar to begin considering the bill in hopes of passing it out of the House. Senate Agriculture Committee leadership would need to mark-up their version of Farm Bill 2.0 and then pass it out of committee and the Senate before the two bills could be conferenced to work through any differences. This is the normal process for getting bills passed into law. One thing that surely makes this effort different is the November mid-term election which, as history has shown during the mid-term election year, reduces the amount of legislation that is considered and passed in Congress—generally for political reasons. With that said, the most recent farm bill—the 2018 Farm Bill—was signed into law in December 2018, immediately following the mid-term election during President Trump’s first term.
The sale of E15, gasoline with an ethanol content of 15%, is currently restricted during the summer months (June 1-September 15) under rules of the Environmental Protection Agency (EPA). However, emergency waivers allowing for year-round sales of E15 have been enacted every year since 2019, under both the Trump and Biden administrations. A nationwide waiver for 2026 summer month E15 sales has not yet been finalized.
The EPA revised its rules in 2024 allowing for a permanent waiver for E15 to be sold in summer months in Illinois, Iowa, Minnesota, Missouri, Nebraska, Ohio, South Dakota, and Wisconsin, beginning in 2025. Some members of Congress have proposed making year-round sales of E15 permanent nationwide. That work is now in the hands of a Congressional Task Force assigned to study and draft legislation. The February 25 deadline for that legislation to be introduced has passed with no action yet reported.
‘Ethanol and by-products’ is the second highest domestic use category in the supply and demand balance sheet for corn. In the 2005/06 marketing year, USDA reported corn for fuel at 1.6 billion bushels, 14% of that year’s 11 billion bushel corn crop. The current estimate of corn for fuel in 2025/26 is 5.6 billion bushels, about 33% of this year’s production of 17 billion bushels.
But the landscape of corn for fuel is changing. According to projections from the Energy Information Administration (EIA), we have likely seen peak gasoline consumption in the U.S. With increased new car fuel efficiency and a growing number of vehicles on the road that do not use any gasoline at all, the EIA projects gasoline consumption to fall from its peak of 143 billion gallons in 2018, to the current estimate of 135 billion gallons for 2026, down to 111 billion gallons by 2035 (Figure 1).
Figure 1. U.S. Gasoline and Ethanol Consumption, billion gallons
The blending mandate for ethanol is 10%, however, the actual share of ethanol consumption in the U.S. as a share of gasoline consumption is now 10.4%. The EIA report of ethanol use includes net exports. If the ethanol blending rate held steady at 10.4%, the projected decrease in gasoline consumption would mean a decline in ethanol fuel consumption from a peak of 14.2 billion gallons in 2025 to 11.5 billion gallons in 2035 (Figure 2). A decline of that magnitude of ethanol fuel would reduce corn use by about 1 billion bushels of corn in 2035 from current levels (at the current conversion rate of 2.93 gallons of ethanol per bushel of corn).
However, in its February 2026 release of “USDA Agricultural Projections to 2035”, the USDA held corn ethanol use steady at 5.6 billion bushels throughout the projected time frame. The report notes the expected decline in U.S. gasoline consumption over the next decade but that increasing ethanol exports will hold corn for fuel use flat. Since 2016, ethanol exports have increased from 1.2 billion gallons (8% of total ethanol production) to 2.2 billion gallons in 2025 (13% of total ethanol production). It is expected that ethanol exports will continue to rise with the increasing blend mandates throughout the world.
What impact could the widespread adoption of E15 have on U.S. ethanol use?
Based on USDA’s long-term projections, we expect corn for fuel and ethanol use (domestic and exports) to hold steady at current levels. Based on EIA’s projections of gasoline use, if the blending rate were to increase by 1% per year from current levels to 15% in five years and hold steady after that, ethanol consumption would increase from around 14 billion gallons to 19 billion gallons in 2030. Thereafter, if the decline in gasoline consumption continued, ethanol use would decline back down to about 18 billion gallons.
To produce the extra ethanol for fuel would require 1 billion bushels over USDA’s current 5.6-billion-bushel baseline by 2028 and over 2 billion bushels in 2030. That increase falls back to 1.7 billion bushels over the current levels in 2035.
Figure 2. Ethanol Consumption and Corn for Fuel, E10 and E15
Widespread and year-round E15 has the potential to significantly impact ethanol use in the U.S., increasing the share of ethanol in overall motor gasoline consumption. This requires both industry providing supply and consumers providing demand. Legislation allowing year-round sales of E15 would give the fuel industry certainty for investment in production and infrastructure to provide the product. Year-round availability provides consumers with a product that they are more familiar with, has wider availability, and is generally a lower cost (Decision Innovation Solutions, 2026).
The benefit to farmers is the expansion of a key use category for corn. The U.S. corn farmer has shown the capacity to increase production in the face of rising demand. Building this demand base on stability and consistency in the fuel sector provides a foundation for long-term price support and some certainty during a time of uncertain markets.