According to the latest forecast from USDA ERS, net farm income in 2026 is expected to decline modestly, even after factoring in substantial government payments. If realized, this would represent several consecutive years of compressed profitability, particularly for row crop producers. In this context, what do current indicators reveal about emerging farm financial stress?
A recent survey conducted by Mississippi State University Extension offers additional insight into agricultural credit conditions in Mississippi and Alabama. Because these states are not included in the agricultural credit surveys published by the Federal Reserve Banks of Dallas or Kansas City, this regional data provides a valuable perspective. The survey gathered responses from commercial banks, Farm Credit System institutions, agricultural consulting firms, and insurance companies operating across the region.
Source: 2025 Mississippi State University Agricultural Credit Survey
Farm loan repayment performance worsened in 2025, with none of the respondents reporting that the loan repayment rates had improved when compared to the previous year. Farm loan renewals generally showed signs of stability to modest softening relative to 2024. Compared to the most recent agricultural surveys conducted by the Federal Reserve Banks of Dallas and Kansas City, there were more respondents who answered that the loan repayment rates were worse than the year before.
Source: 2025 Mississippi State University Agricultural Credit Survey
Liquidity and solvency measures provide indicators of short- and long-term financial stress. Several respondents reported that liquidity and solvency positions for crop producers weakened in 2025 relative to the previous year, whereas livestock producers were more often characterized as stable or slightly improved. These differences reflect the commodity-specific price trends observed over the past year.
Source: 2025 Mississippi State University Agricultural Credit Survey
Despite lower crop receipts, farmland values remain resilient. Most respondents reported that irrigated and non-irrigated cropland values either increased or held steady in 2025 relative to 2024, and there was no reporting of decreased cropland value. Expectations for the next six months are largely neutral to slightly positive despite the expected low price outlook in 2026. Pasture values followed a similar pattern.
Overall, the newly conducted survey shows that the agricultural credit environment reflects tighter margins and growing financial stress, but not widespread financial disaster. Continued monitoring of repayment trends, working capital positions, and interest rate movements will be essential as producers and lenders navigate the production cycle.
As pressure for change in use on historically agricultural lands continues unabated, state and local governments and agricultural stakeholders wrestle with the extent prime soils classification may legally factor into development plans and permitting decisions to discourage changes in surface use. Prime farmland soils are generally defined by USDA, under authority of the Farmland Protection Policy Act (FPPA)via7 CFR § 657.5, as possessing the optimal physical and chemical characteristics for high-yield food and fiber production. Prime soils have renewed focus as a policy matter at the intersection of utility-scale solar development and agricultural production, with efforts to limit their non-farm use and mitigate their impact.
As a matter of federal policy, the FPPA requires federal agencies (such as the FAA or HUD) to minimize the “unnecessary and irreversible conversion” of prime soils to non-agricultural uses. Designation manifests through the Land Evaluation and Site Assessment (LESA) system, which scores potential sites. Projects exceeding a specific threshold are flagged, theoretically forcing agencies to consider alternative locations that spare high-quality soils.
State governments have used prime soils (sometimes designated as soils of statewide importance) to positively score conservation easements applications, though prime soils as a factor in restricting development patterns (e.g. housing densities) and permitting decisions may draw more challenges. In Virginia, prime soils designation has found policy footing in the solar development realm with a new statutory and regulatory mitigation requirement for disturbed prime soils in solar development, requiring a 1:1 ratio of land to be protected under conservation easement (or a fee in lieu to fund conservation easement protection) for each acre developed, as a permitting requirement. It is yet to be seen what legal challenges lie ahead for that mitigation policy. Beyond the solar development realm, one may continue to expect local governments in some states to factor in prime soils as a land attribute that guides development, and perhaps legal challenges may illustrate whether such actions amount to impermissible land use regulations under constitutional takings standards.
U.S. cotton is among the most export‑dependent agricultural commodities, with more than 80% of annual production moving into global markets rather than being used domestically (U.S. Department of Agriculture, 2026a). Although China has not always been a consistent buyer, importing less than 15% of U.S. cotton exports in some years and more than 30% in other years, it has nevertheless remained a somewhat reliable partner, accounting for nearly 30% of U.S. cotton exports in more recent years (2020–2024) (U.S. Department of Agriculture, 2026b).
Once the most important market for U.S. cotton, China has become a far less reliable partner in 2025, as recent import patterns show greater volatility and reduced engagement with the U.S. agricultural sector. In 2025, China’s purchases of U.S. cotton fell from $1.5 billion to just $0.2 billion, an 85% decline, while its import volume dropped at nearly the same rate, from 0.8 million metric tons (MMT) to 0.1 MMT. In contrast, exports to markets outside China expanded substantially over the same period. The value of U.S. cotton exports to non‑China destinations rose from $3.5 billion to $4.6 billion, a 32% increase, while quantities surged 51%, from 1.7 MMT to 2.6 MMT (Table 1) (U.S. Department of Agriculture, 2026b).
Why did China sharply reduce its imports of U.S. cotton? While the trade war and subsequent political tensions certainly accelerated the decline, the underlying shift runs deeper than tariffs. China’s overall import strategy has fundamentally changed as its domestic cotton sector has undergone major structural adjustments since 2010. Over the past decade, China has increased production, drawn down its massive state-held stockpiles, and reduced its dependence on foreign fiber. Since 2021 alone, domestic output has risen by more than 30% (U.S. Department of Agriculture, 2025a). As a result, China is increasingly able to meet the needs of its textile and apparel industry with domestic cotton rather than imports. Taken together, these developments suggest that China’s reduced reliance on U.S. cotton is not simply a temporary response to trade tensions but part of a longer-term realignment.
Table 2 makes clear that the steep decline in U.S. cotton exports to China was not simply the result of tariffs or bilateral tensions, but part of a much broader contraction in China’s overall import demand. China’s total cotton import value fell from $5.3 billion in 2024 to $1.9 billion in 2025, while import volumes dropped from 2.6 million to 1.1 million metric tons. Every major supplier experienced significant losses: Brazil’s shipments fell by more than 50%, India’s collapsed by over 90%, and Australia also recorded substantial reductions.
The across‑the‑board declines underscore a structural shift in China’s sourcing strategy rather than a U.S.-specific outcome.
Cotton prices remain low and moving sideways. Nearby futures and U.S. spot stayed weak into early 2026 (about $0.63/lb). New-crop Dec’26 futures still carry about a $0.06/lb premium over nearby futures, signaling the market expects some tightening later in the year. The carry in the futures market is not a reason to plant more cotton. It reflects the market pricing in an expected supply contraction, not a demand-led recovery.
The global balance sheet explains why prices are stuck. For 2025/26, USDA projects 119.9 million bales of production and 118.7 million bales of mill use, raising ending stocks to 75.1 million bales. The U.S. picture is equally heavy: ending stocks reach 4.4 million bales, pushing the domestic stocks-to-use ratio to 32%, matching the highest level since the 2019/20 pandemic-era peak of 43%, with the season-average upland price lowered to $0.60/lb (USDA, 2026). High stocks slow any recovery unless demand surprises higher, which has not happened. This shifts attention to where supply cuts may emerge.
Exporter production signals are mixed, but the direction is clear (Figure 1). The United States projects 13.9 million bales in 2025/26, down 3.5%, with flat harvested area (7.80 million acres) and a yield-driven decline. Australia shows a sharper pullback: production drops 19.6% to 4.5 million bales, driven by a 21.7% area cut as the Murray–Darling Basin enters a second dry season. Brazil is the swing case where the USDA projects 18.75 million bales (+10.3%), while CONAB is lower at 17.47 million bales with area down 3.1% and a lower yield. Those differences matter because Brazil can set the marginal export tone.
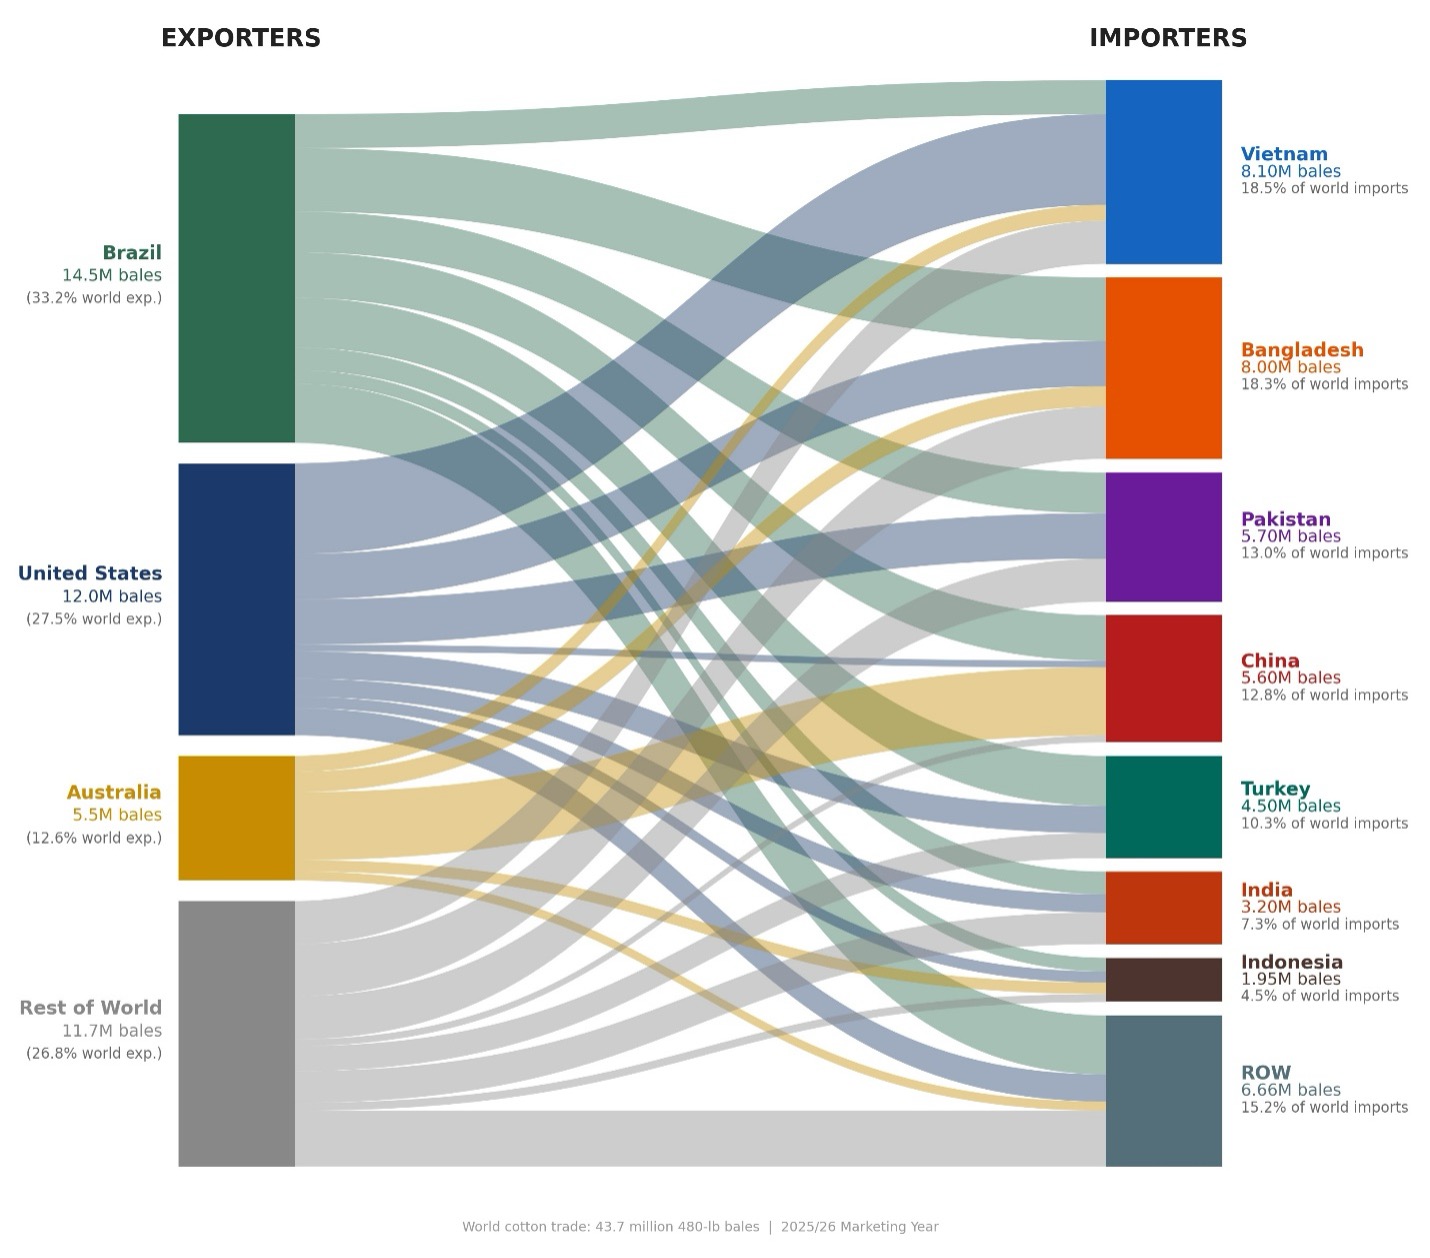
Trade is where price pressure shows up first. USDA puts 2025/26 world trade up slightly at 43.7 million bales. Within that total, origins are shifting (Figure 2). The U.S. is gaining ground in Vietnam, while trade developments increase sales prospects to Bangladesh and India. But China appears to lean more toward Australia; February updates cut U.S. exports by 200,000 bales while raising Australia’s by 200,000 bales (USDA, 2026). When buyers switch origins, basis, and export bids can move fast.
Acreage does not look like a bullish lever. The National Cotton Council projects 9.0 million cotton acres for 2026, down 3.2% from 2025 (NCC, 2026). Relative prices still favor competing crops, with the Dec’26 corn-to-cotton ratio near 6.7 points,[1] indicating flat-to-lower cotton acres, not expansion. Weather is the swing factor. NOAA expects La Niña to fade toward ENSO-neutral in Feb–Apr 2026 (60% chance), but parts of Texas entered late winter with drying soils and expanding drought, which can raise abandonment risk (NOAA CPC, 2026; USDM/NIDIS, 2026). If spring rains miss, supply could tighten into the new crop, consistent with the Dec’26 premium in futures.
For U.S. growers, the playbook stays defensive, but flexible. Growers may wish to consider using rallies to price a portion of expected production and protect downside risk. Brazil’s acreage follow-through should be monitored, as well as China’s import pace, because both variables can change export competition quickly. Marketing should be tied to your cost structure and moisture outlook, since yield risk can dominate net revenue.
Figure 1. Area vs. Yield: What’s Driving Exporter Production Shifts (2024/25 vs. 2025/26)
Sources: USDA WASDE (February 2026), CONAB (February 2026). ABARES (December 2026). All data have been converted to acres, lbs/acre, and bales. Rectangles compare cotton production across the United States, Brazil, and Australia. Rectangle height is harvested area and width is yield, so rectangle area is proportional to production; dashed outlines show 2024/25 and solid rectangles show 2025/26.
Figure 2. Cotton Trade: Major Exporters and Key Buyer Markets (2025/26)
Source: USDA FAS (2026). Each ribbon represents a cotton export flow from an origin country (left) to a destination country (right). Ribbon width is proportional to volume in million 480-lb bales.
[1] The December corn-to-cotton price ratio is calculated as the December Corn futures price (CBOT ZCZ26, $/bu) divided by the December Cotton No. 2 futures price (ICE CTZ26, ¢/lb). Because the contracts use different units, this ratio is a rule-of-thumb indicator of relative new-crop price incentives rather than a direct profitability comparison. It is best interpreted alongside expected yields, local basis, and per-acre variable costs when assessing acreage shifts.
References
Australian Bureau of Agricultural and Resource Economics and Sciences (ABARES). (2025, December). Agricultural commodities: December quarter 2025 (Report No. 216). https://www.agriculture.gov.au/abares/research-topics/agricultural-outlook/australian-crop-report
Companhia Nacional de Abastecimento (CONAB). (2026, February). Acompanhamento da safra brasileira de grãos: 5º levantamento, safra 2025/26. https://www.conab.gov.br/info-agro/safras/graos/boletim-da-safra-de-graos
National Cotton Council of America (NCC). (2026, February). 45th annual early season planting intentions survey. https://www.cotton.org/econ/cropinfo/cropdata/planting-intentions.cfm
National Integrated Drought Information System (NIDIS). (2026, January 22). Drought status update: Southern Plains. NOAA. https://www.drought.gov/drought-status-updates/drought-status-update-southern-plains-2026-01-22
NOAA Climate Prediction Center (NOAA CPC). (2026, February 12). ENSO diagnostic discussion. National Weather Service/NCEP. https://www.cpc.ncep.noaa.gov/products/analysis_monitoring/enso_advisory/ensodisc.shtml
U.S. Department of Agriculture, Agricultural Marketing Service (USDA AMS). (2026, February). Cotton market news — daily settlement prices. https://www.ams.usda.gov/market-news/cotton
U.S. Department of Agriculture, Foreign Agricultural Service (USDA FAS). (2026, February). Cotton: World markets and trade. https://fas.usda.gov/data/cotton-world-markets-and-trade
U.S. Department of Agriculture, World Agricultural Outlook Board (USDA WAOB). (2026, February 10). World agricultural supply and demand estimates (WASDE-668). https://www.usda.gov/oce/commodity/wasde/wasde0226.pdf
Generally, the cattle market follows a clear pattern. Tighter supplies lead to higher prices. Currently, the U.S. cattle herd is at its lowest level in decades. This scarcity supports strong market prices.
However, the recent emergence of the New World Screwworm (NWS) has created significant uncertainty. Since late 2025, concerns about the pest spreading from the south have introduced a risk premium into the market. As a result, the market faces two opposing forces. The first is the reality of tight physical supplies. The second is the anxiety regarding live cattle trade restrictions and dealing with an occurrence.
Headline Risk in Action
That tension reached a breaking point on Friday, January 16, 2026, which offered a clear case study of how headline risk can temporarily disrupt market fundamentals.
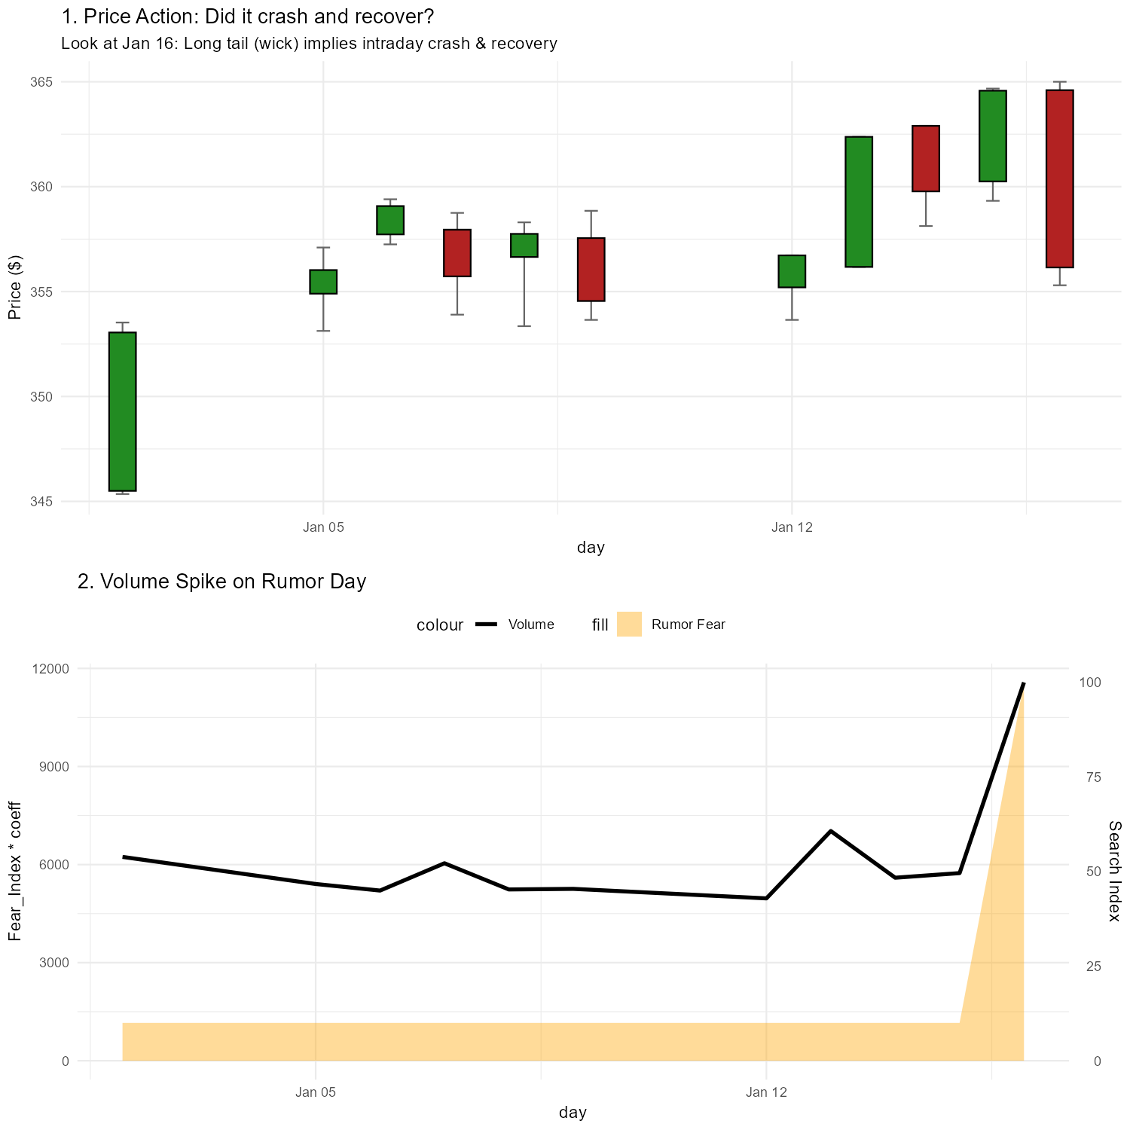
Unverified rumors circulated that NWS had been detected in Texas or New Mexico. The reaction in the futures market was immediate. Feeder cattle futures opened near $364.60. As the rumors spread, algorithmic trading and panic selling accelerated. This drove prices down to a low of $355.30. In just a few hours, the market lost nearly $10 per hundredweight. This move approached “limit down” territory.
Trading volume surged alongside the price drop, confirming that there was a broad “rush for the exits.” However, the market collected itself later in the day and closed at $356.15, recovering part of the intraday loss.
To support the cause of this crash, Figure 1 presents an analysis of intraday market data alongside online search trends. This comparison maps the timing of the price drop against Google Search intensity for terms related to the outbreak. The data reveals a direct link. As search volume for “NWS rumors” spiked (shown in the orange area of Figure 1), trading volume exploded, and prices collapsed. This data supports the hypothesis that the sell-off was driven by information flow and psychology, not by a sudden change in the physical cattle trade.
Navigating the Noise
For producers, January 16 highlights a critical difference between futures and cash markets. Futures respond instantly to headlines. An occurrence would likely cause short-term futures market volatility and lower prices. Cash markets respond to physical reality. Rising production costs due to a sustained outbreak would lead to tighter supplies in the longer term but, little immediate fundamental market changes. When a frightening story hits the news, the futures board turns red immediately. It prices in worst-case scenarios. At the same time, buyers at the sale barn still need cattle to fill orders. Therefore, cash prices often remain steadier.
This disconnect creates a dangerous trap. Selling futures or locking in prices during the peak of a rumor-driven crash is equivalent to accepting a panic discount. The January 16 episode suggests that patience is often the best risk management tool in these moments. Allowing liquidity to stabilize after a headline shock can preserve meaningful value.
In a market shaped by both supply tightness and disease fear, traditional fixed-price hedging can be double-edged. It protects against sharp drops but limits participation in rallies driven by scarcity. More flexible tools such as Livestock Risk Protection (LRP) insurance or put options may offer a better balance in 2026. These strategies provide protection against a true outbreak. They also preserve the ability to benefit when rumors fade and fundamentals reassert themselves.
Conclusion
The New World Screwworm is a serious biological threat that warrants vigilance. For producers, however, the more immediate challenge is market volatility. The fundamentals of the cattle cycle have not changed. Supply remains tight.
The winners in 2026 are unlikely to be those who correctly predict the next headline. They will be those who build marketing plans resilient enough to withstand the sudden swings of a nervous market.
Figure 1. Intraday market shock on Jan 16, 2026. The red bar in the top chart shows the massive price drop (approx. $9.30) from the market open to the daily low. The bottom chart shows Google search interest for rumors (orange area) and trading volume (green line) spiking simultaneously. This confirms the crash was driven by news headlines rather than market fundamentals.