Blog

  • Rumors, Risks, and the Screwworm: A Lesson from January 16

    Rumors, Risks, and the Screwworm: A Lesson from January 16

    Generally, the cattle market follows a clear pattern. Tighter supplies lead to higher prices. Currently, the U.S. cattle herd is at its lowest level in decades. This scarcity supports strong market prices.

    However, the recent emergence of the New World Screwworm (NWS) has created significant uncertainty. Since late 2025, concerns about the pest spreading from the south have introduced a risk premium into the market. As a result, the market faces two opposing forces. The first is the reality of tight physical supplies. The second is the anxiety regarding live cattle trade restrictions and dealing with an occurrence.

    Headline Risk in Action

    That tension reached a breaking point on Friday, January 16, 2026, which offered a clear case study of how headline risk can temporarily disrupt market fundamentals.

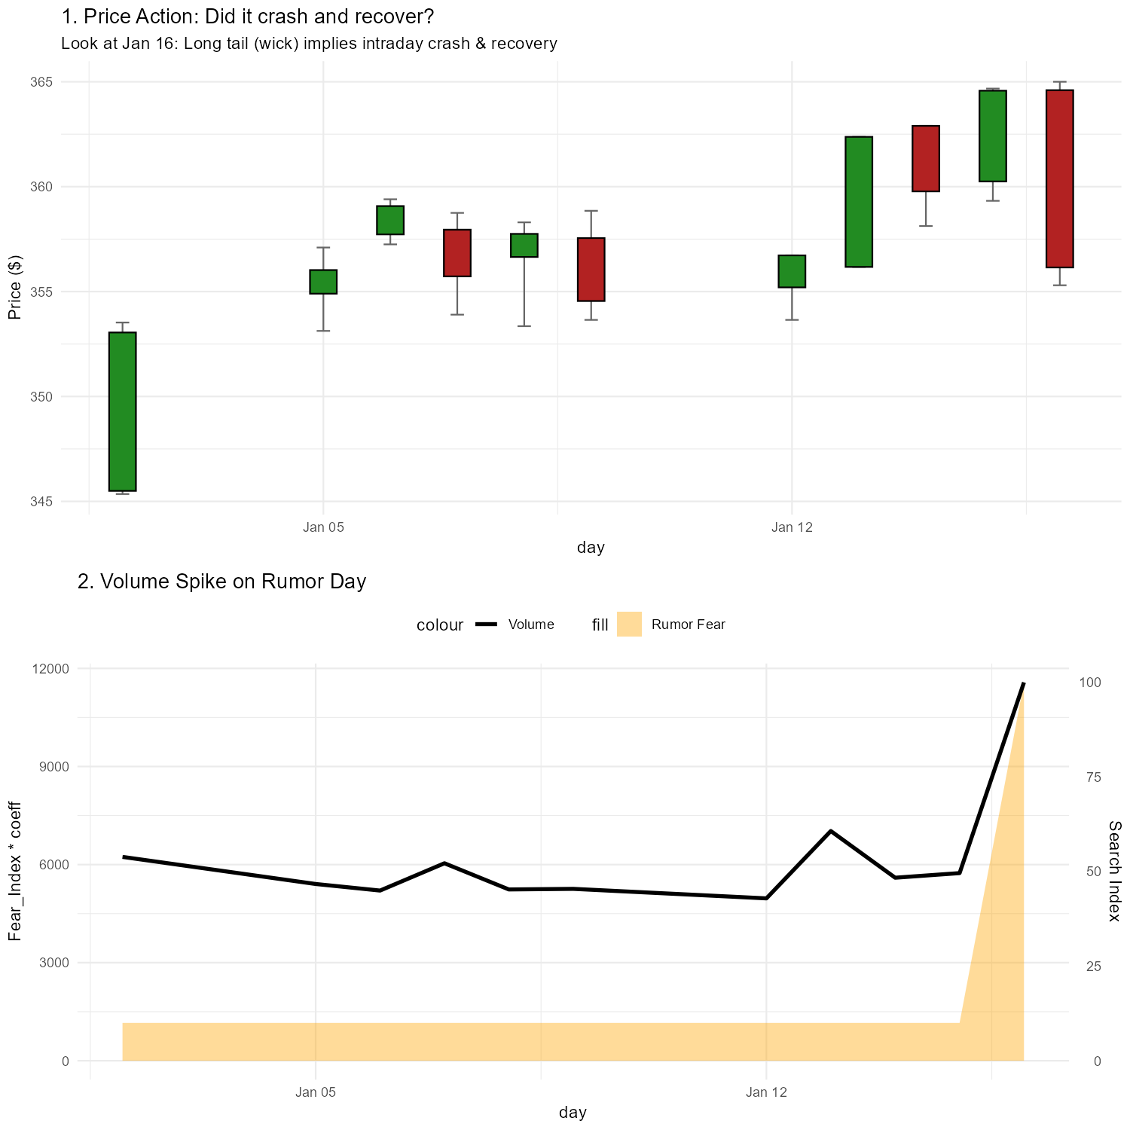
    Unverified rumors circulated that NWS had been detected in Texas or New Mexico. The reaction in the futures market was immediate. Feeder cattle futures opened near $364.60. As the rumors spread, algorithmic trading and panic selling accelerated. This drove prices down to a low of $355.30. In just a few hours, the market lost nearly $10 per hundredweight. This move approached “limit down” territory.

    Trading volume surged alongside the price drop, confirming that there was a broad “rush for the exits.” However, the market collected itself later in the day and closed at $356.15, recovering part of the intraday loss.

    To support the cause of this crash, Figure 1 presents an analysis of intraday market data alongside online search trends. This comparison maps the timing of the price drop against Google Search intensity for terms related to the outbreak. The data reveals a direct link. As search volume for “NWS rumors” spiked (shown in the orange area of Figure 1), trading volume exploded, and prices collapsed. This data supports the hypothesis that the sell-off was driven by information flow and psychology, not by a sudden change in the physical cattle trade.

    Navigating the Noise

    For producers, January 16 highlights a critical difference between futures and cash markets. Futures respond instantly to headlines. An occurrence would likely cause short-term futures market volatility and lower prices.  Cash markets respond to physical reality.  Rising production costs due to a sustained outbreak would lead to tighter supplies in the longer term but, little immediate fundamental market changes. When a frightening story hits the news, the futures board turns red immediately. It prices in worst-case scenarios. At the same time, buyers at the sale barn still need cattle to fill orders. Therefore, cash prices often remain steadier.

    This disconnect creates a dangerous trap. Selling futures or locking in prices during the peak of a rumor-driven crash is equivalent to accepting a panic discount. The January 16 episode suggests that patience is often the best risk management tool in these moments. Allowing liquidity to stabilize after a headline shock can preserve meaningful value.

    In a market shaped by both supply tightness and disease fear, traditional fixed-price hedging can be double-edged. It protects against sharp drops but limits participation in rallies driven by scarcity. More flexible tools such as Livestock Risk Protection (LRP) insurance or put options may offer a better balance in 2026. These strategies provide protection against a true outbreak. They also preserve the ability to benefit when rumors fade and fundamentals reassert themselves.

    Conclusion

    The New World Screwworm is a serious biological threat that warrants vigilance. For producers, however, the more immediate challenge is market volatility. The fundamentals of the cattle cycle have not changed. Supply remains tight.

    The winners in 2026 are unlikely to be those who correctly predict the next headline. They will be those who build marketing plans resilient enough to withstand the sudden swings of a nervous market.

    Figure 1. Intraday market shock on Jan 16, 2026. The red bar in the top chart shows the massive price drop (approx. $9.30) from the market open to the daily low. The bottom chart shows Google search interest for rumors (orange area) and trading volume (green line) spiking simultaneously. This confirms the crash was driven by news headlines rather than market fundamentals.

    Park, Eunchun. “Rumors, Risks, and the Screwworm: A Lesson from January 16.” Southern Ag Today 6(9.2). February 24, 2026. Permalink
  • Three Strategies to Improve Profitability for Small Cow-calf Operations

    Three Strategies to Improve Profitability for Small Cow-calf Operations

    Running a small cow-calf operation can be rewarding, but it is not without challenges. Larger farms spread their costs over more cows, making it harder for smaller herds to compete. There also tend to be scale efficiencies related to labor, input purchases, and other expenses that make larger operations more economically efficient. But smaller producers can be profitable, and this article focuses on three strategies small operations should consider to improve their profitability.

    Keep Overhead Costs in Check

    Cow-calf operations are capital intensive by nature, so I chose to use the words “in check” rather than something more specific. But the reality is that an operation running 30-40 cows can’t have the same overhead structure as one running several hundred. This sounds obvious, but I often see new cow-calf operations that are badly overcapitalized from the start. Smaller operations should focus on being lean with respect to equipment, facilities, and other fixed costs. In a lot of cases, this means limiting capital investment and ensuring that the scale of equipment is proportional to the scale of the operation. However, performing custom work with owned equipment is another way to spread that capital investment over more hours of use and add a second income stream. Regardless of what approach is taken, small cow-calf operations must be aware that disproportionately large overhead cost structures can be a major drain on profitability.

    Outsource Strategically to Save Time and Money

    A small cow-calf operation does not have to do everything themselves and may be best served by outsourcing some farm operations. The first area that comes to mind is hay production. It may be more economical for a small cow-calf operation to purchase hay, rather than own hay equipment and devote land and time resources to producing it themselves. In some areas, hay is not easy to source and may require significant effort. But by spending time developing relationships with hay producers and planning for winter feeding needs well in advance, the operation may be able to avoid significant hay production expenses.

    Outsourcing other farm operations may also be worth consideration. For example, it may be easier to hire someone to transport cattle to market, rather than owning and maintaining hauling equipment that isn’t used very often. Heifer development is another area that can be a bit more challenging for small operations. It may make sense for a small operation to purchase a few bred heifers each year and focus on terminal production, rather than developing a small number of heifers on their own.

    Outsourcing is typically justified on the basis of limiting investment (i.e., avoiding overcapitalization) or limiting variable expenses. But it also frees up another very valuable resource – time. Most small cow-calf operators have off-farm employment or other significant off-farm commitments. By outsourcing some farm operations, additional time becomes available and can be devoted to the elements of the operation the farmer chooses to focus on.

    Explore Value-added Marketing Opportunities

    While the first two considerations were largely focused on cost control, this one is focused on the revenue side of the profit equation. Since production costs tend to be higher for smaller operations, it is even more imperative that they look for ways to add value to the cattle they sell. Since they are likely to sell cattle in smaller groups, they have an even greater incentive to consider co-mingled / value-added sales where they can potentially get price premiums associated with larger lot sizes and health programs. They also have more incentive to consider direct-to-consumer markets such as freezer beef, farmers’ markets, etc. While everyone will be comfortable adding value in their own way, the point is that smaller operations need to focus on ways to increase profit per head, since they have a smaller number of head from which to profit.

    Small cow-calf operations should recognize that they are unlikely to successfully compete with large operations on scale and cost efficiency. For that reason, they need to approach their operations differently and utilize the unique advantages that come with being lean and flexible. By carefully managing their overhead cost structures and outsourcing operations that can be done more efficiently by other operations, they have the potential to see significant cost benefits. And by exploring value-added marketing opportunities, they may be able to capture revenue benefits as well.

  • Making Ends Meet When Purchasing Power Falls

    Making Ends Meet When Purchasing Power Falls

    U.S. inflation has eased from its 2022 highs, with the Consumer Price Index (CPI) stabilizing around 2.4% at the end of 2025. While the pace of price increases has slowed, elevated costs for services, housing, and food persist, maintaining pressure on consumers (see Figure 1). Inflation is expected to remain below 3% into 2026. In a Southern Ag Today article, Kim and Yoon (2025) explained why the perception of grocery inflation remains high. Despite inflation slowing, prices rarely return to previous levels; rather, they increase at a more sustainable, yet still elevated, pace. The key to offsetting increases in consumer prices is income growth. When income does not rise in line with prices, consumers lose purchasing power. To address this and ensure that households are not caught in a financial trap, several practical strategies can be considered. I have seen the suggestions below applied in real life while growing up and continue to practice them myself.

    First, it is important to track household spending each month and ensure that it does not exceed total income earned. There are simple ways to do this, such as keeping a spreadsheet of all expenses as they occur. Households can also be managed like a business to ensure that “profits” (savings) are generated. These savings can then be placed in high-interest-earning accounts. A simple 80/20 budgeting rule can be applied, where 80% of income is allocated to needs and wants (rent, food, utility bills, travel, and entertainment), with needs prioritized, and the remaining 20% allocated to savings or debt repayment, if applicable.

    If living expenses consistently exceed income or you are unable to meet your savings goal, analyze spending categories such as food and discretionary expenses. This analysis can help identify areas where habits can be adjusted to seek more affordable alternatives. For example, instead of eating out at restaurants, which may include not only the cost of the meal and tax, but also tips, service charges, and/or delivery fees, consider preparing home-cooked meals. This option is not only healthier but also potentially at least three times less expensive (Bachmann, 2024). Additionally, consider brewing coffee at home instead of purchasing a $6 cup daily; this can lead to monthly savings of over $100. Cooking at home also offers social benefits, such as strengthening bonds with household members and enhancing overall family well-being.

    Figure 1. Consumer Price Index, 12-month percentage change, selected categories

    References:

    Bachmann, Kirk. “2024 Consumer Dining Trends: How Americans are Spending on Restaurants and Takeout.” Auguste Escoffier School of Culinary Arts. September 25, 2024. Accessed: February 13, 2025. https://www.escoffier.edu/blog/world-food-drink/consumer-dining-trend-statistics/.

    Kim, Ashley Jiyoon, and Sungeun Yoon. “Why Grocery Inflation Still Feels High.” Southern Ag Today 5(6.5). February 7, 2025. https://southernagtoday.org/2025/02/07/why-grocery-inflation-still-feels-high/.


    Thomas, Chrystol. “Making Ends Meet When Purchasing Power Falls.“ Southern Ag Today 6(8.5). February 20, 2026. Permalink

  • Bringing Unassigned Base Back into Program Eligibility for Cotton Producers

    Bringing Unassigned Base Back into Program Eligibility for Cotton Producers

    Under the 2025 One Big Beautiful Bill (section 10302), producers will have a voluntary opportunity to add new base to their operation, with up to 30 million new base acres allowed nationwide. The return of unassigned base into producers’ program eligible crop base is included in this total. A general question and answer guide was previously published in Southern Ag Today. Here, I focus specifically on unassigned base acres for cotton producers. 

    First, it helps to look back on how today’s unassigned base acres were created. In 2018, the Bipartisan Budget Act reinstated ‘seed cotton’ as a covered commodity eligible for participation in Agricultural Risk Coverage (ARC) or Price Loss Coverage (PLC). Cotton producers converted ‘generic base’ from the 2014 Farm Bill back to seed cotton or to other commodities. The calculation for seed cotton base resulted in a residual number of acres classified as ‘unassigned base’. Records for unassigned base were retained by the Farm Service Agency (FSA), but those acres were ineligible for ARC or PLC participation. 

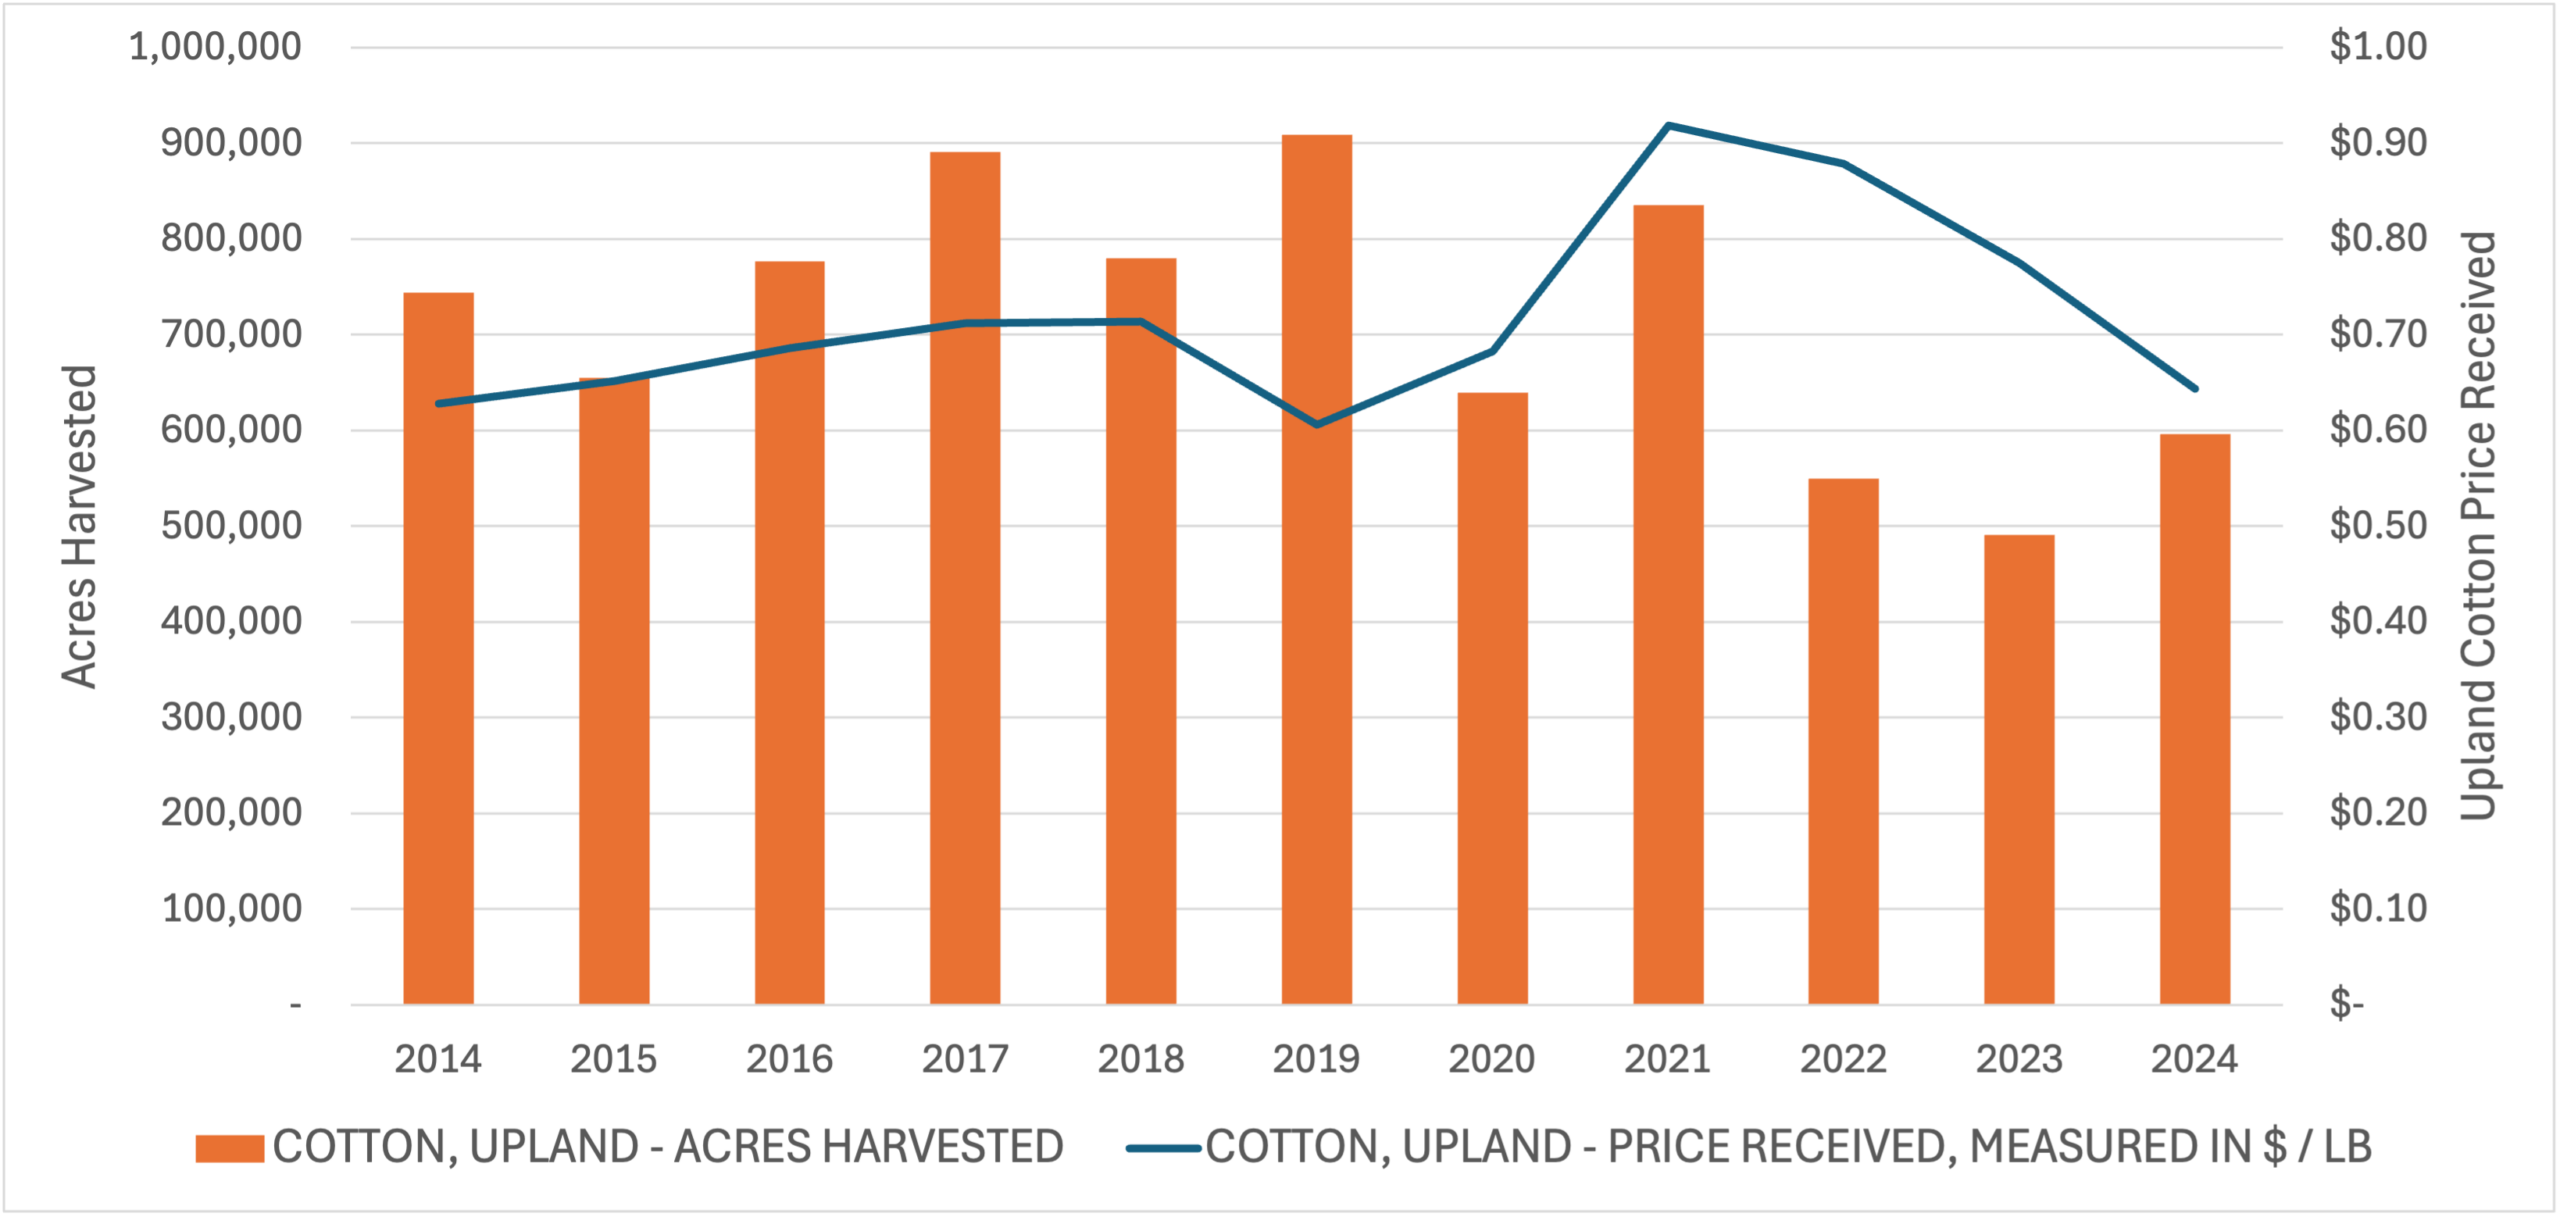
    Each year since 2019, seed cotton producers have enrolled in either ARC or PLC, with the percentage of acres enrolled in each program varying over time. ARC payments for seed cotton peaked in 2022 [1] in the Southern states (total payments $52 million, with 26% of acres enrolled in ARC-CO) followed closely by 2023, driven heavily by weather related crop losses. Acres harvested and prices are shown in the figure. PLC payments peaked in 2019 ($981 million, with 99% of acres enrolled in PLC) during a period of low prices.  

    Fast forward to today. For cotton producers across the Southern region, the chance to voluntarily restore unassigned base into safety net programs is a meaningful opportunity. In 2025, there were 2.51 million unassigned generic base acres and 12.31 million seed cotton base acres in the U.S. The likelihood of unassigned base acres returning as seed cotton base acres varies geographically. 

    The National Cotton Council 2026 Economic Outlook [2] provided some encouraging signs that global demand may expand, but price pressure is expected to remain. With the increase in the seed cotton reference price from $0.367/lb to $0.42/lb in the One Big Beautiful Bill, expanded safety net eligible acres for cotton producers with a 5-year history of production may help cover a portion of breakeven costs that remain above historical average levels.  

    Figure 1. Upland Cotton 

    Data source: USDA NASS QuickStats

    [1] USDA Farm Service Agency. 2019-2026 ARC and PLC Program Data. Available online: https://www.fsa.usda.gov/resources/programs/arc-plc/program-data

    [2] Campiche, J., S. Boyd, and M. Huffman. 2026. “The Economic Outlook for U.S. Cotton 2026.” The National Cotton Council. Available online: https://www.cotton.org/econ/reports/annual-outlook.cfm


    Hagerman, Amy. “Bringing Unassigned Base Back into Program Eligibility for Cotton Producers.” Southern Ag Today 6(8.4). February 19, 2026. Permalink

  • 2026 Rice Market Outlook

    2026 Rice Market Outlook

    Authors

    Ryan Loy, Assistant Professor, University of Arkansas

    Alvaro Durand-Morat, Associate Professor, University of Arkansas

    2025 Domestic Market Recap and 2026 Outlook

    In 2025, U.S. rice acreage amounted to roughly 2.8 million acres, of which 2.7 million acres were harvested (USDA-NASS, 2026). All rice class acreage was down about 4 percent from 2024, due in part to the generational flood event that took place in April across the Midsouth, which forced many farmers to replant, or in some cases leave ground fallow due to razor-thin margins for rice in the South (Biram et al., 2025).  Compared to 2025, the upcoming growing season preview shows tighter stocks, with a declining price environment. The January 2026 WASDE report currently pegs long grain ending stocks at about 34.6 million bushels, little changed from the 24/25 marketing year but with a significant change in average farm price, which is currently forecasted at $10.50/cwt (down from $14.00/cwt during the 24/25 marketing year) (USDA, 2026). 

    2026 International Trade Outlook 

    International rice prices remain low due to large exportable surpluses, particularly from Asian exporters, and lower import demand from Indonesia. Temporary price increases, such as those observed in Thailand in late 2025, have already reversed, and export prices across major suppliers—including the United States, Uruguay, Thailand, and Vietnam—show sharp year-on-year declines (FAO, 2026). Unless major production shocks occur in Asia, prices are expected to remain depressed through 2026.

    Global rice production for the 2025/26 campaign is projected to be near record levels (around 541 million metric tons), with demand slightly lower (538.6 million metric tons), resulting in a third consecutive year of global surplus and continued stock accumulation (USDA-FAS, 2026). India has emerged as the world’s leading rice producer, surpassing China since 2024/25, and it is expected to reach a new production record in 2025/26 (preliminary reports suggest a record high main Kharif crop harvested in 2025 and an increase in area planted of the second Rabi crop). Its rapidly growing exportable surplus makes India a decisive force in shaping global market dynamics.

    Since U.S. long-grain rice competes strongly with Mercosur rice in the Western Hemisphere, it is important to highlight that the upcoming 2025/26 Mercosur harvest is expected to be smaller due to reduced planted area and climatic challenges, although high initial stocks—especially in Brazil—will partially offset lower output (USDA-FAS, 2026). Thus, Mercosur’s lower production performance may be good news for U.S. rice, maintaining or reclaiming market share throughout the Western Hemisphere. 

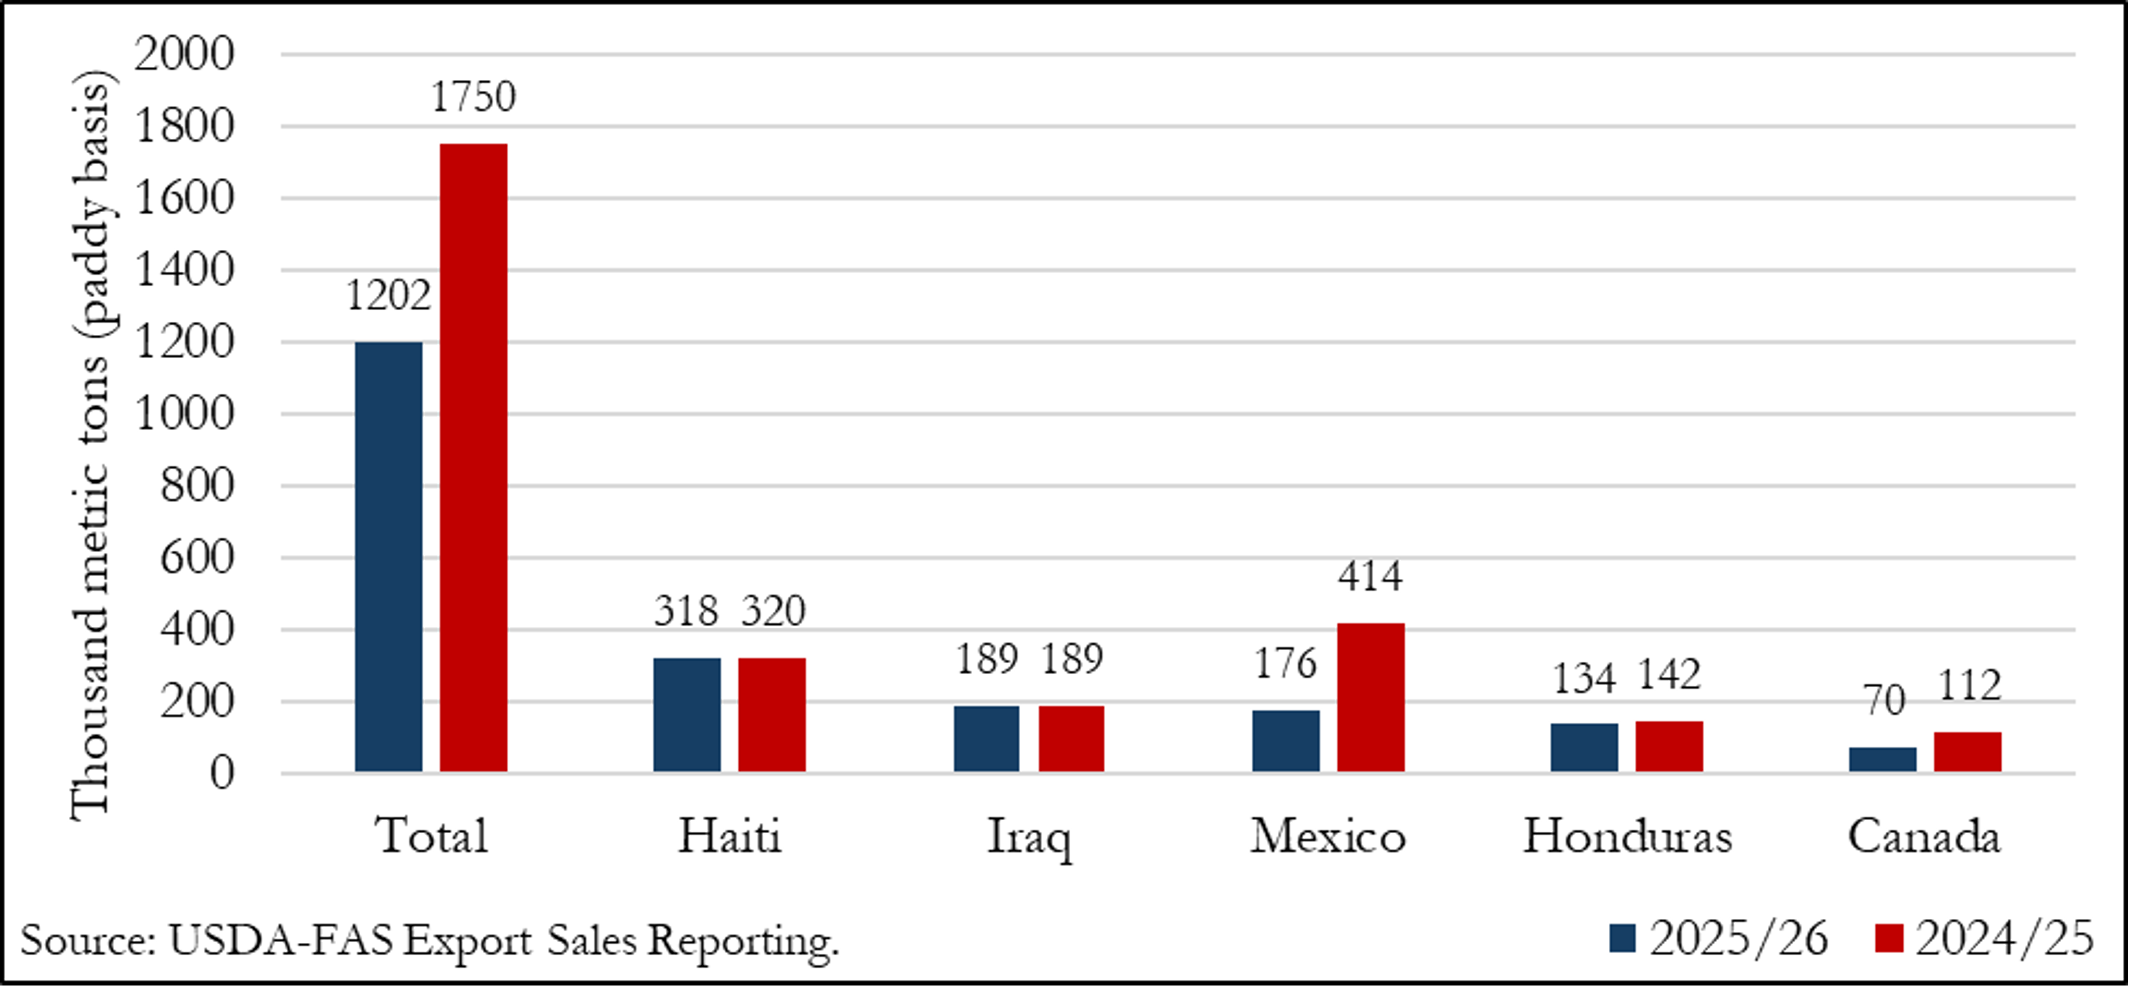
    In this international context, U.S. long-grain exports in the first half of marketing year 2025/26 (August-January) decreased 31% relative to the same period a year ago (Figure 1). While the U.S. has maintained export levels to Haiti and Iraq, it has experienced a significant drop in exports to Mexico and, to a lesser extent, to Canada and Honduras, due largely to increasing competition from South America.  

    Figure 1. U.S. long-grain exports during August-January of the marketing year – total and by top five destinations.

    References

    Biram, H.D., Loy, R., Hardke, J., Kelley, J., Ross, J., and Davis, J. 2025. Analysis Suggests Historic Flooding Results in $99 Million in Crop-Related Damages. University of Arkansas Factsheet. FSA93. Available online at, https://uaex.uada.edu/publications/PDF/FSA93.pdf.

    United States Department of Agriculture, National Agricultural Statistics Service. 2026. Crop Production: 2025 Summary. Available online at, https://esmis.nal.usda.gov/sites/default/release-files/795725/cropan26.pdf.

    United States Department of Agriculture. 2026. World Agricultural Supply and Demand Estimates. Available online at, https://www.usda.gov/oce/commodity/wasde/wasde0126.pdf.

    FAO Rice Price Update. Available online at https://www.fao.org/markets-and-trade/commodities/rice/fao-rice-price-update/en/  

    United States Department of Agriculture, Foreign Agricultural Service. 2026. Production, Supply and Distribution Online. Available at https://apps.fas.usda.gov/psdonline/app/index.html#/app/advQuery

    United States Department of Agriculture, Foreign Agricultural Service. 2026. Export Sales Reporting. Available at https://apps.fas.usda.gov/esrquery/esrq.aspx  


    Loy, Ryan, and Alvaro Durand-Morat. “2026 Rice Market Outlook.” Southern Ag Today 6(8.3). February 18, 2026. Permalink