Blog

  • In Landmark Ruling SCOTUS Overturns ‘Chevron’ Deference

    In Landmark Ruling SCOTUS Overturns ‘Chevron’ Deference

    On June 28, 2024, the United States Supreme Court issued its highly anticipated decision in Loper Bright Enters. v. Raimondo, No. 22-451 (2024). The case focused on the question of federal agency authority, and asked the Court to revisit its decision in the 40-year-old Chevron U.S.A., Inc. v. Natural Resources Defense Council, Inc., 467 U.S. 837 (1984) which famously established a legal test for judges to use when deciding whether a federal agency had acted outside its statutory authority. In a 6-3 decision, the Supreme Court officially overturned Chevron U.S.A., Inc. v. Natural Resources Defense Council, Inc., ruling that “courts may not defer to an agency interpretation of the law simply because a statute is ambiguous[.]”

    Chevron deference is a legal doctrine established by the Supreme Court to help courts determine when a judge should defer to a federal agency’s statutory interpretation. To apply Chevron deference, courts follow a two-step framework. First, the court should consider “whether Congress has directly spoken to the precise question at issue.” To make that determination, the court will review the relevant statute to see whether the language clearly addresses the issue targeted by the agency’s regulation or whether the statutory language is “ambiguous.” 

    If a court finds that the language is ambiguous, it will proceed to step two which requires the court to determine whether the agency’s statutory interpretation is “reasonable.” If the court finds that the interpretation is reasonable, then it must defer to the agency even if the court would have adopted a different interpretation. If the court concludes that the agency’s interpretation is not reasonable, then it may overturn the agency’s regulation. 

    In the decades since Chevron U.S.A., Inc. v. Natural Resources Defense Council, Inc. was first decided, it has become highly controversial. While some view Chevron deference as another tool of judicial interpretation, others regard it as a limitation on judicial authority.  

    At the Supreme Court, the plaintiffs in Loper Bright Enters. v. Raimondo challenged the doctrine of Chevron deference, specifically asking the Court to either overrule the doctrine or clarify its scope. In a majority ruling authored by Chief Justice Roberts, the Supreme Court overruled the doctrine, finding that the Administrative Procedure Act (“APA”) requires courts to “exercise their independent judgment” when determining whether an agency has acted outside of its statutory authority, and that “courts may not defer to an agency interpretation of the law simply because a statute is ambiguous[.]” The majority relied on past Supreme Court cases that address the role of courts and federal agencies in statutory interpretation, and the APA to reach its conclusion.

    In overturning Chevron U.S.A., Inc. v. Natural Resources Defense Council, Inc., the Supreme Court began by noting that Article III of the United States Constitution assigns to the federal judiciary the responsibility to hear and decide all “cases” and “controversies.” The Court then cited the foundational Supreme Court opinion, Marbury v. Madison, 5 U.S. (1 Cranch) 137 (1803). In that early case, which is regarded as establishing the scope of judicial review, the Supreme Court held that it is “the province and duty of the judicial department to say what the law is.” 

     Next, the Court reviewed its pre-Chevron case law on agency deference. The Supreme Court cited United States v. Moore, 95 U.S. 760 (1878) which explains that courts should give “the most respectful consideration” to federal agency interpretations of statutes they are tasked with administering because employees of such agencies are considered “masters of the subject[.]” The Court also cited Skidmore v. Swift & Co., 323 U.S. 134 (1944), where the Supreme Court held that a federal agency’s statutory interpretations “constitute a body of experience and informed judgement to which courts and litigants [could] properly resort for guidance,” but that such interpretations would not control a reviewing court’s own statutory interpretations.  After reviewing these cases, the majority concluded that prior to its ruling in Chevron U.S.A., Inc. v. Natural Resources Defense Council, Inc., the Supreme Court had consistently held that while a federal agency’s statutory interpretations could be given due respect by a reviewing court, it was ultimately up to the judiciary to determine the proper meaning of the law.

    Along with reviewing its own case law, the Supreme Court also examined the text of the APA. The APA is the federal law that governs the way federal administrative agencies develop regulations, and  establishes standards for judicial review of agency actions.  The law states that “[t]o the extent necessary to decision and when presented, the reviewing court shall decide all relevant questions of law, interpret constitutional and statutory provisions, and determine the meaning or applicability of the terms of an agency action.” 5 U.S.C. § 706. According to the Court, that statutory language represents Congress’s intent to have reviewing courts, not agencies, “decide all relevant questions of law” and “interpret […] statutory provisions.” The Court concluded that the Chevron doctrine cannot be reconciled with the APA because Chevron deference requires courts to adopt reasonable agency interpretations of statutory language, even if the court would have reached a different interpretation. According to the majority, this does not comply with the APA’s requirement that courts “shall decide all relevant questions of law.”

    Based on its review of both previous Supreme Court decisions, and the text of the APA, the majority in Loper Bright Enters. v. Raimondo concluded that “[i]n an agency case as in any other […] there is a best reading [of the law] all the same – ‘the reading the court would have reached’ if no agency were involved.” Following this ruling, when a court is presented with a case that involves statutory interpretation, it may not “defer to an agency interpretation of the law simply because a statute is ambiguous.” Instead, it is the role of the court to apply its own judgement to determine what the law says.


    Rollins, Bridgit. “In Landmark Ruling SCOTUS Overturns ‘Chevron’ Deference.Southern Ag Today 4(30.5). July 26, 2024. Permalink

  • Understanding the Growing U.S. Agricultural Trade Deficit (Part 2): What’s Happening with Imports?

    Understanding the Growing U.S. Agricultural Trade Deficit (Part 2): What’s Happening with Imports?

    A trade deficit occurs when the value of a country’s imports exceeds its exports. Although we often refer to the overall trade deficit (all goods), there is a growing concern about the rising U.S.  agricultural trade deficit. Recall that the most recent trade outlook report published in May 2024 by the Economic Research Service and Foreign Agricultural Service – agencies of the U.S. Department of Agriculture (USDA) – projected the highest agricultural trade deficit to date in fiscal year (FY) 2024 (October 2023 – September 2024). The FY2024 forecast have has U.S. agricultural exports at $170.5 billion, but imports at $202.5 billion. If these projections hold true, the resulting agricultural trade deficit would be a record $32 billion. To put this in context, U.S. agricultural exports have far exceeded imports in past years. It is only in recent years that U.S. agricultural trade became more balanced. FY2023 was the first year the U.S. experience a significant agricultural trade deficit ($16.7 billion), which is half the projected deficit for FY2024 (Kaufman et al., 2024). In a previous Southern Ag Today article we discussed how declining agricultural exports have contributed to the growing U.S. agricultural trade deficit. In this article we discuss the contribution of rising agricultural imports.

    U.S. agricultural imports are very different from exports. U.S. agricultural exports are dominated by bulk commodities like soybeans, corn, cotton and wheat, and minimally processed products like tree nuts, beef, and pork. Even though value added products like dairy products and prepared foods are also among top U.S. agricultural exports, U.S. agricultural imports are overwhelmingly higher value consumer-oriented products. In 2023, for instance, the major U.S. imports included fresh fruits ($18 billion), other vegetable oils ($13 billion), fresh vegetables ($12 billion), distilled spirits ($11 billion), beef products ($9 billion), coffee ($9 billion), soup and other prepared food ($7 billion), wine ($7 billion), and beer ($7 billion). Other than beef and maybe prepared foods, imports of these products greatly exceed their exports. For instance, U.S. imports of beer, wine, and spirits were around $25 billion in 2023, whereas U.S. beer, wine, and spirit exports were less than $4 billion (USDA, 2024).

    Figure 1 shows the unit values for U.S. agricultural imports and exports from 2010-2023. On a per-unit basis ($/MT), U.S. imports are significantly more expensive than exports. Since 2010, imports have been two to three times more expensive. In 2023, the import unit value was $2,543/MT versus $919/MT for exports. U.S. agricultural exports were almost 190 million MT in 2023, while imports were only 77 million MT. However, imports were valued at $196 billion, while exports were valued at $174 billion. When considering the period where the U.S. experienced significant price inflation (2020–2022), import prices increased at a much higher rate that export prices, which is to be expected given that imports are made up of higher value consumer goods. During this period, the quantity of imports continued to increase despite rising prices, but the quantity of exports declined. The main takeaways from this article are the following. 1) U.S. agricultural imports are very different than exports; 2) imports are significantly more expensive and more subject to inflationary pressures than exports; and 3) imports have persistently risen despite rising prices in recent years, which was not the case for U.S. agricultural exports.

    Figure 1. Import and Export Prices: 2010 – 2023

    Source: U.S. Department of Agriculture (USDA, 2024).

    For more information

    Kaufman, James, Hui Jiang, Bart Kenner, Angelica Williams, and Adam Gerval. (2024). Outlook for U.S. Agricultural Trade: May 2024. Report AES-128. U.S. Department of Agriculture. https://www.ers.usda.gov/publications/pub-details/?pubid=109252

    U.S. Department of Agriculture (USDA). 2024. Global Agricultural Trade System (GATS). Foreign Agricultural Service. https://apps.fas.usda.gov/gats/default.aspx


    Muhammad, Andrew, and Md Deluair Hossen. “Understanding the Growing U.S. Agricultural Trade Deficit (Part 2): What is Happening with Imports?Southern Ag Today 4(30.4). July 25, 2024. Permalink

  • Hiring H-2A Workers through Farm Labor Contracts

    Hiring H-2A Workers through Farm Labor Contracts

    The H-2A Program allows direct farm employers to hire H-2A workers through Farm Labor Contractors (FLCs) (CFR § 655.132).  Current regulations allow an FLC to file a single foreign labor certification application where they declare the need for a batch of workers intended to service multiple farms at several farm work locations.  These work assignments can even extend beyond the FLC’s home state boundaries (Castillo, Martin, and Rutledge, 2022).  

    In 2021 and 2022, FLCs have hired more than 40 percent of all DOL-certified H-2A workers, with California, Florida, and Georgia as the most popular work destinations in recent years (Table 1).  More than 60 percent of FLCs’ H-2A hires are accounted for by companies based in Florida and California. In recent years, Georgia, Texas, and North Carolina are the other Southern States included in the Top 6 home states of FLCs.

    In 2023, most H-2A workers hired by California FLCs were detailed within the state (88 percent), with about 10 percent outsourced to Arizona farms, while the rest worked in four other states (Colorado, Nevada, Texas, and South Carolina).  In contrast, H-2A hires of Florida-based FLCs are more dispersed, with 52 percent ending up employed within the state, while the rest are deployed in 28 states with North Carolina and Michigan (11 percent each), Indiana (6 percent), Georgia (4 percent), and Illinois (3 percent) as the five most popular work destinations. 

    The value of FLCs in the H-2A hiring scheme lies in their greater familiarity with the farm labor supply conditions in countries where most potential H-2A workers come from.  FLCs maintain extensive social and business networks in those countries that allow them to solicit workers even from remote local communities.  In contrast, individual U.S. farm businesses’ worker solicitation outreach networks are usually not as broad and far-reaching.  Thus, the FLCs capitalize on their good connections and extensive outreach, making them viable suppliers of prospective H-2A workers for U.S. farms.  

    However, a cursory review of wage-related violations in agriculture indicates high incidences of infractions associated with the FLC-H-2A hiring scheme. Based on more recent wage violations data compiled by the Department of Labor’s Wage and Hour Division (DOL-WHD), FLCs’ H-2A hires account for 27 percent (2022) to 31 percent (2023) of all H-2A-related cases.  Back wages owed to FLC’s H-2A workers account for 15 percent (2022) to 26 percent (2021) of all H-2A back wages.  These proportions may be less than the FLCs’ H-2A supply proportions of about 33 to 44 percent during these years, but the nature of these violations provides an interesting discussion of the crucial impact of FLCs on the viability of the H-2A program.  In a later issue, a follow-up article will discuss the nature of these FLC-associated labor violations and back wages, as well as shed light on how federal budgetary decisions could influence the varying efficiency, scope, and depth of the DOL-WHD’s policy compliance auditing process over the years.

    Table 1. H-2A Workers Hired by Farm Labor Contracts, Geographical Dispersion, and Wage

    Note:  a Non-farm labor contractors include direct farm employers consisting of individual/joint farm businesses and commodity groups (associations)
    Source:  Department of Labor (DOL) H-2A Disclosure Datasets; DOL -Wage and Hour Division (WHD)

    References:

    Castillo, M., P. Martin, and Z. Rutledge. (2022).  The H-2A Temporary Agricultural Worker Program in 2020.  Economic Information Bulletin #238, Economic Research Service, U.S. Department of Agriculture.  Washington, DC.

    Code of Federal Regulations (CFR). Labor Certification Process for Temporary Agricultural Employment in the United States, Subpart B. National Archives, Government Policy and OFR Procedures, Washington, DC.


    Escalante, Cesar L. “Hiring H-2A Workers through Farm Labor Contracts.Southern Ag Today 4(30.3). July 24, 2024. Permalink

  • Growing On-feed Inventory, Lower Placements, and No Sign of Heifer Retention

    Growing On-feed Inventory, Lower Placements, and No Sign of Heifer Retention

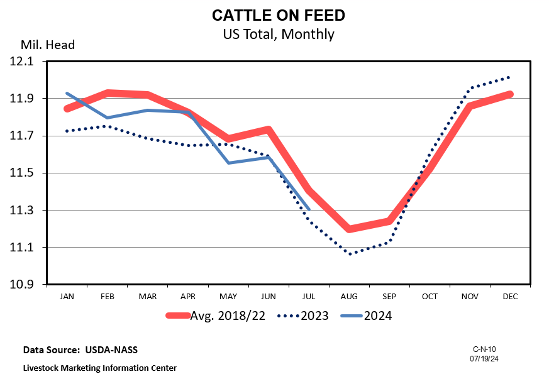
    USDA’s July Cattle on Feed report was released on Friday July 19th. These monthly reports estimate inventory in US feedlots with one-time capacity exceeding 1,000 head, which represent more than 80% of total on-feed inventory in the United States. The July report is also a quarterly report that includes data on the steer-heifer mix in feedlots. This brief article will walk through last week’s report and some of the implications of it.

    Total on-feed inventory declined during the month of June with July 1 inventory estimated at just over 11.2 million head. This trend is normal as on-feed numbers tend to decline seasonally from winter to late summer. Compared to 2023, July 2024 inventory was actually about 0.5% higher. On the surface this seems odd given the recent declines in the size of calf crops, but I maintain that cheap feed and higher slaughter weights are largely the reason for this as cattle are being fed longer.

    Feedlot placements have been the most interesting number to watch in recent months. For the month of June, placements were down almost 7% from last year. This contrasts with placements being 4% higher year-over-year for the month of May. These last two months illustrate why it is sometimes hard to look at things purely on a monthly basis. If I instead calculate feedlot placements for the first 6 months of 2024, as compared to the first 6 months of 2023, total placements have been down by 3.2%. This likely tells the feeder cattle supply story a bit better.

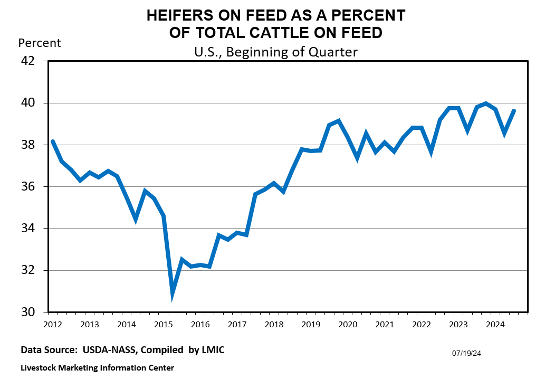
    Since USDA will not be publishing a July Cattle Inventory report this year, the July steer-heifer mix on feed is especially important as it provides some perspective on heifer retention. Heifers accounted for 39.6% of on-feed inventory in July, which was actually higher than the previous estimate from April. If retention were occurring, one would expect the heifer percentage to be in the low-mid 30% range, so this continues to suggest that expansion is not on the near horizon.

    Burdine, Kenny. “Growing On-feed Inventory, Lower Placements, and No Sign of Heifer Retention.Southern Ag Today 4(30.2). July 23, 2024. Permalink

  • Having a Way Out

    Having a Way Out

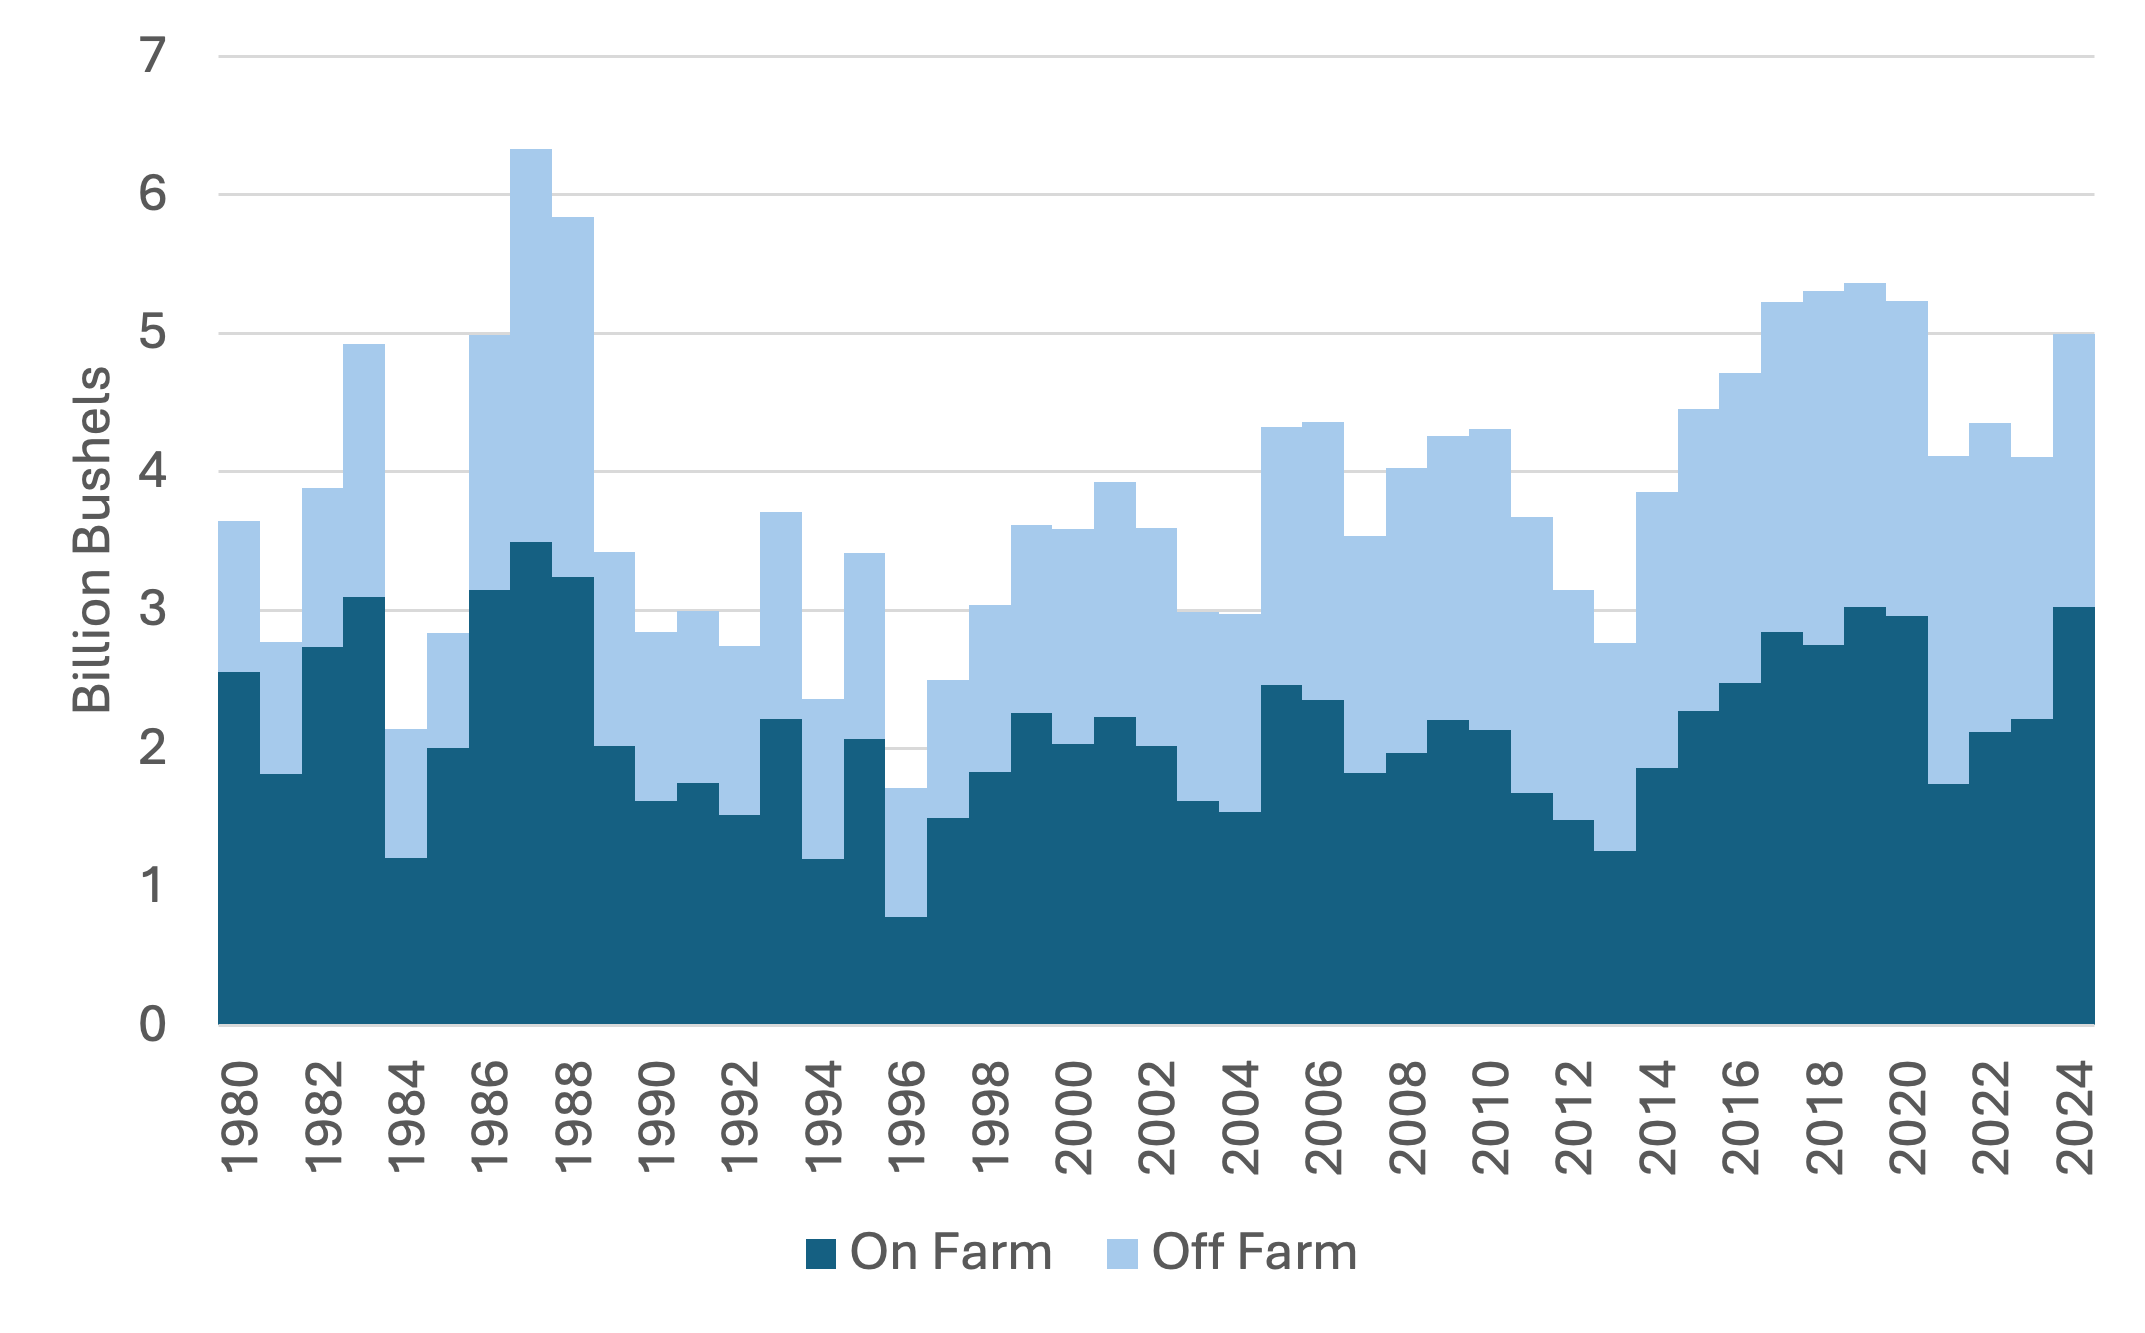
    The USDA Quarterly Stocks Report, representative of stocks held on June 1, indicated that both corn and soybean stocks (Figures 1 and 2) are higher than in recent years. High stocks are a bearish factor for the market as they increase the supply side of the balance sheet going into the new marketing year and have been one of many contributing factors to the price decline experienced this summer in corn and soybean markets. A significant insight from the report is how much stock is still stored on-farm versus off-farm.  On-farm corn stocks are at the highest level since 1988 and up 37 percent from last year. On-farm soybean stocks are up 44 percent from a year ago. Given the high level of stocks still being held by producers, it is appropriate to discuss the importance of having an exit strategy that allows producers to exit old crop positions in preparation for new crops. While the exit strategy ideally should be decided before grain goes into storage, some pieces of the discussion below could still be implemented this late in the marketing year. 

    An exit strategy marks the official end of marketing activities for a particular crop year. No matter what type of marketing tool is used, a basic exit strategy utilizes price-driven or time-driven methods. Specific price targets guide a price-driven exit strategy. An example would be selling stored grain at X cents over the harvest price. In this case, the harvest price would be what the grain could have been sold for at harvest. Ideally, a price-driven exit strategy would divide sales up across a range of prices; an example for corn would be selling 10,000 bushels at $4.25 per bushel, 10,000 bushels at $4.40 per bushel, and the last 10,000 bushels at $4.50 per bushel. As each price level is attained, grain is sold. This strategy diversifies price targets to ensure you are not stuck with mostly unpriced grains when transitioning into the lower price environments we are currently experiencing. Another example would be selling stored grain at X cents under the harvest price. At some point, exit strategies need to be used to cut losses. Price targets serve as bookends that guarantee the producer will not be left holding grain indefinitely, speculating on a marketing situation that never occurs.

    Another exit strategy is to set predetermined sale dates. This could be as simple as “I will sell all stored grain by July 31” or “I will sell 10,000 bushels the first of each month, with my final sale occurring July 31.” Setting a predetermined date forces the producer to take a marketing action. An exit strategy can have both price-driven and time-driven components, for example, selling all stored grain at $4.25 per bushel or higher before July 31st. Being late in the marketing year, a producer can still sell their grain and maintain a position in the market by buying a call option. If it is decided to hold on to the physical grain, producers will likely need to plan to store until after harvest, as harvest pressure will decrease the likelihood of a better pricing environment.     

    While the exit strategies discussed above may seem straightforward, they do a good job of curbing emotional hesitancy in marketing decisions. One of the most challenging emotions for producers to control is regret. A producer might feel regret if they sell right before a rally begins or decide not to sell before a market downturn. Dwelling on regret about past sales can make producers hesitant to book future sales.  A well-developed exit strategy can assist producers in coping with emotional bias in marketing decisions. A successful grain sale is based on sound reasoning, with each component of the exit strategy being grounded in price targets derived from production costs and time targets based on local market seasonality. This exit-strategy approach ensures that each marketing decision is reasonable and not regretted in hindsight. An exit strategy gives producers a way out of the old crop and allows them to focus on new crop positions. 

    Figure 1. On-Farm and Off-Farm June 1 Corn Stocks 

    Figure 2. On-Farm and Off-Farm June 1 Soybean Stocks 


    Maples, William E. “Having a Way Out.Southern Ag Today 4(30.1). July 22, 2024. Permalink