Blog

  • Drones Flying over my Property: What can I do?

    Drones Flying over my Property: What can I do?

    Unmanned Aerial Vehicles (UAVs), often referred to as drones, create cheaper and more efficient ways to gather agronomic data and to apply pesticides to crops.  This new technology shows a great deal of promise for agriculture, but it also creates privacy concerns for neighboring landowners.  What are the legal aspects of privacy, and what can a worried landowner do about strange UAVs flying over their property?

    Privacy

    Privacy concerns from aerial surveillance are nothing new.  We have case law about aerial surveillance from law enforcement going back more than fifty years (click here for one example). A simplified explanation of this concept can be illustrated through examples using traditional aircraft. In the case referenced above, law enforcement was tipped off that an individual was growing marijuana on their property, so they flew a helicopter twenty feet off of the ground to capture images of the plants.  In this case, the court held that law enforcement violated the “serenity and privacy of the backyard[,]” and this constituted a search without a valid warrant. In another example, you have an individual flying over your property in an aircraft at an altitude of 500 feet and taking pictures of your property with a powerful camera. This example likely does not constitute a violation of someone’s right to privacy. What is the takeaway from these examples? Someone can violate your right to privacy, and potentially even commit trespass, by flying too low over your property, but your rights are greatly diminished when the aerial surveillance is conducted at higher altitudes.

    What about UAVs? Recreational UAVs typically operate in Class G airspace which is 400 feet and below.  There are other restrictions such as flying around airports, military installations and prisons, but we will use 400 feet for the sake of simplicity. This puts UAVs in a gray area.  One question that we are struggling with legally is how low is too low? This question may end up being moot because of rapidly advancing technology.  The laws surrounding aerial privacy have changed in recent years (to see a compilation of state UAV laws click here), but technology is evolving even quicker.  UAVs have not changed the laws surrounding privacy, but they have made it much cheaper and easier to conduct aerial surveillance.  For the price of operating a helicopter for one day, an individual can buy a UAV equipped with an excellent camera and use it for weeks on end. Many early cases about aerial surveillance were against law enforcement because only the government was able to afford it. Modern UAVs and mass production have placed this technology in the hands of the general public.

    Can I Shoot Down a UAV?

    A common question we have received with the proliferation of UAVs is whether a landowner can shoot down a UAV that is flying low over their property. The answer is an emphatic “No!” The Federal Aviation Administration (FAA) is in charge of regulating aircraft and the airspace where they operate. UAVs are classified as aircraft by the FAA (unmanned, but still aircraft), and under federal law, 18 U.S.C.A. § 32, it is a felony to “damage, destroy, disable, or wreck any aircraft,” and the potential punishment is up to twenty years in federal prison. What can a landowner legally do about a UAV flying over their property?  The answer is very little in most cases. You can report suspicious UAV activity to the FAA. UAVs are required to display their registration numbers on the outside of the aircraft (14 CFR Section 48.205(c)). For low flying UAVs it should be possible to capture an image of this registration number to go with your complaint.  Other actions, such as capturing images through windows of residences, may also open avenues for local law enforcement to become involved. Documenting and reporting remain the safest legal way to deal with problematic UAVs around your property.


    Rumley, Rusty. “Drones Flying over my Property: What can I do?Southern Ag Today 5(8.5). February 21, 2025. Permalink

  • Do Major U.S. Ag Trading Partners Apply Tariff Reciprocity?

    Do Major U.S. Ag Trading Partners Apply Tariff Reciprocity?

    In a previous article, we wrote about How U.S. Tariff Rates Compare to Other WTO Countries using weighted average tariff rates. The tariff rates discussed in that article are the Most Favorable Nations (MFN), which are the tariff rates applied to WTO members. However, many WTO countries also have other bilateral or multilateral trade agreements such as USMCA, CAFTA-DR, and Mercosur, to name a few. Participating countries in those trade agreements negotiate lower or preferential tariff rates among themselves using the MFN tariff rates as the starting point. In this article, we will examine the tariff rate reciprocity between the U.S. and its top five agricultural trading partners. This issue is especially important given the recent announcement by the President to increase U.S. tariffs to “reciprocal” levels.

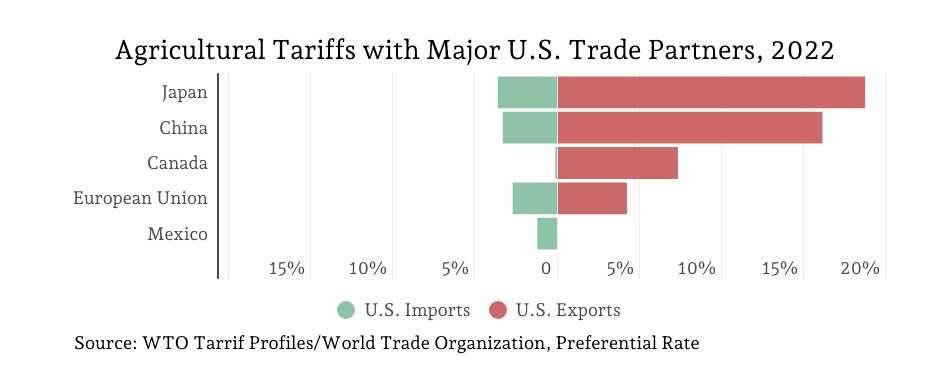
    Out of the top five agricultural trading partners, the United States has a trade agreement with Canada and Mexico—called the United States-Mexico-Canada Agreement—and with Japan—called the U.S.-Japan Trade Agreement. The United States had a two-year trade agreement with China in 2020 and 2021, and no trade agreement exists between the United States and the EU. The figure below shows the preferential weighted average tariff rate the United States charges for agricultural products imported from its top trading partners in green. On the other hand, the right side of the figure, in red, shows the preferential weighted average tariff that trading partners impose on U.S. agricultural exports. Finally, the table shows the value of U.S. agricultural imports and exports to and from each trading partner, the preferential weighted average tariff rate, and the differential, i.e. imports minus exports tariff rates. In other words, the difference between the U.S. tariffs on imported products minus the tariff the importing country imposes on U.S. exports. If the differential is negative, it means that the trading partner imposes a higher tariff rate than the United States. To illustrate, the United States imposes a 0.1% tariff on agricultural products from Canada while Canada imposes a 7.3% tariff on U.S. agricultural products, resulting in a tariff rate differential of -7.2 %. Similarly, the United States imposes a 3.3% tariff on Chinese agricultural products while China imposes a 16.1% tariff on U.S. agricultural products (tariff rate differential of -12.8%). Focusing solely on agricultural trade, the United States has a negative tariff rate differential with all trading partners ranging from -1.5% to -15.1%. Mexico is the only exception where U.S. tariffs are relatively larger (1.2% tariff rate differential).

    (Note: In this article, we are addressing applied tariffs and not Non-Tariff Measurements (NTMs), which can be a considerable trade barrier mechanism.)


    Ribera, Luis, and Landyn Young. “Do Major U.S. Ag Trading Partners Apply Tariff Reciprocity?Southern Ag Today 5(8.4). February 20, 2025. Permalink

  • How Might Trade Disputes Affect the U.S. Peanut Industry?

    How Might Trade Disputes Affect the U.S. Peanut Industry?

    On January 31, 2025, the White House announced a 25% import tariff on products from Canada and Mexico that was set to take effect on February 1st but was soon after delayed for one month. Before the pause, Canada announced retaliatory tariffs on several agricultural products including peanut butter. Then on February 10th, the White House announced a 25% tariff on aluminum and steel imports, and the European Union responded with a list of products that could be targeted with retaliatory tariffs, also including peanut butter. The recent trade disputes raise the question of how U.S. peanuts could potentially be affected.

    While the U.S. only produces about 5% of the world’s peanuts, it exports 14% of the world’s peanuts. In the 2023/2024 marketing year, 22% of the 3.27 million tons of peanuts that the U.S. produced were exported to other countries. In contrast, 58% of U.S. peanuts went to domestic food production. The U.S. also exports significant amounts of processed peanuts, including peanut butter, which totaled over $256 million in the 2023/2024 marketing year. Thus, while export markets are not the largest destination for U.S. peanuts, they are still a significant portion, and the U.S. is a major peanut exporter. 

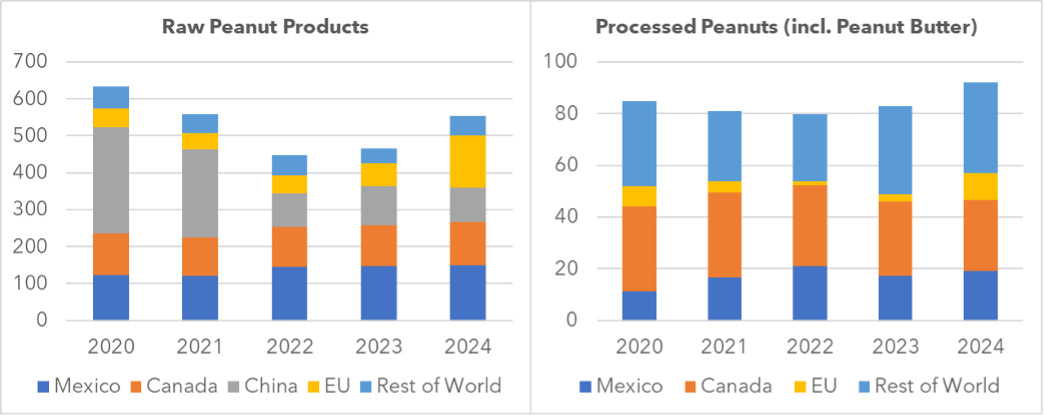
    Figure 1 shows the top destinations for U.S. exported peanuts and processed peanut products over the past five marketing years. Mexico has been the top export destination for raw U.S. peanuts each of the past three years, at an average of 147,000 tons of peanuts per year. Canada ranks second over the same period, at 112,000 tons, on average. In the 2023/2024 marketing year, the European Union had a 126% increase in peanut imports from the U.S., totaling 142,000 tons. Lastly, China was the largest peanut export destination from 2019-2021, but has decreased its peanut imports from the U.S. the past three years. Overall, Mexico, Canada, China, and the European Union account for 90% of raw U.S. peanut exports. In contrast, 57% of U.S. processed peanut exports have gone to Canada and Mexico over the past five marketing years. The European Union nearly quadrupled its imports of processed peanut products from the U.S. this past marketing year. In sum, any reduction of U.S. raw or processed peanut exports to Canada, Mexico, and the European Union could present challenges to the U.S. peanut industry.

    Figure 1: U.S. Peanut Exports by Destination, Form, and Marketing Year (thousand tons)

    Data Source: U.S. Census Bureau Trade Data; Compiled by USDA-FAS.
    Note: Marketing years shown are the ending year (Aug through July)

    Sawadgo, Wendiam. “How Might Trade Disputes Affect the U.S. Peanut Industry?” Southern Ag Today 5(8.3). February 19, 2025. Permalink

  • Fewer Cattle on Feed?

    Fewer Cattle on Feed?

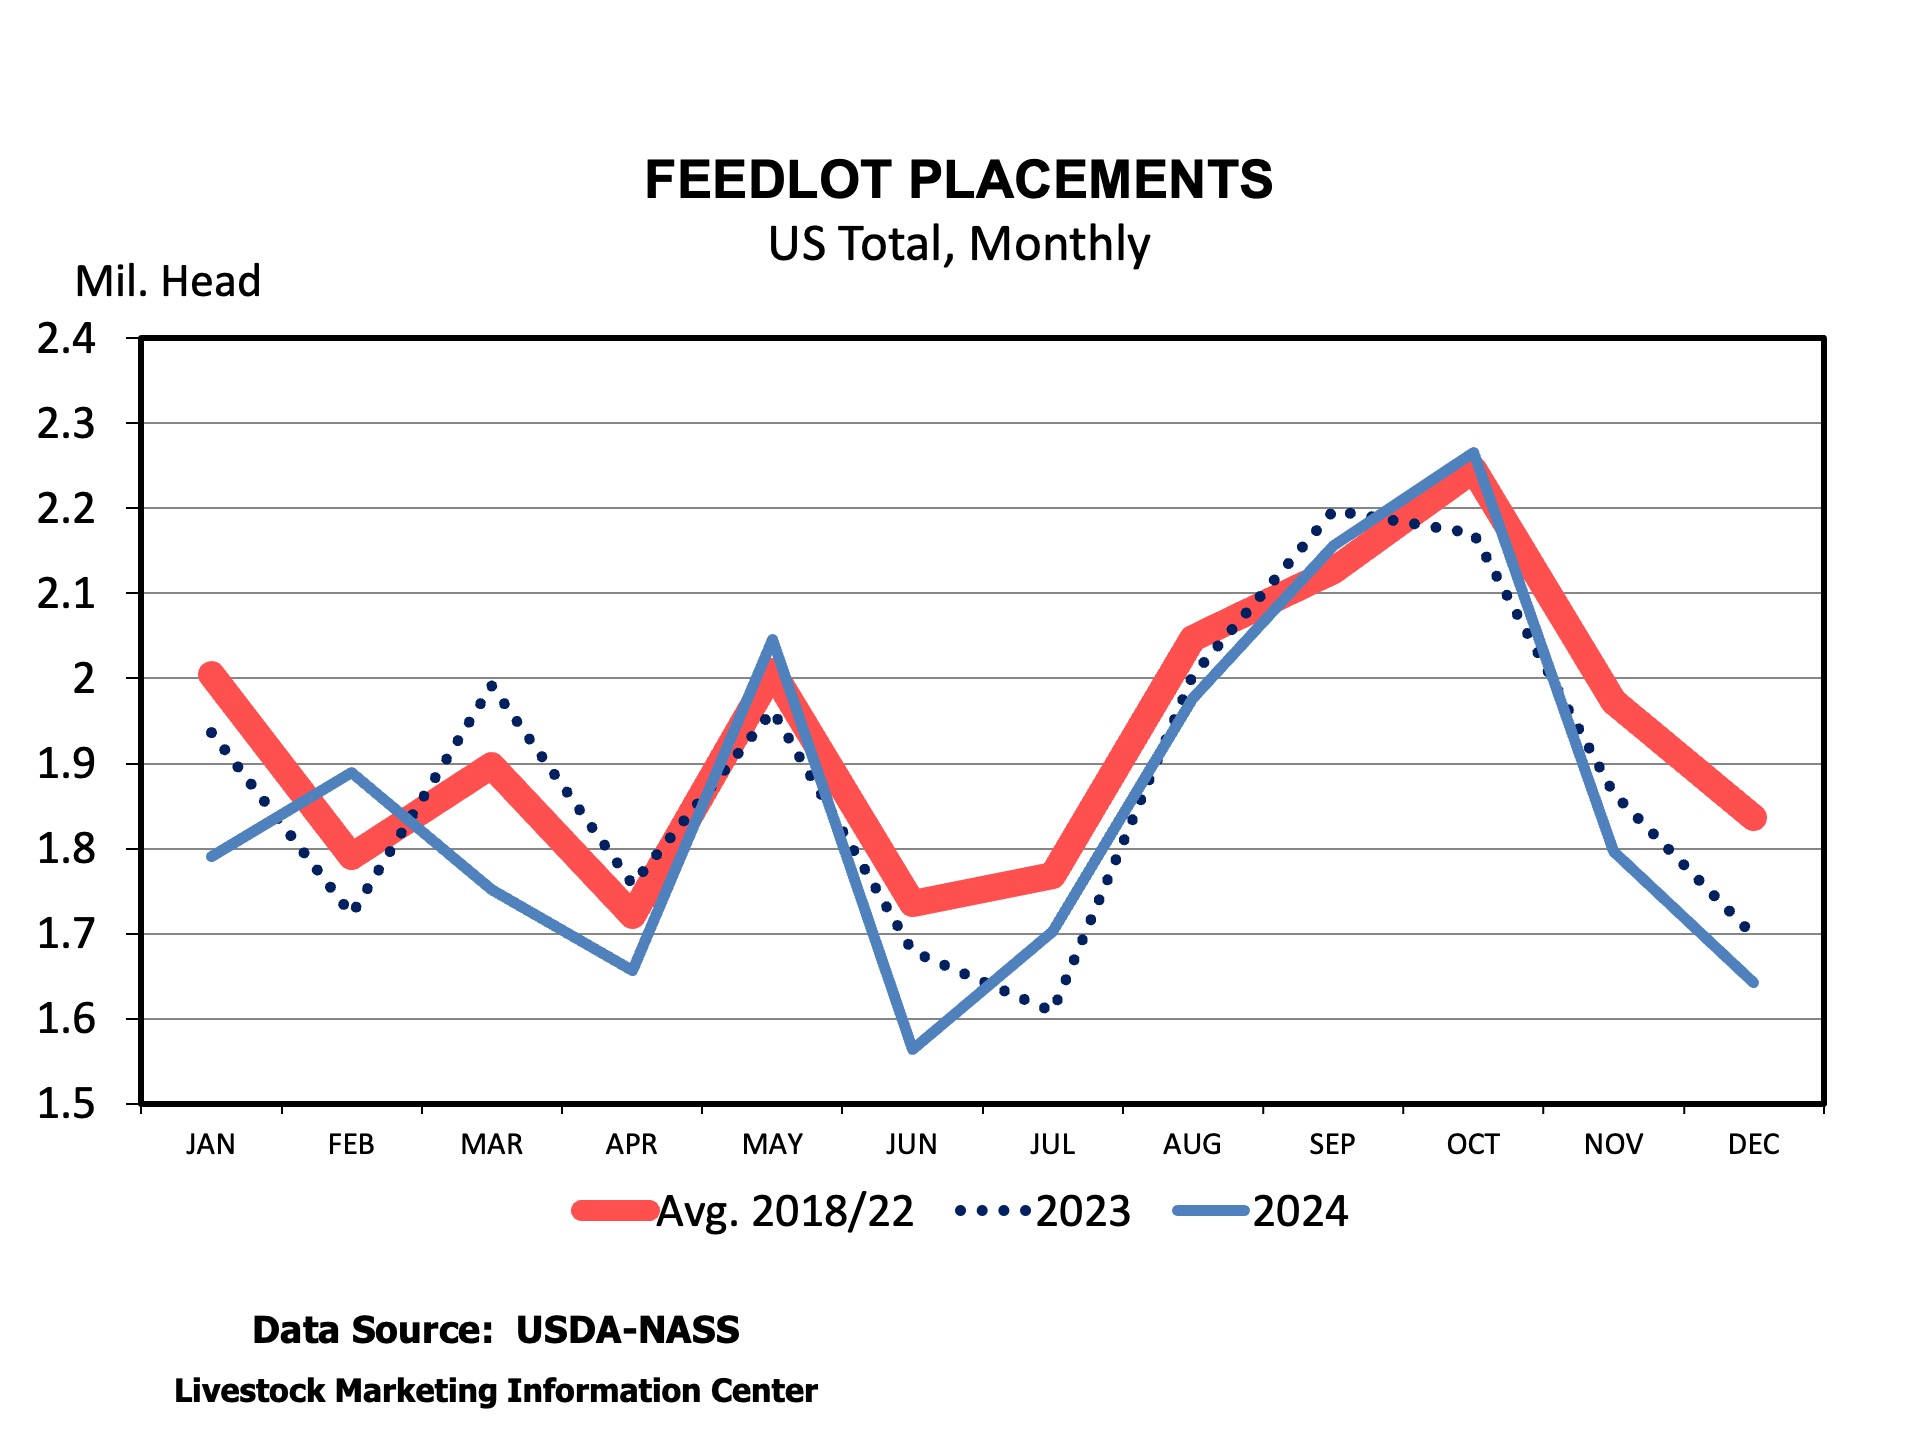
    USDA will release the February Cattle on Feed report on Friday, February 21st.  It’s following closely on the heels of the cattle inventory report released at the end of January.  There are several interesting things to look for in this report, including overall placements, the impact of border restrictions on placements in Texas, and the number of cattle in feedlots.

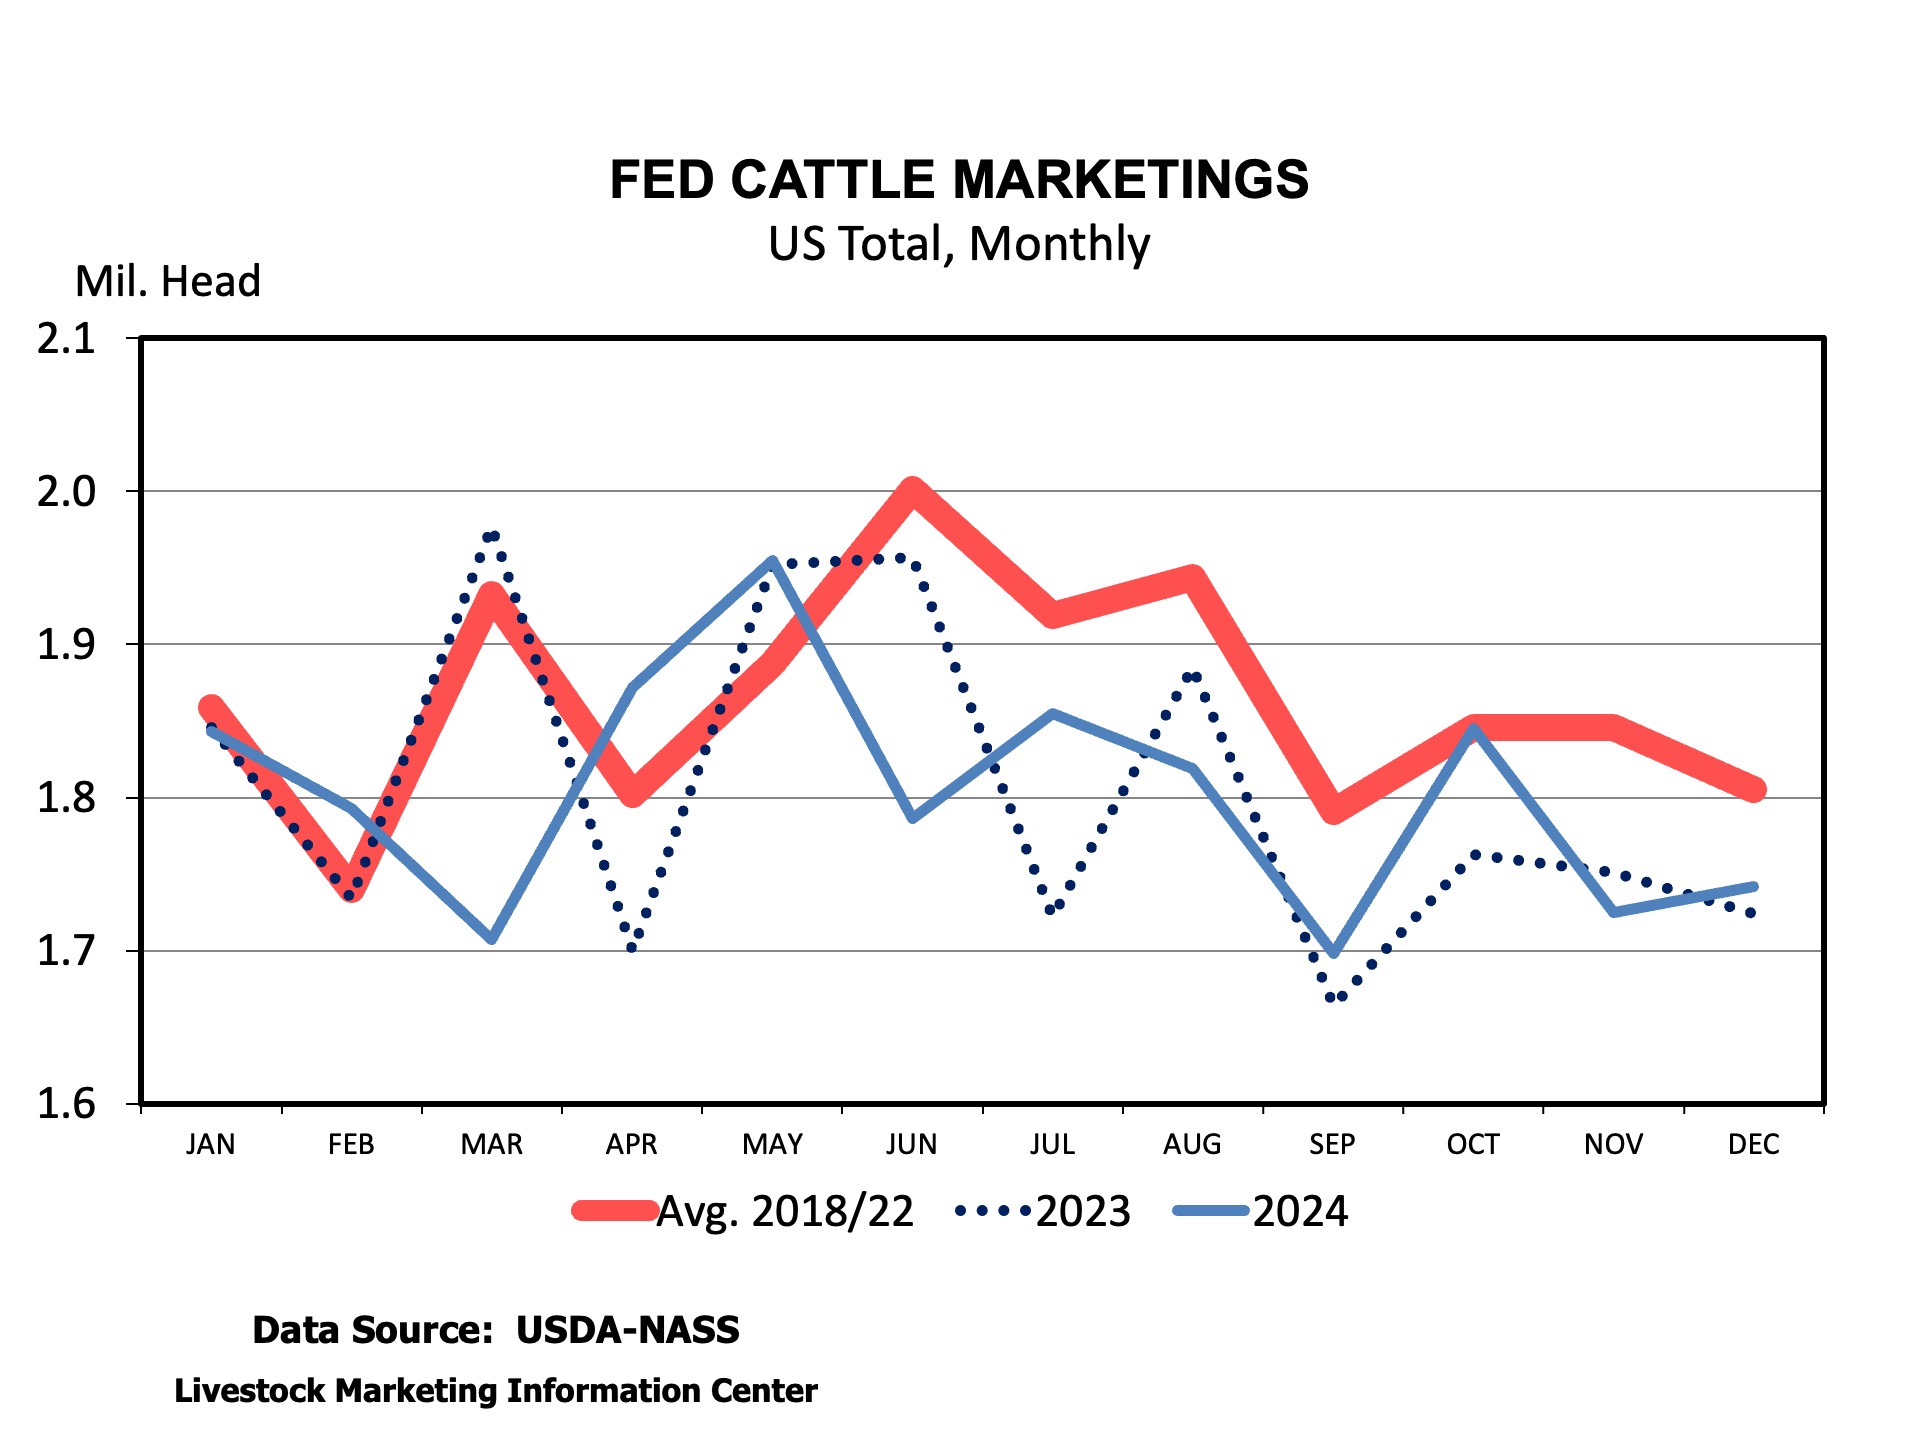
    In a sense, marketings and placements are related.  We can think of cattle leaving the feedlot for a packer (marketings), making way for new cattle to enter (placements).  Marketings are estimated to be up about 2.5 percent in January compared to last January.  Given the same number of working days as a year ago, daily average marketings were faster than last year.  

    In my pre-report estimates, I expect placements to be about the same as a year ago.  Placements equal to last January would imply a fairly small number of feeder cattle placed compared to marketings.  This estimate balances larger numbers of feeder cattle in the CME feeder cattle index and no cattle entering the U.S. from Mexico in January.  The U.S. imported 107,000 fewer feeder cattle in January 2025.  Feeder cattle imports only resumed in the second week of February, at very low levels compared to last year.  The number of lightweight placements in Texas will provide some good insight into the impact of the ban on placements.  Texas placements in December were down 23 percent, with much of that decline coming in the lightest weight categories.

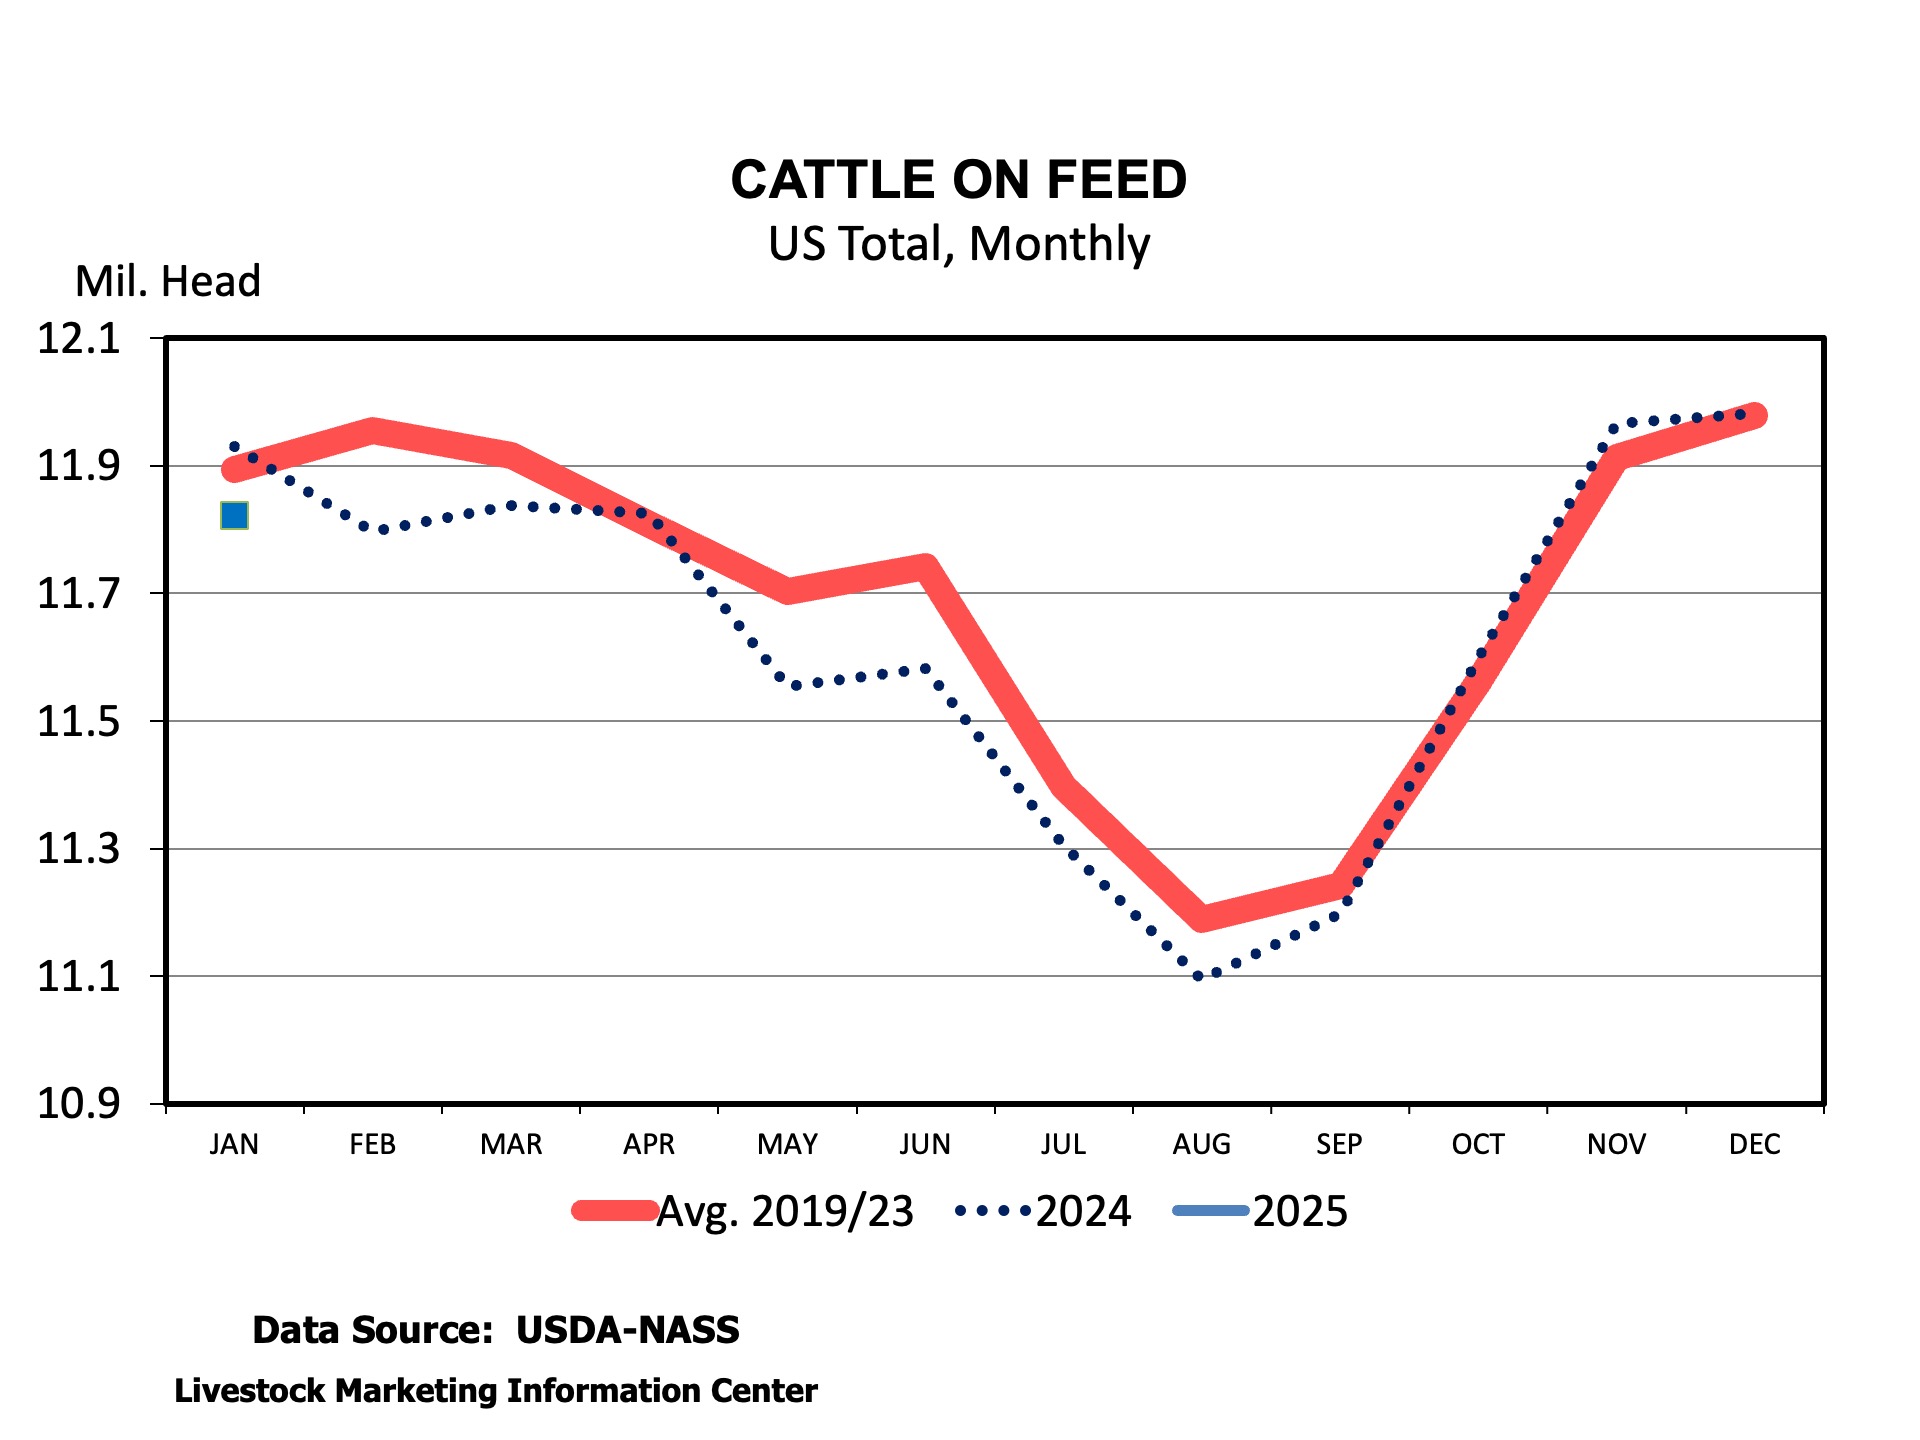
    The combination of larger marketings and no change in placements would pull down the number of cattle on feed on February 1st to 98.8 percent of the prior February.  Sooner or later, fed cattle supplies will begin to decline dramatically due to fewer calves and herd rebuilding.  The market likely can’t continue to rob Peter to pay Paul by pulling animals ahead and placing heifers, and when that ends, the number of cattle on feed will decline dramatically.  That will lead to another increase in calf and feeder cattle prices this year.

    Two other interesting pieces of information will be included in this report.  The February report includes an estimate of total feedlot capacity in the U.S.  We often talk about packer capacity but rarely feedlot capacity.  Feedlot capacity has not been a limiting factor in the market.  This report will also include data on the number of fed cattle marketings and cattle on feed by size of feedlot.  That data provides some insight on concentration in the feedlot sector.  


    Anderson, David. “Fewer Cattle on Feed?Southern Ag Today 5(8.2). February 18, 2025. Permalink

  • Managing Through Tough Times

    Managing Through Tough Times

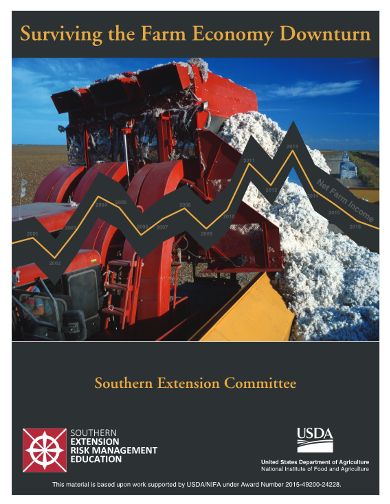
    Back in 2015, Extension specialists across the Southeast (many of our current SAT contributors) came together to address the decline in the farm economy, specifically declining commodity prices and increasing financial pressure. The resulting publication is a compilation of articles on topics including financial and risk management, marketing, farm management, trade, and stress management. The publication provides strategies for navigating financial difficulties, reducing risk, and identifying opportunities for growth even during downturns. While the publication is approaching ten years old, the core management strategies and concepts are still pertinent as we face a very similar farm economy today. 

    Key Farm Management Strategies include:

    1. Financial Resilience: Carefully managing debt and maintaining cash flow are key to building resilience.  Work closely with lenders to help monitor financial health and consider restructuring loans when necessary to preserve adequate working capital.

    2. Cost Control and Efficiency: Reducing input costs, optimizing equipment use, and managing labor effectively can help improve profitability. Assessing operational expenses and cutting unnecessary expenditures are essential.  Even the smallest changes can add up.

    3. Risk Management Strategies: Utilizing crop insurance, following an effective marketing plan, diversifying income sources, and engaging in collaborative farming can help mitigate financial risk. Exploring all available government support programs and financial assistance options can provide relief during downturns.

    4. Market Adaptation and Diversification: Considering alternative crops, livestock production adjustments, or producing for specialty markets can help maintain income. Understanding market trends and adapting production strategies accordingly is vital for long-term sustainability.

    5. Mental Health and Well-being: Economic stress can take a toll on farmers’ mental health. Seeking support, engaging with extension services, and maintaining a strong social network can help manage stress, depression, and other challenges related to financial strain.For a deep dive on all economic topics, including the farm management strategies above, the full publication can be found here: “Surviving the Farm Economy Downturn”.


    Shockley, Jordan, and Steven Klose. “Managing Through Tough Times.Southern Ag Today 5(8.1). February 17, 2025. Permalink