Blog

  • Be Mine: FDA bans food dye used in popular candies

    Be Mine: FDA bans food dye used in popular candies

    On January 16, 2025, the Food and Drug Administration (FDA) revoked the color additive listing for use of Red Dye No. 3, a food dye that is used to color Brach’s Conversation Hearts and other popular candies. This decision was in response to a petition filed by the Center for Science in the Public Interest (CSPI) and other stakeholders to ban Red Dye No. 3 under the Delaney Clause of the Food, Drugs, and Cosmetics Act (FDCA). The Delaney Clause is a provision in the FDCA that deems any color additive found to cause cancer in man or animals as unsafe for any use that results in its ingestion. Specifically, the CSPI petition cited two studies that showed cancer in laboratory male rats exposed to high levels of Red Dye No. 3. Though the FDA did revoke the authorized uses for Red Dye No. 3 in food and ingested drugs to comply with the Delaney Clause, it maintains that available scientific information does not support that claim that ingested Red Dye No. 2 puts people at risk. 

    Red Dye No. 3 is considered a “color additive” under the FDCA. Color additives are defined as “a dye, pigment or other substance, which is capable of imparting color when added or applied to a food, drug, cosmetic or to the human body,” and are considered useful by the FDA for providing a color consistency that helps consumers identify food products on sight. To be used in food, drugs, cosmetics, or medical devices, the FDCA requires that color additives be approved by the FDA. This is done through a Color Additive Petition that provides evidence that the additive is safe for the ways in which it will be used. Once the petition is approved, a regulation identifying the conditions of use is published in the Federal Register. When a color additive’s regulation is published, it is considered “permanently listed,” however, per the FDA, it may “revoke or amend” the listings as needed. Here, the FDA is revoking the regulations formally found at 21 CFR §§ 74.303, 1303 authorizing the use of Red Dye No. 3 for coloring in foods and ingested drugs.

    Though Red Dye No. 3 has been in commercial use since the early 1900s, it was not permanently listed until 1969. The current petition process for color additives was created under the Color Additive Amendments of 1960, and following the update, all additives that were previously in commercial use were reevaluated for safety. Specifically, the color additives were provisionally listed and could only be used on an interim basis until they were either permanently listed or terminated. Thus, Red Dye No. 3 was provisionally listed in 1960 and stayed under that classification until it was proved safe through the petition process in 1969 and permanently listed for use in food and ingested drugs. In 1990, the FDA revoked Red Dye No. 3’s authorization for use in cosmetics and topical drugs under the Delaney Clause. Following that revocation, the FDA announced it would also revoke Red Dye No. 3’s authorization under the Delaney Clause for use in food and ingested drugs, but it never followed through. According to the FDA, “the agency decided not to take action at that time, given the resources required to remove this authorization,” but maintained that “available data does not raise safety concerns for humans.”

    State level bans 

    The FDA banning Red Dye No. 3 follows several states proposing legislation that sought to ban food and color additives. Specifically, in October of 2023, California became the first state in the nation to ban the manufacture, distribution, and sale of foods and beverages containing certain color additives, including Red Dye No. 3. Following California’s passage of the law, several other states proposed food and color additive bans in 2024. Currently, at least six states have legislation introduced in their legislative sessions similar to California’s banning certain food or color additives. These states include New JerseyArkansasMissouriOklahomaNew York, and Delaware. Additionally, in 2024, California passed the California School Food Safety Act prohibiting food with certain food and color additives from being sold in schools. So far, TexasHawaii, and Virginia have introduced similar legislation this session that seeks to ban the use of certain additives in food and beverages sold in schools. As most states are just beginning the 2025 legislative session, there might be more bills relating to these topics proposed in the coming months. 

    Next Steps for the Federal Ban 

    As the rule currently reads, food manufacturers who use Red Dye No. 3 in foods will have until January 15, 2027 to comply, while ingested drug manufacturers will have until January 18, 2028. The agency action banning Red Dye No. 3 was published in the last few days of the Biden administration. As such, its future under the Trump administration remains uncertain. The Trump administration has not spoken about its intentions regarding the issue, so the future of the Red Dye No. 3 ban remains unclear. Regardless, the conversation hearts are safe for this Valentine’s Day. To learn more about this issue, click here to read NALC article, “FDA bans Red Dye No. 3.” 


    Stone, Emily. “Be Mine: FDA bans food dye used in popular candies.Southern Ag Today 5(7.5). February 14, 2025. Permalink

  • Why Haven’t Land Values Reacted to Reduced Farm Profits?

    Why Haven’t Land Values Reacted to Reduced Farm Profits?

    While on the road doing preplant meetings around the country, one of the questions we’ve been asked the most by farmers is: with reduced farm profitability, why haven’t land values declined?  Over the past year, there have been two Southern Ag Today articles that have addressed different parts of this issue.  Kim discussed the trends in Southern farmland values while Loy and Biram addressed the relative profitability of U.S. farms, looking at the disparity between crop prices received and input prices paid.  Table 1 indicates that, while not very often, Southern state cropland values have occasionally decreased (indicated by numbers in parentheses) over the past nine years. 

    The question of why land values haven’t reacted to reduced profits requires a multifaceted answer that most farmers don’t like to hear.  The first part of the answer is that land values should follow farm profitability to a degree, but farm profitability isn’t the only factor. Long-term interest rates – or the cost of borrowing money – also matters.  With current interest rates relatively high, there should be downward pressure on farmland prices.

    The part of the answer they like the least is also where we tend to get agreement from them: farmers are not the only people trying to buy farmland.  During almost every one of our Agricultural and Food Policy Center (AFPC) representative farm updates, the farm panel members talk about how hard it is to buy land at prices that can realistically be paid back with expected farm profits.  So, who else is buying land?  Nonfarm real estate investors such as publicly traded farmland real estate investment trusts (REITs), insurance companies, and just about anyone who wants to use real estate as an investment are actively investing in farmland across the United States.  The two farmland REITs that people talk about the most are Farmland Partners and Gladstone Land. Both REITs own land in multiple states.

    Farmland values and agricultural profitability are related, but in today’s farmland markets, there are many other factors and players that influence the value of U.S. farmland.

    Table 1.  Change in Southern State Cropland Values, Annually from 2016 to 2024.


    Outlaw, Joe, and Bart L. Fischer. “Why Haven’t Land Values Reacted to Reduced Farm Profits?Southern Ag Today 5(7.4). February 13, 2025. Permalink

  • Midsouth Rice Production and Trade Update for 2024/25 

    Midsouth Rice Production and Trade Update for 2024/25 

    Midsouth Production Expenses and Profitability

    The global rice market is poised for significant shifts in the 2024/25 marketing year, driven mostly by relative profitability, policy changes, and evolving global trade dynamics. Domestic rice production expectations, specifically in Arkansas, look to increase slightly, marking three consecutive years of increased rice acres and production. Shifting off the traditional crop rotation may signal rice’s operating margins are a more attractive investment to farmers (and their lenders) again in 2025. Based on enterprise budgets published by the University of Arkansas, operating expenses for rice look to improve year-over-year (Table 1). Nitrogen inputs show the only increase in per-acre expenditures, with a 4% increase from 2024, while seed and diesel expenses have significantly declined. It’s worth noting that a possible 2025 seed shortage could hinder the expansion of rice acres; if this comes to fruition, seed expenses will likely increase relative to 2024, severely impacting profitability (Haigwood, 2025).  

    Table 1. 2023 – 25 Selected Rice Operating Expenses

    202320242025% Change         
    (2024 – 2025)
    Seed ($/ac)$43.92$71.28$45.36-36.36%***
    Nitrogen (N) ($/lb)$0.40$0.25$0.264.00%
    Phosphate (P) ($/lb)$0.45$0.35$0.350.00%
    Potash (K) ($/lb)$0.41$0.25$0.250.00%
    Herbicide ($/ac)$138.78$135.89$131.62-3.14%
    Insecticide ($/ac)$3.01$9.04$9.040.00%
    Fungicide ($/ac)$24.10$11.32$11.320.00%
    Diesel ($/gal)$4.50$3.65$2.80-23.29%

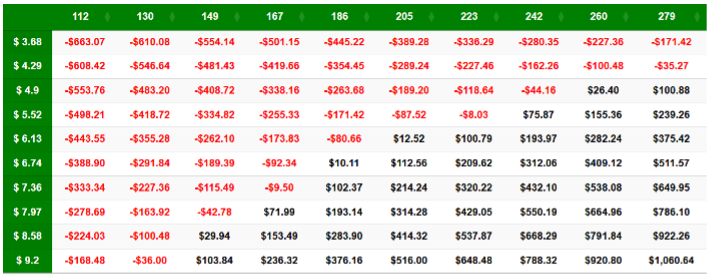
    Per-acre operating costs in Arkansas amount to roughly ~$992/acre, based on 2025 operating expense forecasts. Table 1 highlights the profitability of mid-south rice production using Arkansas County, Arkansas. Using the 2023 Arkansas state average yield and price of 186 bu/acre and $6.13/bu, a mid-south rice farmer under an 80/20 crop share agreement can expect to breakeven at 203 bu/acre (assuming $6.13/bu) or at $6.67/bu (assuming 186 bu/acre). Table 1 below highlights per-acre profit above operating expenses (~$992/acre) under a range of prices and yields.  

    Figure 1. Rice Net Operating Returns, Arkansas County, Arkansas, 2025, 80-20 Crop Share

    Quick Trade Update

    The Mexico rice market will be worth watching as we move into the 2024/25 marketing year. The USDA-FAS forecasts Mexico to import nearly 860,000 metric tons of paddy/rough rice (a 1% increase YoY). The U.S. is poised to remain the primary source of these imports due to its proximity and relationship with Mexico. However, Brazil (and other countries such as Argentina and Thailand) are expected to increase their market share of Mexican paddy rice imports from lower prices and tariff exemptions through the extended Presidential Anti-inflation decree, which exempts tariffs on countries without a free trade agreement (FTA) for rough rice through 2025 (USDA-FAS, 2025). However, long-grain milled rice is not included in the tariff exemption, and as such, the import tariff returns to 20% for countries besides the United States, which is exempt due to the USMCA trade agreement. This helps the U.S. maintain competitiveness and retain market share for milled rice exports to Mexico (USDA-ERS, 2025).  Still, domestic U.S. rice supply has outpaced total use (including exports), with a 10.7% increase in ending stocks, according to the January 2025 WASDE Report. Current ending stocks, coupled with the expectation for increased rice acres and global trade uncertainty, could continue to put downward pressure on rice prices and hinder U.S. export competitiveness into this marketing year.  

    References

    University of Arkansas, Division of Agriculture. (2025). Crop Enterprise Budgets for Arkansas. Retrieved January 2025, from, https://www.uaex.uada.edu/farm-ranch/economics-marketing/farm-planning/budgets/crop-budgets.aspx

    United States Department of Agriculture, Economic Research Service. (2025). Rice Outlook: January 2025. Retrieved January 2025, from, https://downloads.usda.library.cornell.edu/usda-esmis/files/dn39x152w/3f464060c/t722k493j/RCS-25A.pdf

    United States Department of Agriculture, Foreign Agricultural Service. (2025). Grain and Feed Update: Mexico, January 2025. Retrieved February 2025, from, https://apps.fas.usda.gov/newgainapi/api/Report/DownloadReportByFileName?fileName=Grain%20and%20Feed%20Update_Mexico%20City_Mexico_MX2025-0003.pdf

    United States Department of Agriculture. (2025). World Agricultural Supply and Demand Estimates, January 10, 2025. Retrieved January 2025, from, https://www.usda.gov/oce/commodity/wasde/wasde0125.pdf

    Haigwood, W.S. (2025). Rice Seed Availability Tightens Even More for 2025. Retrieved February 3, 2025, from, https://www.farmprogress.com/rice/rice-seed-availability-tightens-for-2025


    Loy, Ryan. “Midsouth Rice Production and Trade Update for 2024/25.Southern Ag Today 5(7.3). February 12, 2025. Permalink

  • Increasing Size in Broilers – A Long-Term Trend

    Increasing Size in Broilers – A Long-Term Trend

    In a recent Southern Ag Today article, Anderson and Maples addressed increasing slaughter weights in beef cattle while also mentioning slaughter weights are increasing in swine and poultry. In this article, we will address poultry weights, specifically broilers.

    Broiler slaughter weight has been increasing, however, the reasons for the increase are different than was outlined in the referenced beef article.  The trend is a long-term situation rather than a short- or intermediate-term phenomenon. Broiler weights have been on a steady increase since the 1920s. The primary driver of these increases is market-derived; it is a slow change based on U.S. poultry consumers’ desire combined with the changing genetic potential of the birds. Unlike the beef industry, where the producers, feeders, and packers are usually separate entities, the poultry companies producing chicken own the chickens and control their genetics and production from the egg to chicken sandwich. 

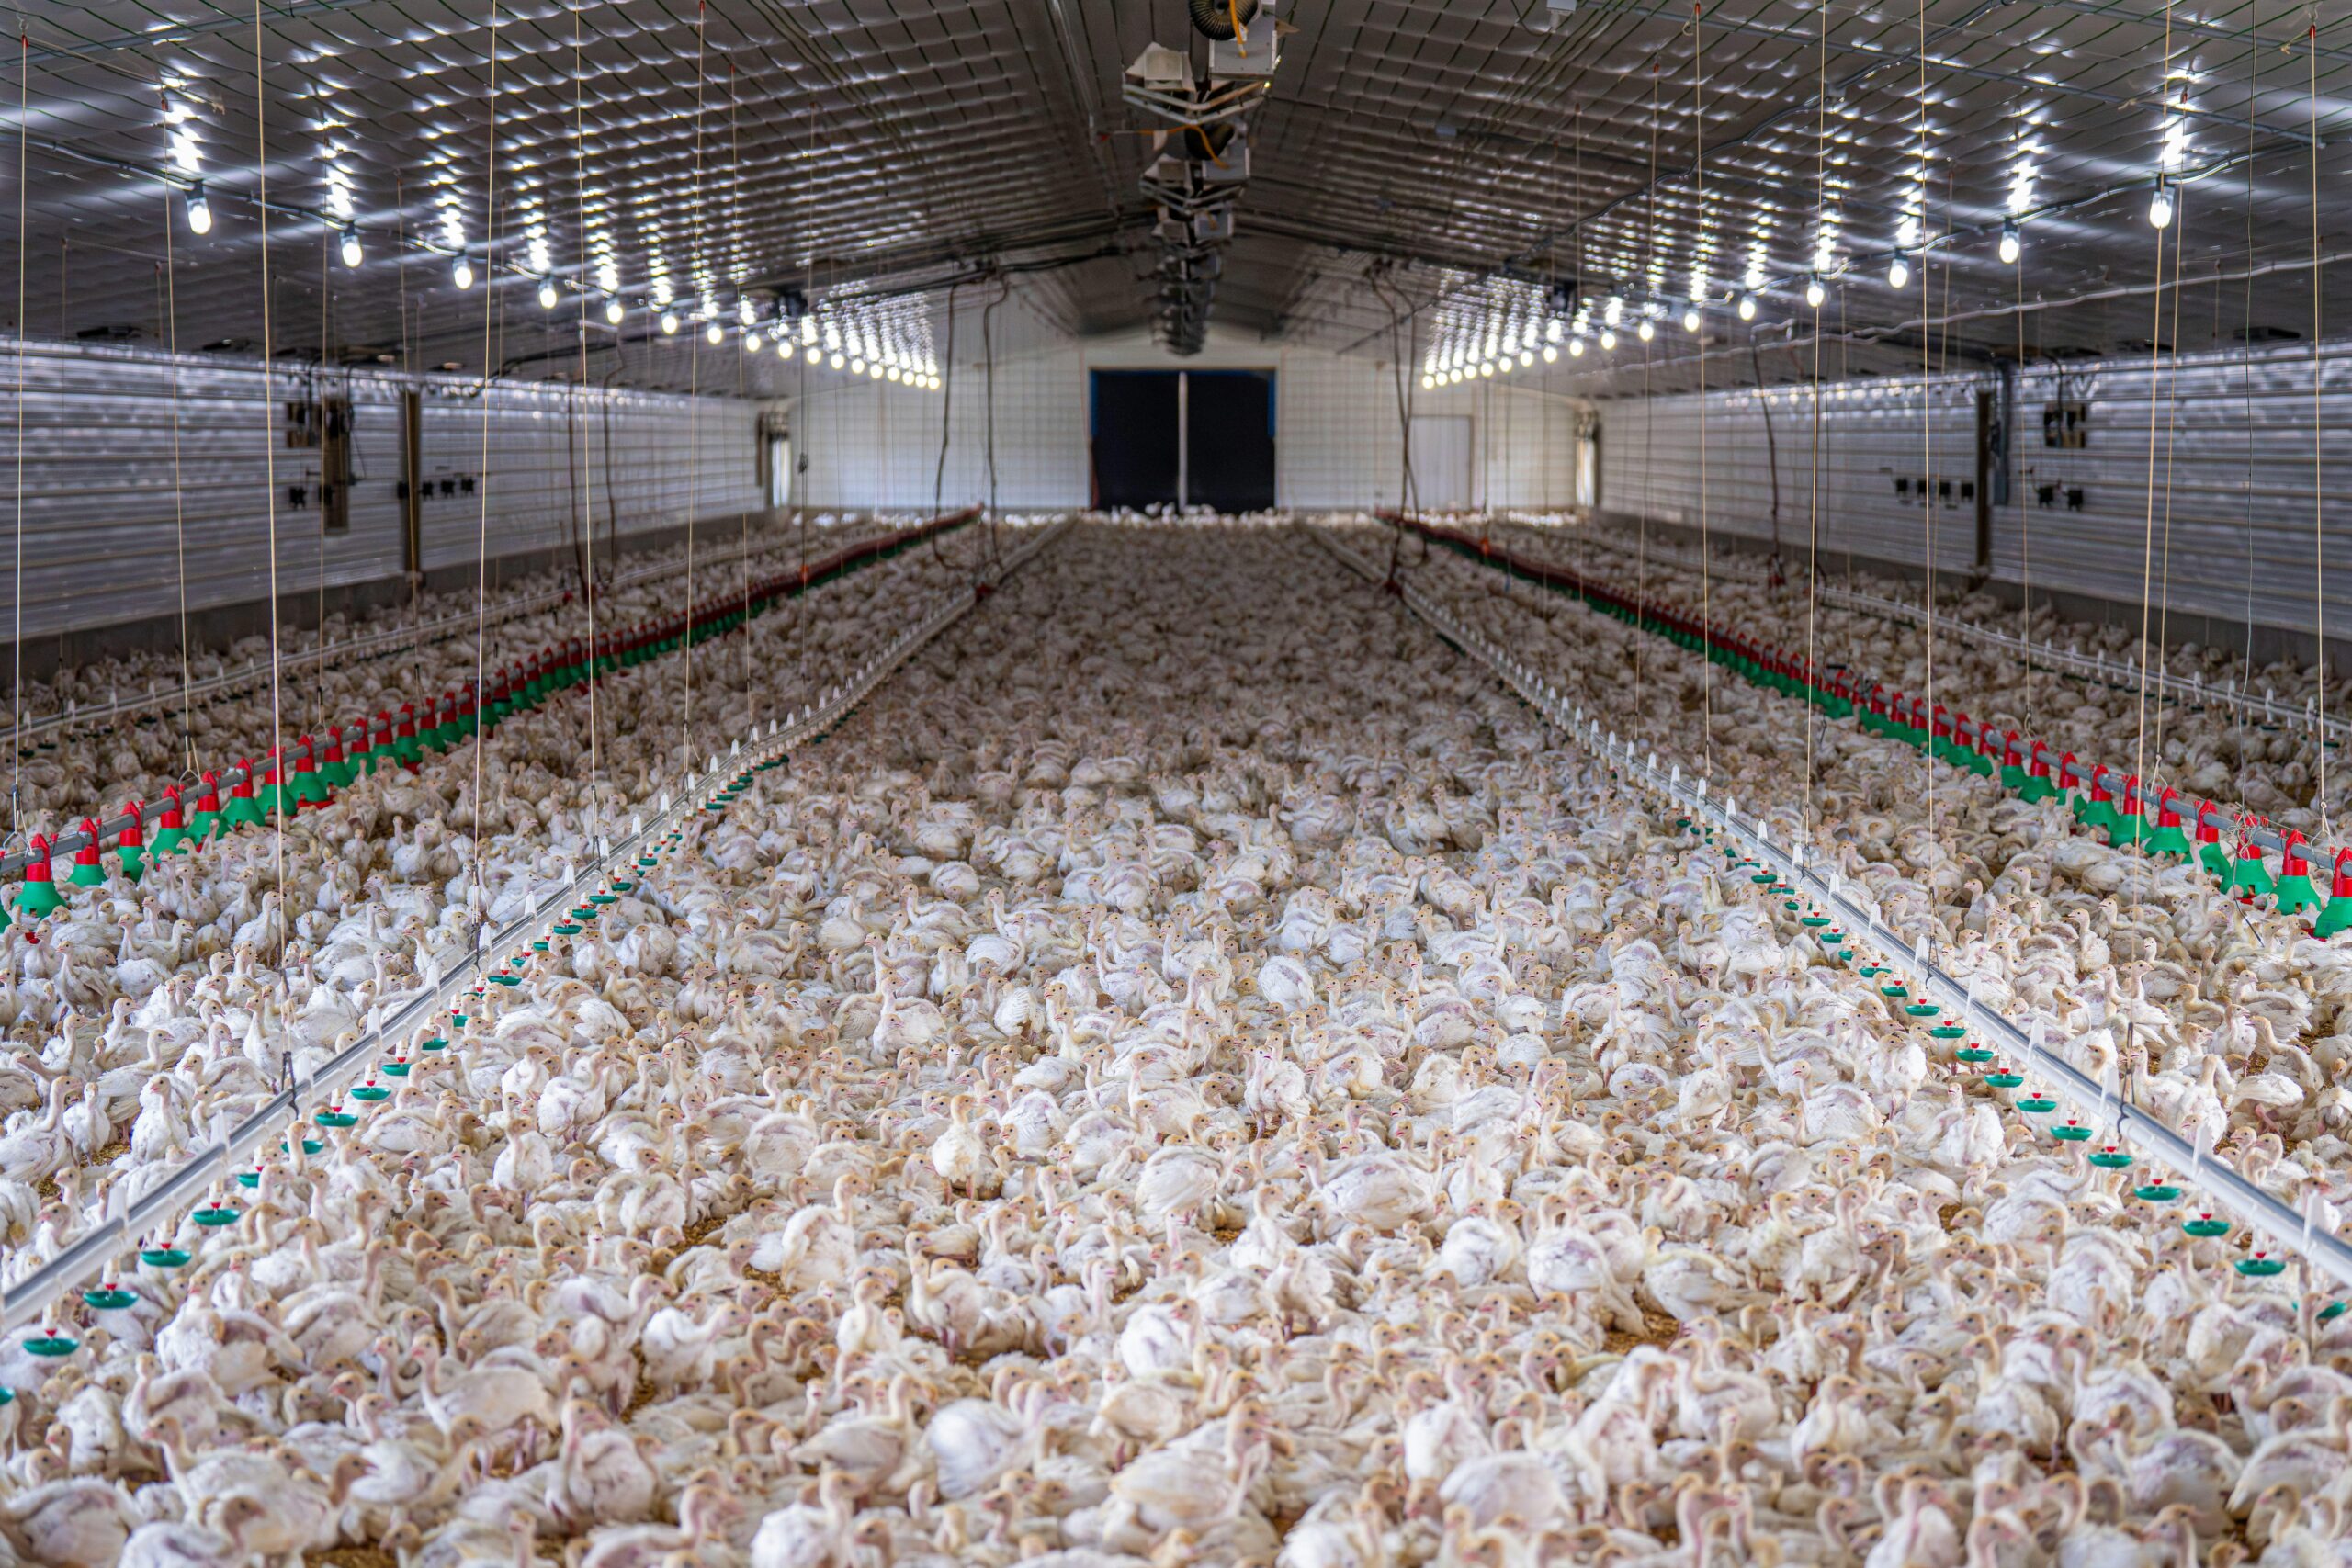
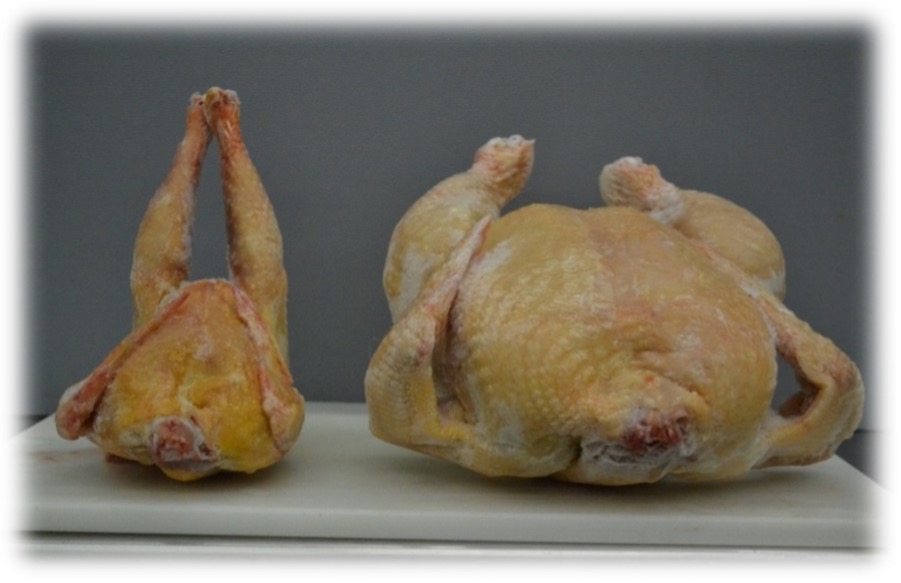
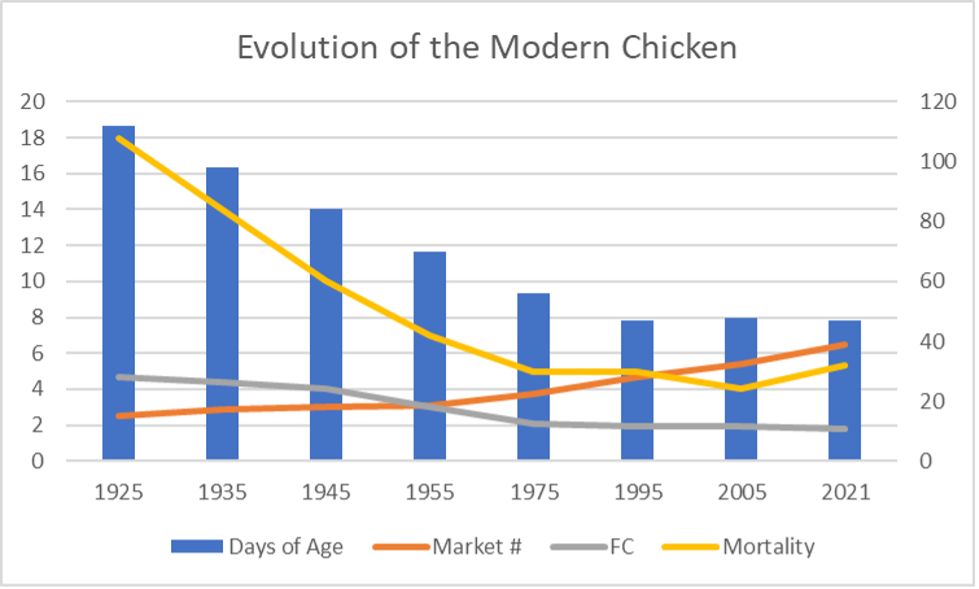
    Most chickens in the U.S. are produced to meet specific market demands, and this requires varying sizes of birds. Grocery store chill-packaged products like split breasts or boneless breasts usually come from birds in the 6– 7-pound range. Fast food chicken restaurants like Popeyes or KFC typically require smaller birds to fill their “pieces” menu. These birds are usually 3.5-to-4-pound slaughter weight. The same companies sell chicken sandwiches that require filets from larger birds of upwards to 9-pound slaughter weight. Frozen processed chicken fingers and sandwich filets at the grocery store are best produced from larger birds as well. As consumers have demanded more chicken sandwiches, chicken fingers, breast filets, etc., and fewer whole birds or cut-up pieces, poultry companies have moved their genetic target toward producing birds that more efficiently meet these demands per square foot of grow-out space. Simply put, you can get more chicken fingers per square foot of grow-out space from a bigger chicken. This demand has pushed companies to produce more of the larger birds and increase the size of the larger birds (Fig 1). Since companies own the chickens and control the genetics and production, they can make these changes in response to consumer trends quickly and sustain those changes over time. From 1955 to 2021, the combined average of all broiler sizes in the U.S. increased from 3 pounds to approximately 6.5 pounds, or 116%, in response to U.S. consumer demands. But that’s not the whole story. Along with increasing weights, the poultry industry has decreased the amount of feed needed by 38 percent, from 3.0 pounds to 1.85 pounds of feed per pound of gain. The time it takes to achieve average market weight has decreased by about 20 days. Overall mortality has also decreased, though recently a change in production methods has caused a slight uptick in mortality (Fig 2). All these changes have been achieved by foundational efforts in genetics, nutritional advances, and grow-out environment/housing improvements. Overall, this represents a case study in sustainability – producing more output with fewer inputs. In commercial poultry’s case, that means more chicken for less feed, over less time, with less environmental impact.  

    Fig 1. Broiler weights (bird size) have increased a remarkable amount from the 1950’s to the modern bird of today. These changes have been the result of focused genetics, improved nutrition and bird environment.

    (Source: Aviagen Inc.)

    Fig. 2: From 1955 to modern day, average broiler weights have increased by 116 percent. At the same time, feed conversion has improved by 38 percent. Days of age to slaughter have also decreased by 27 percent, and mortality by 21 percent.

    Lbs/Percent on the left and days on the right.
    (National Chicken Council data)

    Brothers, Dennis. “Increasing Size in Broilers – A Long-Term Trend.Southern Ag Today 5(7.2). February 11, 2025. Permalink

  • Calculating Equitable Crop Share Leases for Rice in the Mid-South

    Calculating Equitable Crop Share Leases for Rice in the Mid-South

    High input prices in recent years have significantly reduced profit margins for rice producers in the Mid-South. The negative impact of tightening profit margins is felt most acutely by rice producers renting cropland. A significant portion of rice ground in the region is rented using crop share arrangements, and the most common lease used is a net crop share lease. The terms of crop share leases differ by crop and region.  Typically for rice in the Mid-South, the landlord supplies the land and pays all below-ground irrigation expenses (well, pump, gearhead fixed expenses) in exchange for a share of the crop. The tenant pays all above-ground irrigation expenses (irrigation power unit fixed expenses, irrigation energy), supplies all machinery, and pays virtually all variable costs. The rice drying cost is the only variable cost shared between the two parties. Other crop share leases exist where specific costs like fertilizer are shared, but these lease types are less common than the net crop share lease. 

    Net crop shares are very similar throughout the Mid-South. In Eastern Arkansas, the landlord’s share of the rice crop is typically 25%, but 20% crop shares are also common (ASFMRA, 2024). In Northeastern Louisiana, the landlord’s share of the rice crop is typically 20%. Crop share leases are used less frequently in Northwestern Mississippi relative to cash leases, but when a crop share lease is used, the landlord’s share of the rice crop is also typically 20%. 

    Crop share arrangements tend to change little over time, but increasing crop prices, rising input costs, or new technologies make it occasionally necessary to reevaluate the equitability of crop share arrangements for both parties (NCFMEC, 2011). This article demonstrates the contributions approach as a method to calculate equitable crop and cost shares for rice rental leases. The first step is to calculate the percentage contribution provided by each party in value of non-shared expenses.  Remaining shared inputs and income are then shared in the same percentages as the collective non-shared contributions made by both parties. 

    Table 1 demonstrates how the contributions approach reflects the typical net crop share lease used in the Mid-South. In this example, the only cost item shared is drying costs. All other cost items are contributed solely by the landlord or the tenant. Total non-shared contributions equal $1,311, of which the landlord provides $250 (19.1%) and the tenant provides $1,061 (80.9%).  The assumption then would be that drying costs and crop income would appropriately be shared at the same 19.1 / 80.9 percentages, which approaches the 20% landlord, 80% tenant split seen in many net crop share leases in the Mid-South.

    Table 2 shows how the contributions approach may be applied to a crop share arrangement where several cost items are shared between the landlord and the tenant. In this table, the two parties share fertilizer, herbicide, and drying costs. The sharing of fertilizer and herbicide costs between the two parties is in accordance with the concept that yield-increasing inputs should be shared in the same percentage as the crop is shared (NCFMEC, 2011). An argument can be made that irrigation energy costs also fall into this yield-increasing input category. However, the cost of items to be shared or not shared in a crop share lease are based on negotiation between the tenant and the landlord. 

    Note in this example that the landlord’s share of the crop becomes larger when more cost items are shared between the two parties. This result occurs because the total proportion of contributions made by the landlord (particularly the land contribution but also irrigation wells) becomes larger when more costs are shared between the two parties. The equitable crop shares for each party, based on Table 2, are 24.5% of the gross returns for the landlord and 75.5% of the gross returns for the tenant.

    Table 1. Rice Net Crop Share Lease (Only Drying Expenses Shared)
     Cost Items  Annual Cost aLandlord ContributionTenant Contribution
    Non-Shared Items: $/acre 
    Land ($5,963/acre * 3.619%) b216216
    Machinery Fixed Expenses7979
    Machinery Repairs and Maintenance1818
    Irrigation Fixed Expenses (Well, Pump, Gearhead)3434
    Irrigation Fixed Expenses (Power Unit)2222
    Irrigation Repairs and Maintenance88
    Survey and Mark Levees55
    Labor5555
    Management (180 bu/ac * $6.75/bu * 7.5%) c9191
    Seed136136
    Fertilizer160160
    Herbicides130130
    Insecticide99
    Fungicide1010
    Fuel2020
    Irrigation Energy Costs129129
    Crop Insurance1010
    Scouting/Consultant Fee88
    Operating Interest3535
    Custom Machinery Hire8787
    Hauling4949
    Total Non-Shared Costs1,3112501,061
    Percent of Specified Costs100.00%19.1%80.9%
    Shared Items:$/acre
    Drying721458
    Total Shared Costs721458
    Total Shared and Non-Shared Costs1,3832641,120
    Percent of Specified Costs100.00%19.1%80.9%
    Gross Return (180 bu/ac * $6.75/bu)1,215232983
    Annual cost items except Land and Management are rice production costs averaged across 2024 University of Arkansas rice crop enterprise budgets.
    b The land charge is calculated as the average value for irrigated cropland in Eastern Arkansas reported in ASFMRA (2024) ($5,963/acre) multiplied by the rent-to-value ratio for irrigated cropland obtained from USDA NASS Arkansas (2024) ($152/acre cash rent divided by $4,200/acre for irrigated cropland).
    c The management charge is calculated as rice gross return multiplied by the mid-range of charges for professional farm managers (5 to 10%) reported in NCFMEC (2011).
    Table 2. Rice Cost Share Lease (Fertilizer, Herbicide, and Drying Costs Shared)
     Cost Items  Annual Cost aLandlord ContributionTenant Contribution
    Non-Shared Items: $/acre 
    Land ($5,963/acre * 3.619%) b216216
    Machinery Fixed Expenses7979
    Machinery Repairs and Maintenance1818
    Irrigation Fixed Expenses (Well, Pump, Gearhead)3434
    Irrigation Fixed Expenses (Power Unit)2222
    Irrigation Repairs and Maintenance88
    Survey and Mark Levees55
    Labor5555
    Management (180 bu/ac * $6.75/bu * 7.5%)9191
    Seed136136
    Insecticide99
    Fungicide1010
    Fuel2020
    Irrigation Energy Costs129129
    Crop Insurance1010
    Scouting/Consultant Fee88
    Operating Interest3535
    Custom Machinery Hire8787
    Hauling4949
    Total Non-Shared Costs1,021250771
    Percent of Specified Costs100.00%24.5%75.5%
    Shared Items:$/acre
    Fertilizer16039121
    Herbicides1303299
    Drying721854
    Total Shared Costs36289274
    Total Shared and Non-Shared Costs1,3833391,044
    Percent of Specified Costs100.00%24.5%75.5%
    Gross Return (180 bu/ac * $6.75/bu)1,215298917
    a Annual cost items except Land and Management are rice production costs averaged across 2024 University of Arkansas rice crop enterprise budgets.
    b The land charge is calculated as the average value for irrigated cropland in Eastern Arkansas reported in ASFMRA (2024) ($5,963/acre) multiplied by the rent-to-value ratio for irrigated cropland obtained from USDA NASS Arkansas (2024) ($152/acre cash rent divided by $4,200/acre for irrigated cropland).
    c The management charge is calculated as rice gross return multiplied by the mid-range of charges for professional farm managers (5 to 10%) reported in NCFMEC (2011).

    References and Resources

    ASFMRA (2024). 2024 Mid-South Land Values and Lease Trends Report. American Society of Farm Managers and Rural Appraisers, Mid-South Chapter. https://nationalaglawcenter.org/wp-content/uploads//assets/Conferences/2024-Mid-South-ASFMRA-Land-Values-and-Lease-Trends-Report.pdf

    NCFMEC (2011). Crop Share Rental Agreements for Your Farm. North Central Farm Management Extension Committee. NCFMEC-02. https://aglease101.org/wp-content/uploads/2020/10/NCFMEC-01.pdf

    USDA-NASS Arkansas (2024). United States Department of Agriculture, National Agricultural Statistics Service, Arkansas Field Office. https://www.nass.usda.gov/Statistics_by_State/Arkansas/index.php

    UTIA (2013). Crop-Share Leases. The University of Tennessee Institute of Agriculture. UT Extension PB 1816-E. https://utia.tennessee.edu/publications/wp-content/uploads/sites/269/2023/10/PB1816-C.pdf


    Watkins, Brad. “Calculating Equitable Crop Share Leases for Rice in the Mid-South.Southern Ag Today 5(7.1). February 10, 2025. Permalink