Blog

  • Evaluating the Cooperative Manager

    Evaluating the Cooperative Manager

    The annual evaluation of the general manager is a clear duty of a cooperative board of directors. It’s a very important task. An evaluation of the general manager is an opportunity to revisit the direction and performance of the cooperative. When done correctly, the evaluation process will strengthen ties between board and manager and align management with board objectives. Here are three recommendations for improving the manager evaluations at your cooperative.

    1. Evaluate What Matters Most

    One challenge of manager evaluation is that potentially, there is a lot to evaluate. Further, some of the manager’s duties might be hard to evaluate or observe. If you choose criteria based on the functions of management, you might develop a list like this:

    Planning

    • Actively and accurately assesses competitive forces
    • Makes timely adjustments to the changing business environment
    • Helps to craft a successful strategic approach
    • Develops and implements effective timelines and goals
    • Budgets for current and future operating needs
    • Ensures cooperative resources are available and ready for customer use

    Organizing

    • Effectively hires and trains high-quality employees
    • Assigns resources to their best use
    • Delegates managerial duties effectively
    • Plans and accommodates organizational growth

    Leading

    • Motivates employees toward excellence
    • Cultivates board relations
    • Communicates with members
    • Promotes the company vision
    • Mentors and grooms future managers

    Controlling

    • Reports financial results in a clear and timely manner
    • Monitors cooperative performance
    • Appropriately adjusts budgets throughout the year
    • Makes staffing changes when needed
    • Conducts employee evaluations and gathers employee feedback

    Further, you can consider the manners in which the manager conducts their self. The manager’s personal skills, attributes, and competencies might also be important. Additional criteria might include the following:

    Interpersonal

    • Communication Skills
    • Listening
    • Empathy
    • Emotional Intelligence
    • Working with Others
    • LeadershipMentoring
    • Friendliness
    • Technical
    • Industrial Knowledge 
    • Marketing
    • Equipment Operations
    • Software Knowledge

    Conceptual

    • Abstract Thinking
    • Problem Solving
    • Adaptability
    • Analysis
    • Diagnosing Problems
    • Forecasting and Predictions
    • Decision-making

    One solution to organizing all these potential criteria is to consider the stewardships of the manager. Every cooperative manager has responsibilities toward the operations of the cooperative, the board, and the members. To help further, consider if your evaluation criteria are focused on the mission of the cooperative. In doing this, better questions begin to emerge:

    Cooperative

    1. Recruits, trains, and retains quality employees. 
    2. Maintains and protects the functionality of cooperative assets.
    3. Demonstrates result-driven use of cooperative funds.
    4. Focuses on cooperative mission.

    Board

    1. Provides frequent and thorough reports of cooperative financial condition.
    2. Communicates market opportunities and risks in a timely manner.
    3. Interprets market conditions affecting financial performance.
    4. Informs board of potential legal threats and conflicts of interest.

    Members

    1. Actively recruits new membership.
    2. Is knowledgeable of individual members and seeks their input.
    3. Promotes the mission of the cooperative to members.
    4. Is focused on customer service.

    2. Include Professional Development

    Don’t forget that the manager is also a valuable asset to the cooperative. Your evaluation might include goals for self-improvement of leadership skills or industry knowledge.  The manager might self identify some of these goals as well as other relevant criteria for the cooperative, board, and members. Questions might include:

    Manager

    1. Mentors employees for future leadership.
    2. Exemplifies integrity for the cooperative.
    3. Listens to member-owner concerns.
    4. Analyzes cooperative performance and suggests needed corrections.

    3. Give Evaluation the Time it Deserves

    Successful manager evaluation is not an annual event – it is a year-long process. When your board approach to manager evaluation is to invite the manager in to award a bonus, or take them to lunch, or any other solitary event, you are failing to protect the cooperative. Proper evaluation starts immediately following the prior evaluation by establishing the evaluation criteria for the coming year. This is to be agreed upon by board and manager. Monthly board meetings should take time to revisit and assess the evaluation, noting evidence of performance. Executive sessions are useful times to briefly discuss management performance and discuss any needed adjustments to evaluation criteria, or management actions. At the end of the year, the board chair can ask for an evaluation from each board member and the manager.  Doing this will help to elevate the annual evaluation to a constructive process for both cooperative and manager. 


    Park, John. “Evaluating the Cooperative Manager.Southern Ag Today 5(5.5). January 31, 2025. Permalink
  • Why the Current Economic Downturn is So Troublesome

    Why the Current Economic Downturn is So Troublesome

    The current outlook for the major row crops in the U.S. is pretty dismal.  The Agricultural and Food Policy Center (AFPC) at Texas A&M University has been working with farmers across the country since 1983 to develop representative farms in major production regions.  Currently, AFPC maintains the data to analyze 92 crop (64) and livestock (28) operations in 30 states (Figure 1). From the beginning, the representative farms have been utilized to conduct “what if” policy analyses for the House and Senate agricultural committees to help craft agricultural legislation.  Another use of the farms is to provide policymakers with an early warning system or agricultural barometer under current policy conditions.  AFPC has partnered with and uses price projections from the Food and Agricultural Policy Research Institute (FAPRI) at the University of Missouri to project the financial wellbeing of the representative farms.

    In the 42 years that AFPC has been projecting farm financial performance, the most recent crop outlook for the representative farms is the worst in terms of the number of farms in each of the four commodity types (feed grains, cotton, rice and wheat) that are not currently expected to have a positive cash flow over the next 5 years.  What makes this so troublesome is there is not a crop that producers can switch to from their current crops that would generate a positive return.  In other downturns, we would see producers that can grow several types of crops taking market signals and moving to more profitable crops.  Part of developing representative farms is collecting all of the cost information for the farms.  This makes it possible to develop cost of production data for each of the crops being produced on the 64 representative crop farms.  The bottom line is very few of the representative farms appear to have profitable crops on them at prices that are projected by FAPRI for the 2025/26 marketing year – which is very troublesome.  While the economic and natural disaster assistance provided in the recent American Relief Act of 2025 will help in the near term, the need for a significant enhancement to the farm safety net over the next 5 years is imperative… and the sooner the better.

    Figure 1.  AFPC Representative Crop and Livestock Farms.


    Outlaw, Joe L., and Bart L. Fischer. “Why the Current Economic Downturn is So Troublesome.Southern Ag Today 5(5.4). January 30, 2025. Permalink

  • Flat Global Demand and Increased Brazil Production Provide Challenges for U.S. Cotton Prices

    Flat Global Demand and Increased Brazil Production Provide Challenges for U.S. Cotton Prices

    Cotton futures prices have struggled to gain traction over the past six months. The last time nearby cotton futures were above 75 cents was June 28, 2024. Since July, nearby cotton futures prices have traded mostly between 66 and 73 cents. New crop (December 2025) futures prices are currently below 70 cents, which will not provide attractive pricing opportunities for cotton producers. Additionally, if new crop futures prices remain low through the crop insurance price determination period, the safety net will be diminished and will likely result in decreased planted acres in the United States. Global supply and demand have played a role in low cotton prices. Figures 1 and 2 show global cotton demand and Brazil cotton production which have contributed to lower cotton prices. 

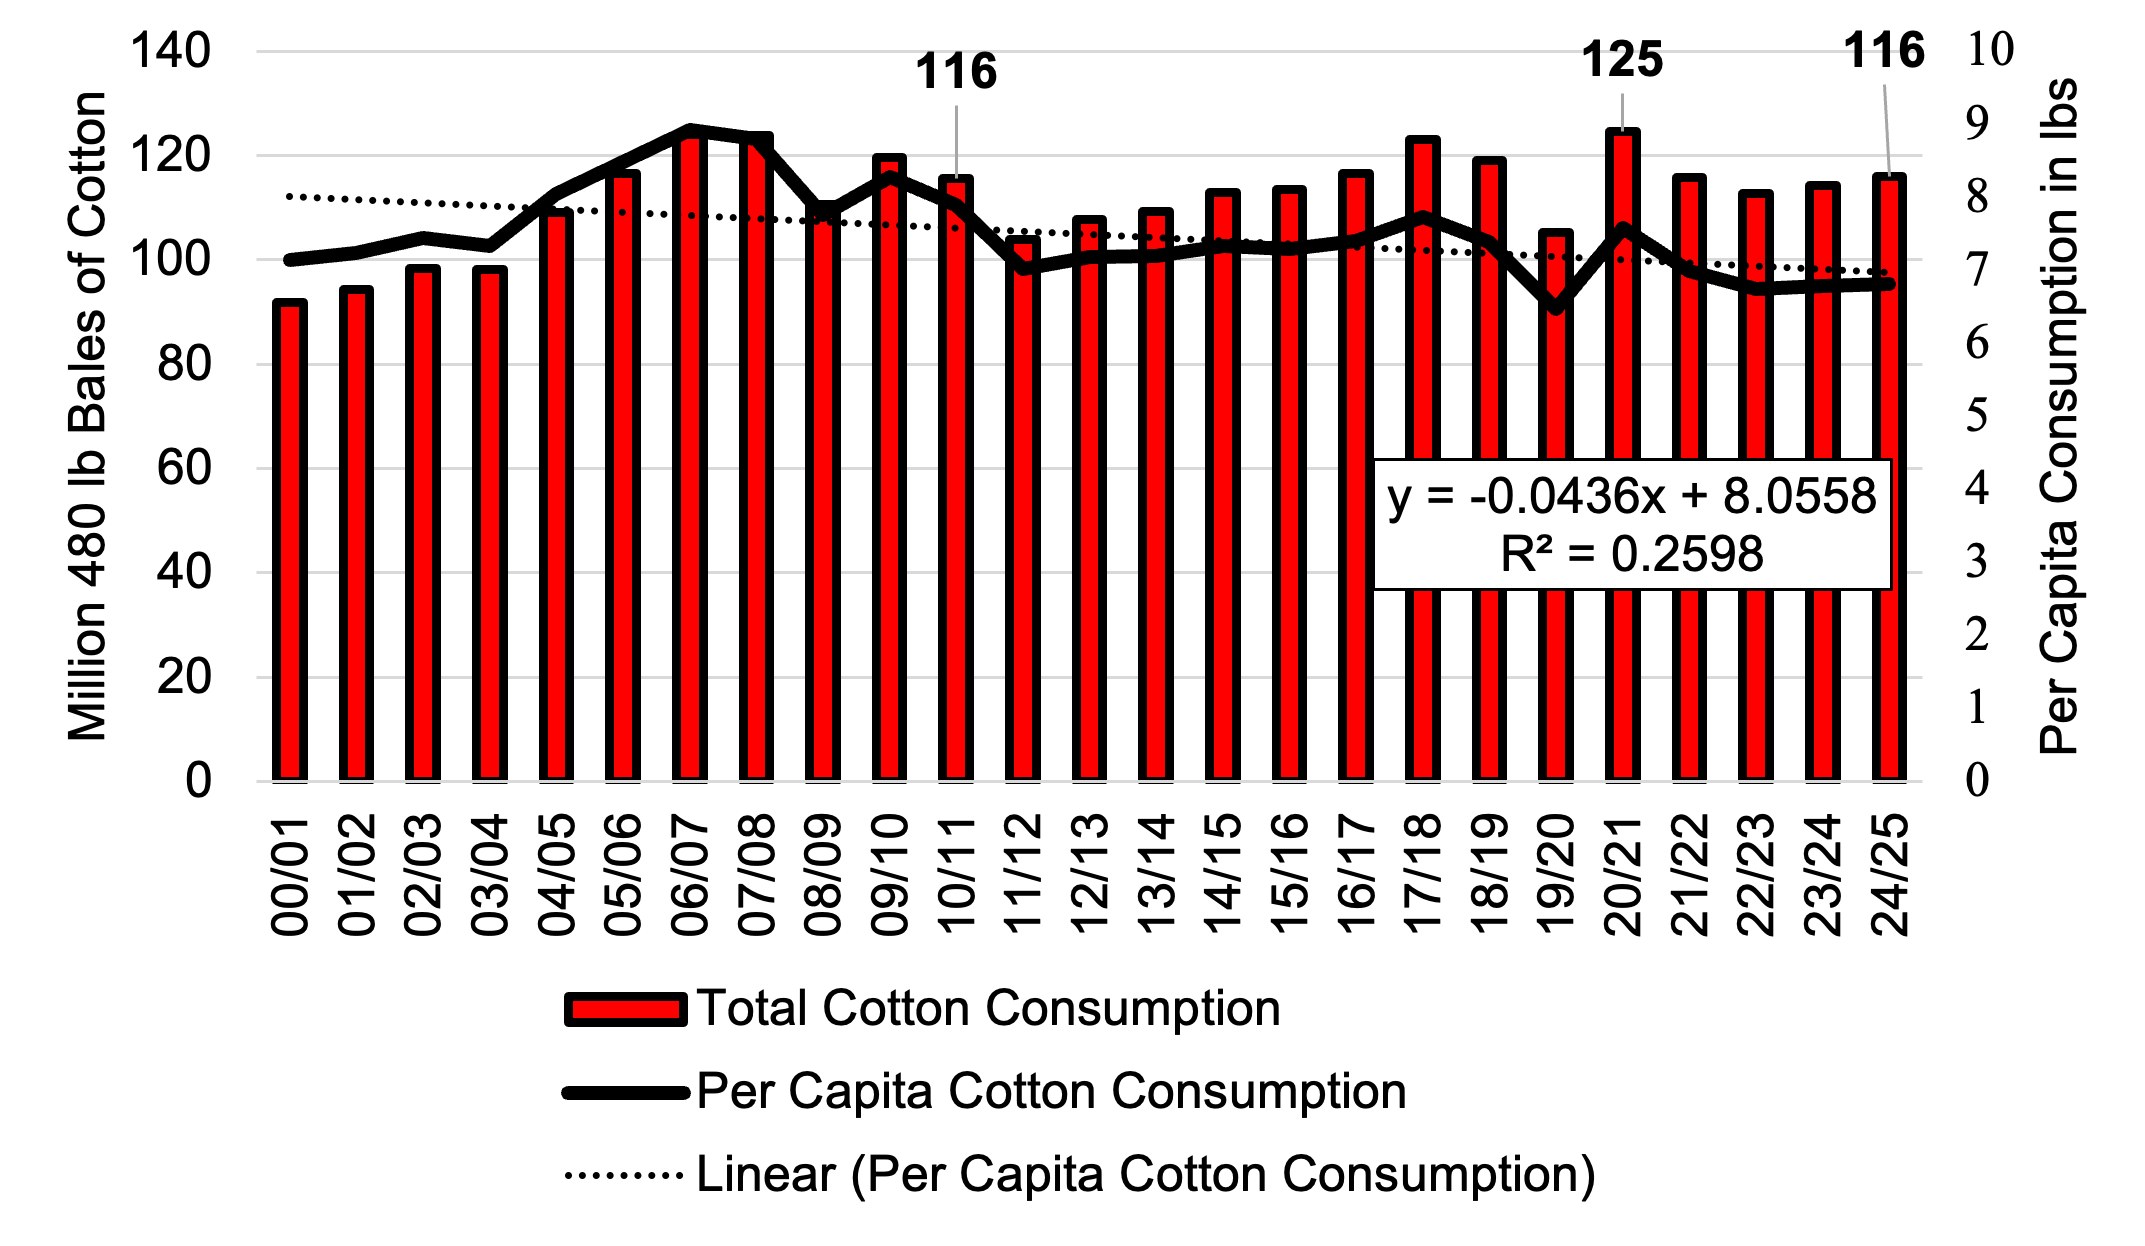
    Global cotton demand has been flat for more than two decades and per capita cotton consumption has trended lower (Figure 1). Projected global cotton consumption for the 2024/25 marketing year is 116 million 480 lb bales, the same as 2010/2011. Competition with synthetic fibers has resulted in a lower market share for cotton and reduced demand. Improved demand will be essential if cotton prices are to improve. 

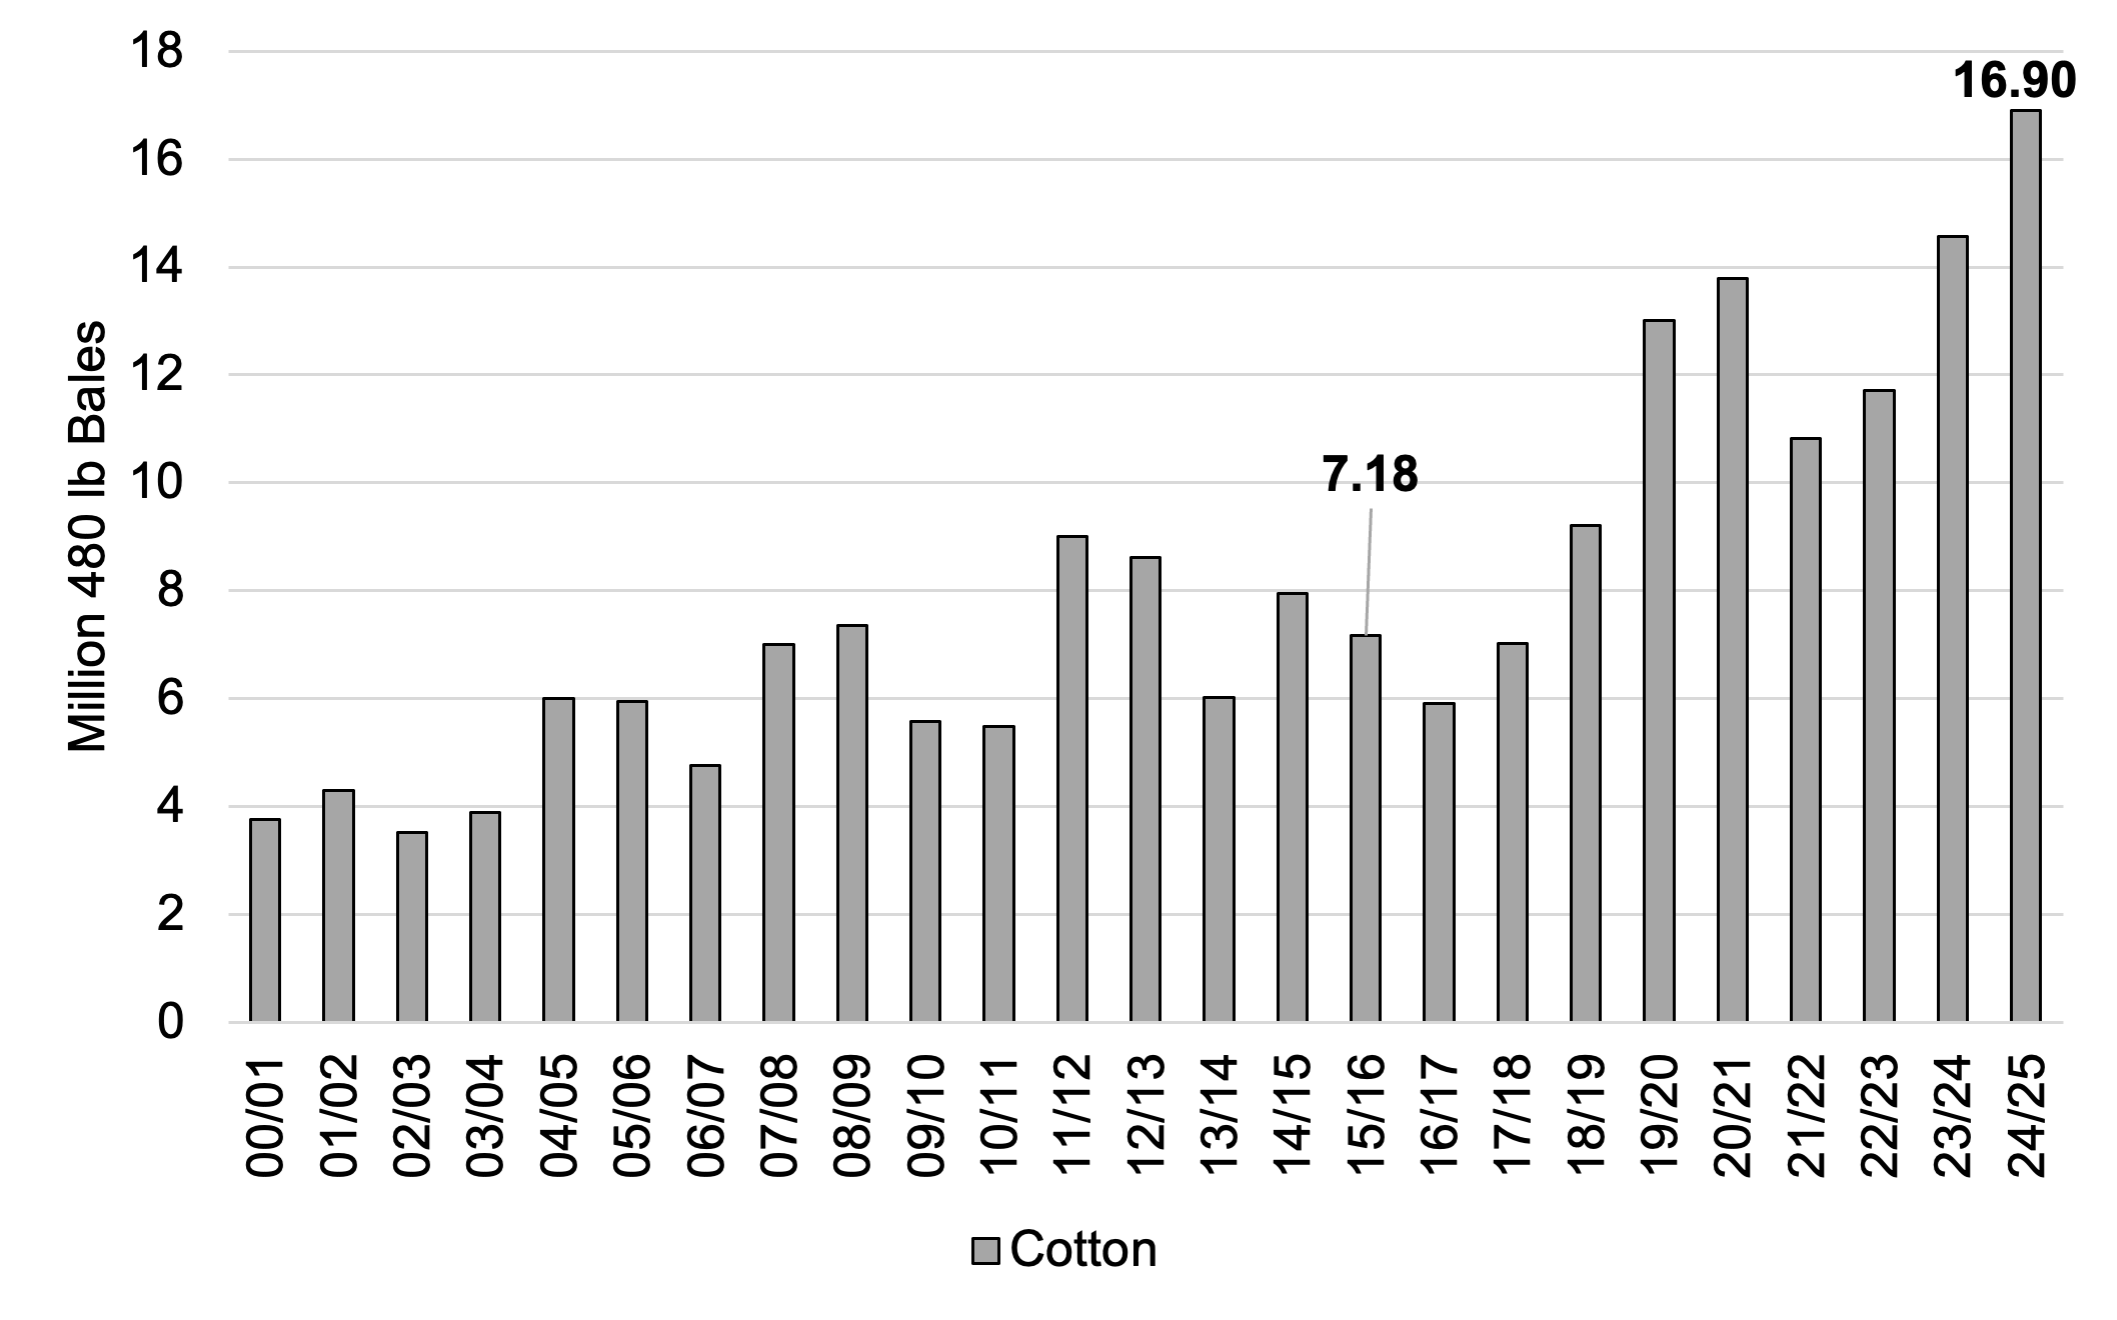
    Compounding the challenges for U.S. cotton producers has been the rise of Brazil. In the last ten years, Brazil has more than doubled cotton production from 7.18 million 480 lb bales to 16.9 million 480 lb bales (Figure 2). The rise of Brazil cotton production has provided substantial competition for export markets. The combination of increased cotton production and flat global demand will continue to weigh on global cotton prices. 

    Figure 1. Global Cotton Consumption and Per Capita Consumption, 2000/01-2024/25

    Figure 2. Brazil Cotton Production, 2000/01-2024/25

    References

    USDA Foreign Agricultural Service (FAS), Production Supply and Distribution. Accessed at:https://apps.fas.usda.gov/psdonline/app/index.html#/app/home

    Barchart.com. Nearby Cotton Futures Contract. Accessed at: https://www.barchart.com/futures/quotes/CTH25/interactive-chart


    Smith, Aaron. “Flat Global Demand and Increased Brazil Production Provide Challenges for U.S. Cotton Prices.Southern Ag Today 5(5.3). January 29, 2025. Permalink

  • Placements Lower Than Expected in January Cattle-On-Feed Report

    Placements Lower Than Expected in January Cattle-On-Feed Report

    The January Cattle on Feed report was released on Friday afternoon. Total on-feed inventory to start the year was estimated at a little over 11.8 million head, which is down by just under 1% from January of 2024. Even though feeder cattle supplies have been lower, feedlot inventories ran above year-ago levels for eight of twelve months in 2024 as lower feed prices encouraged longer feeding times. While I don’t want to read too much into it, this was the largest year-over-year decline since May.

    Placements were once again the headliner of the report as they came in below, and outside the range of pre-report estimates. December 2024 placements were estimated at 1.64 million, which was 3.3% below December 2023. On the surface, this seemed logical as December represented a full month of not receiving live cattle imports from Mexico. This also marked the second month in a row with placement levels being more than 3% below year-ago.

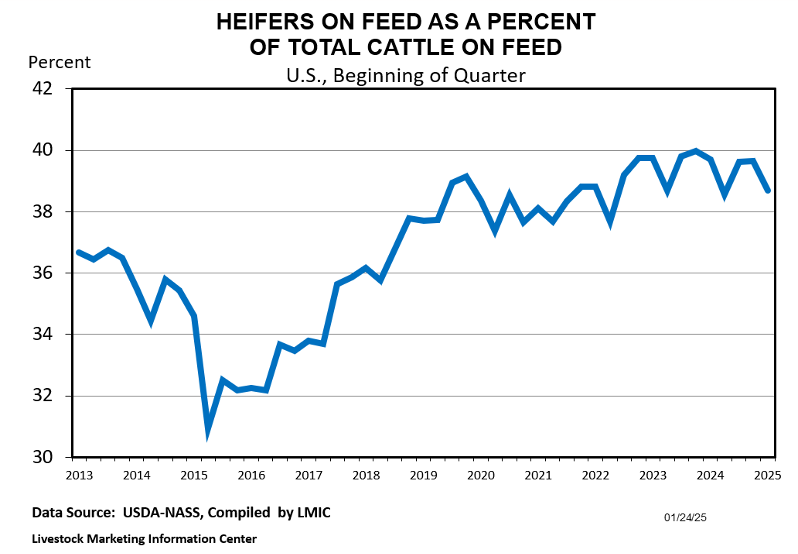
    Friday’s report was also a quarterly cattle-on-feed report, which means it included an estimate of the steer/heifer breakdown. In the absence of a July cattle inventory report, this has been one of the main indicators economists have been tracking for evidence of heifer retention. Heifers accounted for 38.7% of the total on-feed inventory on January 1, 2025. While this doesn’t speak to retention, it is worth noting that this is about 1% lower than last January and 1% lower than October 2024. So, it does bear watching as we move further into 2025. Again, I think imports from Mexico had some impact here as heifers had represented a higher than usual share of imports prior to the ban in late November.

    Last week’s cattle on feed report will be overshadowed later this week as USDA-NASS will release their annual inventory estimates on the afternoon of January 31st. While beef cow slaughter was down sharply for 2024, most are still expecting continued decreases in beef cattle numbers at the national level. It will be interesting to see the state-by-state numbers and specifically to look at areas where heifer retention may have already begun. Given the favorable price outlook for calves, I think heifer retention is very possible in 2025 if weather is cooperative. But I also think this will be a relatively slow cow-herd expansion once retention does begin.


    Burdine, Kenny. “Placements Lower Than Expected in January Cattle-On-Feed Report.Southern Ag Today 5(5.2). January 28, 2025. Permalink

  • Short-term Heating Fuel Decisions Facing Commercial Poultry Growers 

    Short-term Heating Fuel Decisions Facing Commercial Poultry Growers 

    It is the heart of the winter in the southeastern broiler belt. January and February are typically the coldest, but March often comes in like a lion, bringing plenty of cold with it, too. Commercial poultry growers have embraced the risk management strategy of pre-buying or contract “booking” propane ahead to secure the lowest prices possible each year. But by the end of the season, it is not unheard of for growers to run out of pre-purchased or contracted allotments and be left subject to late-season cash market price fluctuations or potentially purchasing additional contract allotments at increased prices. This can leave growers wondering which option is best to end the season. There are several things to consider.

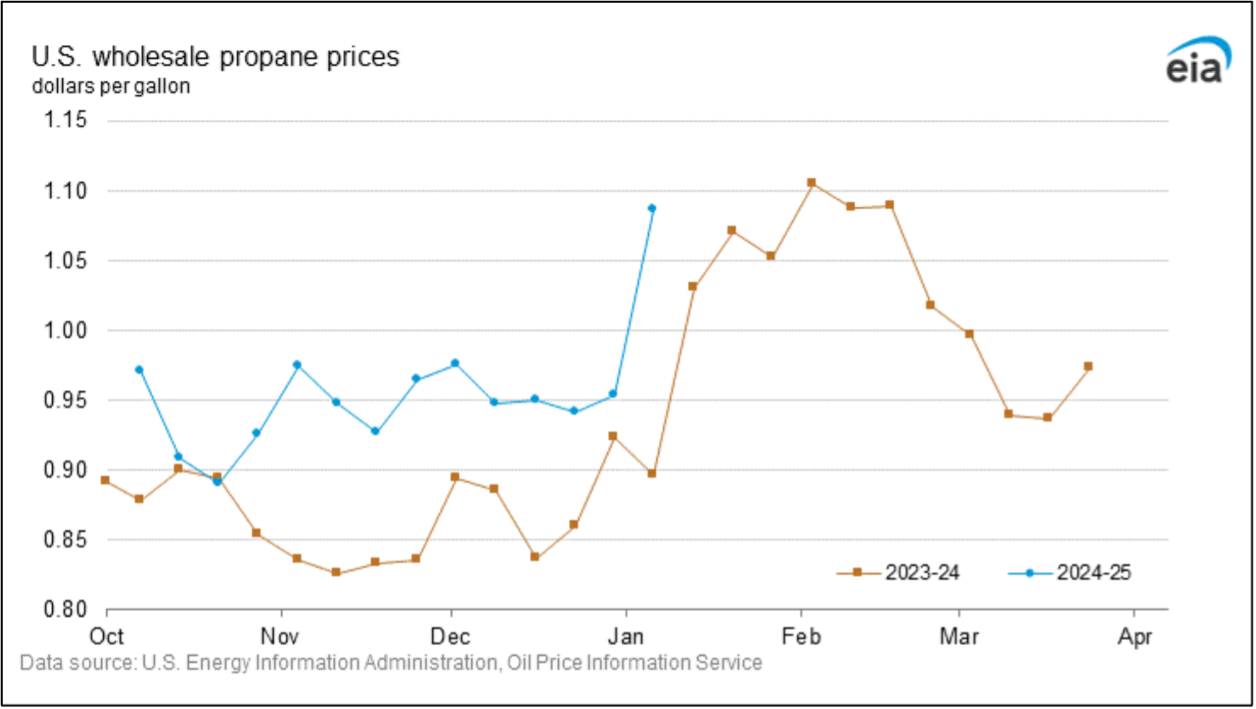
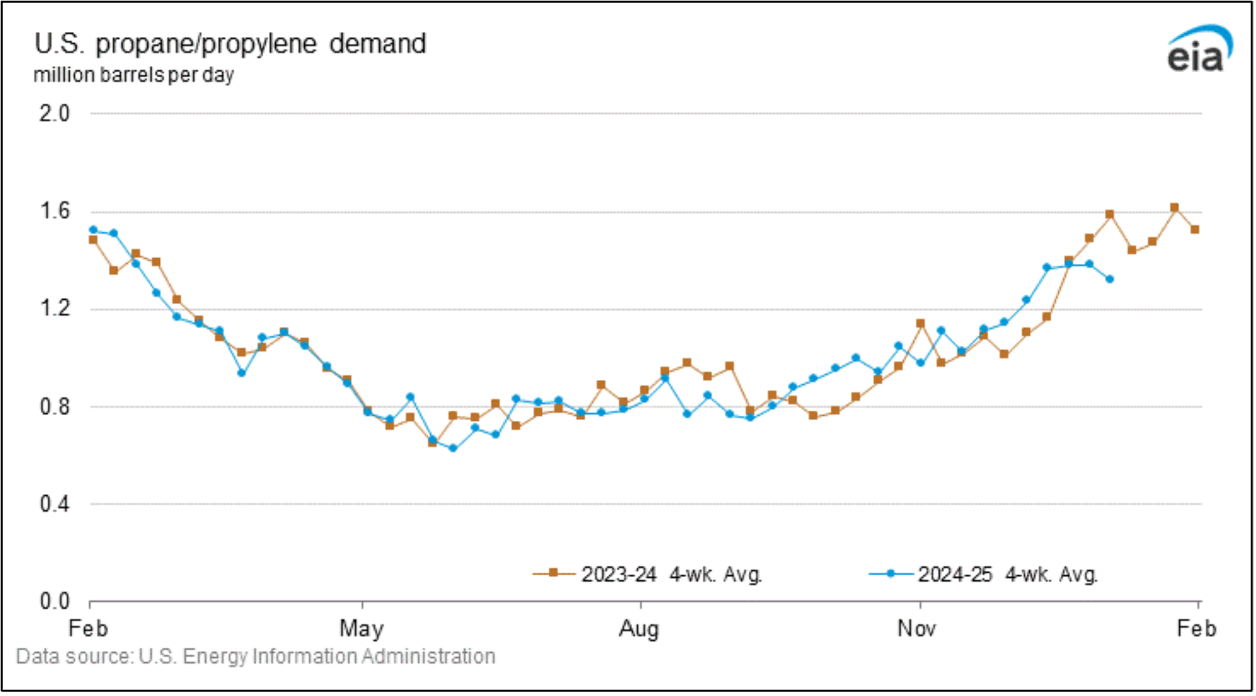
    U.S. propane prices are certainly affected by local markets, but the wholesale component for those prices is still impacted by international supply and demand pressure on crude oil. It seems the current world economy is slowing, especially the Chinese economy, potentially signaling a decreased demand for oil. Less oil production usually means less propane production/supply, supporting a higher price. This could be somewhat offset by increased war demands on petroleum production. Locally, Gulf Coast propane supplies are hovering at the top of the five-year average (Fig. 1). However, wholesale prices are about 20% higher than at the same time last year (Fig 2). Gulf Coast propane production has been steady while overall demand for LP is down currently compared to last year (Fig 3), suggesting lower prices may be on the horizon. What does this mean for the commercial poultry grower reaching the end of his contract allotment? Local market dynamics will likely affect prices more than international supply and demand dynamics for the remainder of winter. If the weather forecast suggests a milder end to winter, it may be prudent to end the season on the cash market as needed, expecting local prices to decrease going into spring rather than signing a late-season contract. Then, wait for the summer booking to prepare for winter 2025-26. However, if a grower can contract additional LP booked for close to their previous contract price, it is usually a good risk management decision to do so. It’s up to the grower to decide when that difference warrants taking the risk. 

    Natural gas users are typically tied to the current cash price for gas as it is delivered at the meter. Local (U.S.) supply and demand are the primary drivers of NG prices for U.S. consumers, which is greatly affected by weather. Although the South Atlantic region has thus far experienced 59 fewer Heating Degree Days than normal, 26 fewer than last year,temperatures are beginning to fall, leading to local NG prices increasing across the region and nationally. Current US-EIA data shows a 4.7% increase in NG prices for the southern region, with the Henry Hub wholesale price (southeastern source for NG) rising $0.37/MMBtu the week of January 13, 2025 (Fig 4).  All of this seems to indicate a rising price for commercial natural gas users for the remainder of this winter season. 

    As always, it’s never too late to tighten up the leaks and shore up the insulation in the poultry houses. A little savings can go a long way in an increasing fuel price market. 

    Fig. 1 – Gulf Coast region LP supply is near the high 5-year average (U.S EIA). 

    Fig. 2 – Wholesale LP prices are approximately 20% higher than this time last year.

    Fig. 3 – LP demand is down slightly compared to last year, suggesting lower prices may be on the horizon. 

    Fig 4. – NG prices at the Henry Hub (southeastern source) are trending higher at the end of the season, mainly due to decreasing temperatures in the region. 


    Brothers, Dennis. “Short-term Heating Fuel Decisions Facing Commercial Poultry Growers.” Southern Ag Today 5(5.1). January 27, 2025. Permalink