Blog

  • Proposition 12 Preliminary Price Impacts

    Proposition 12 Preliminary Price Impacts

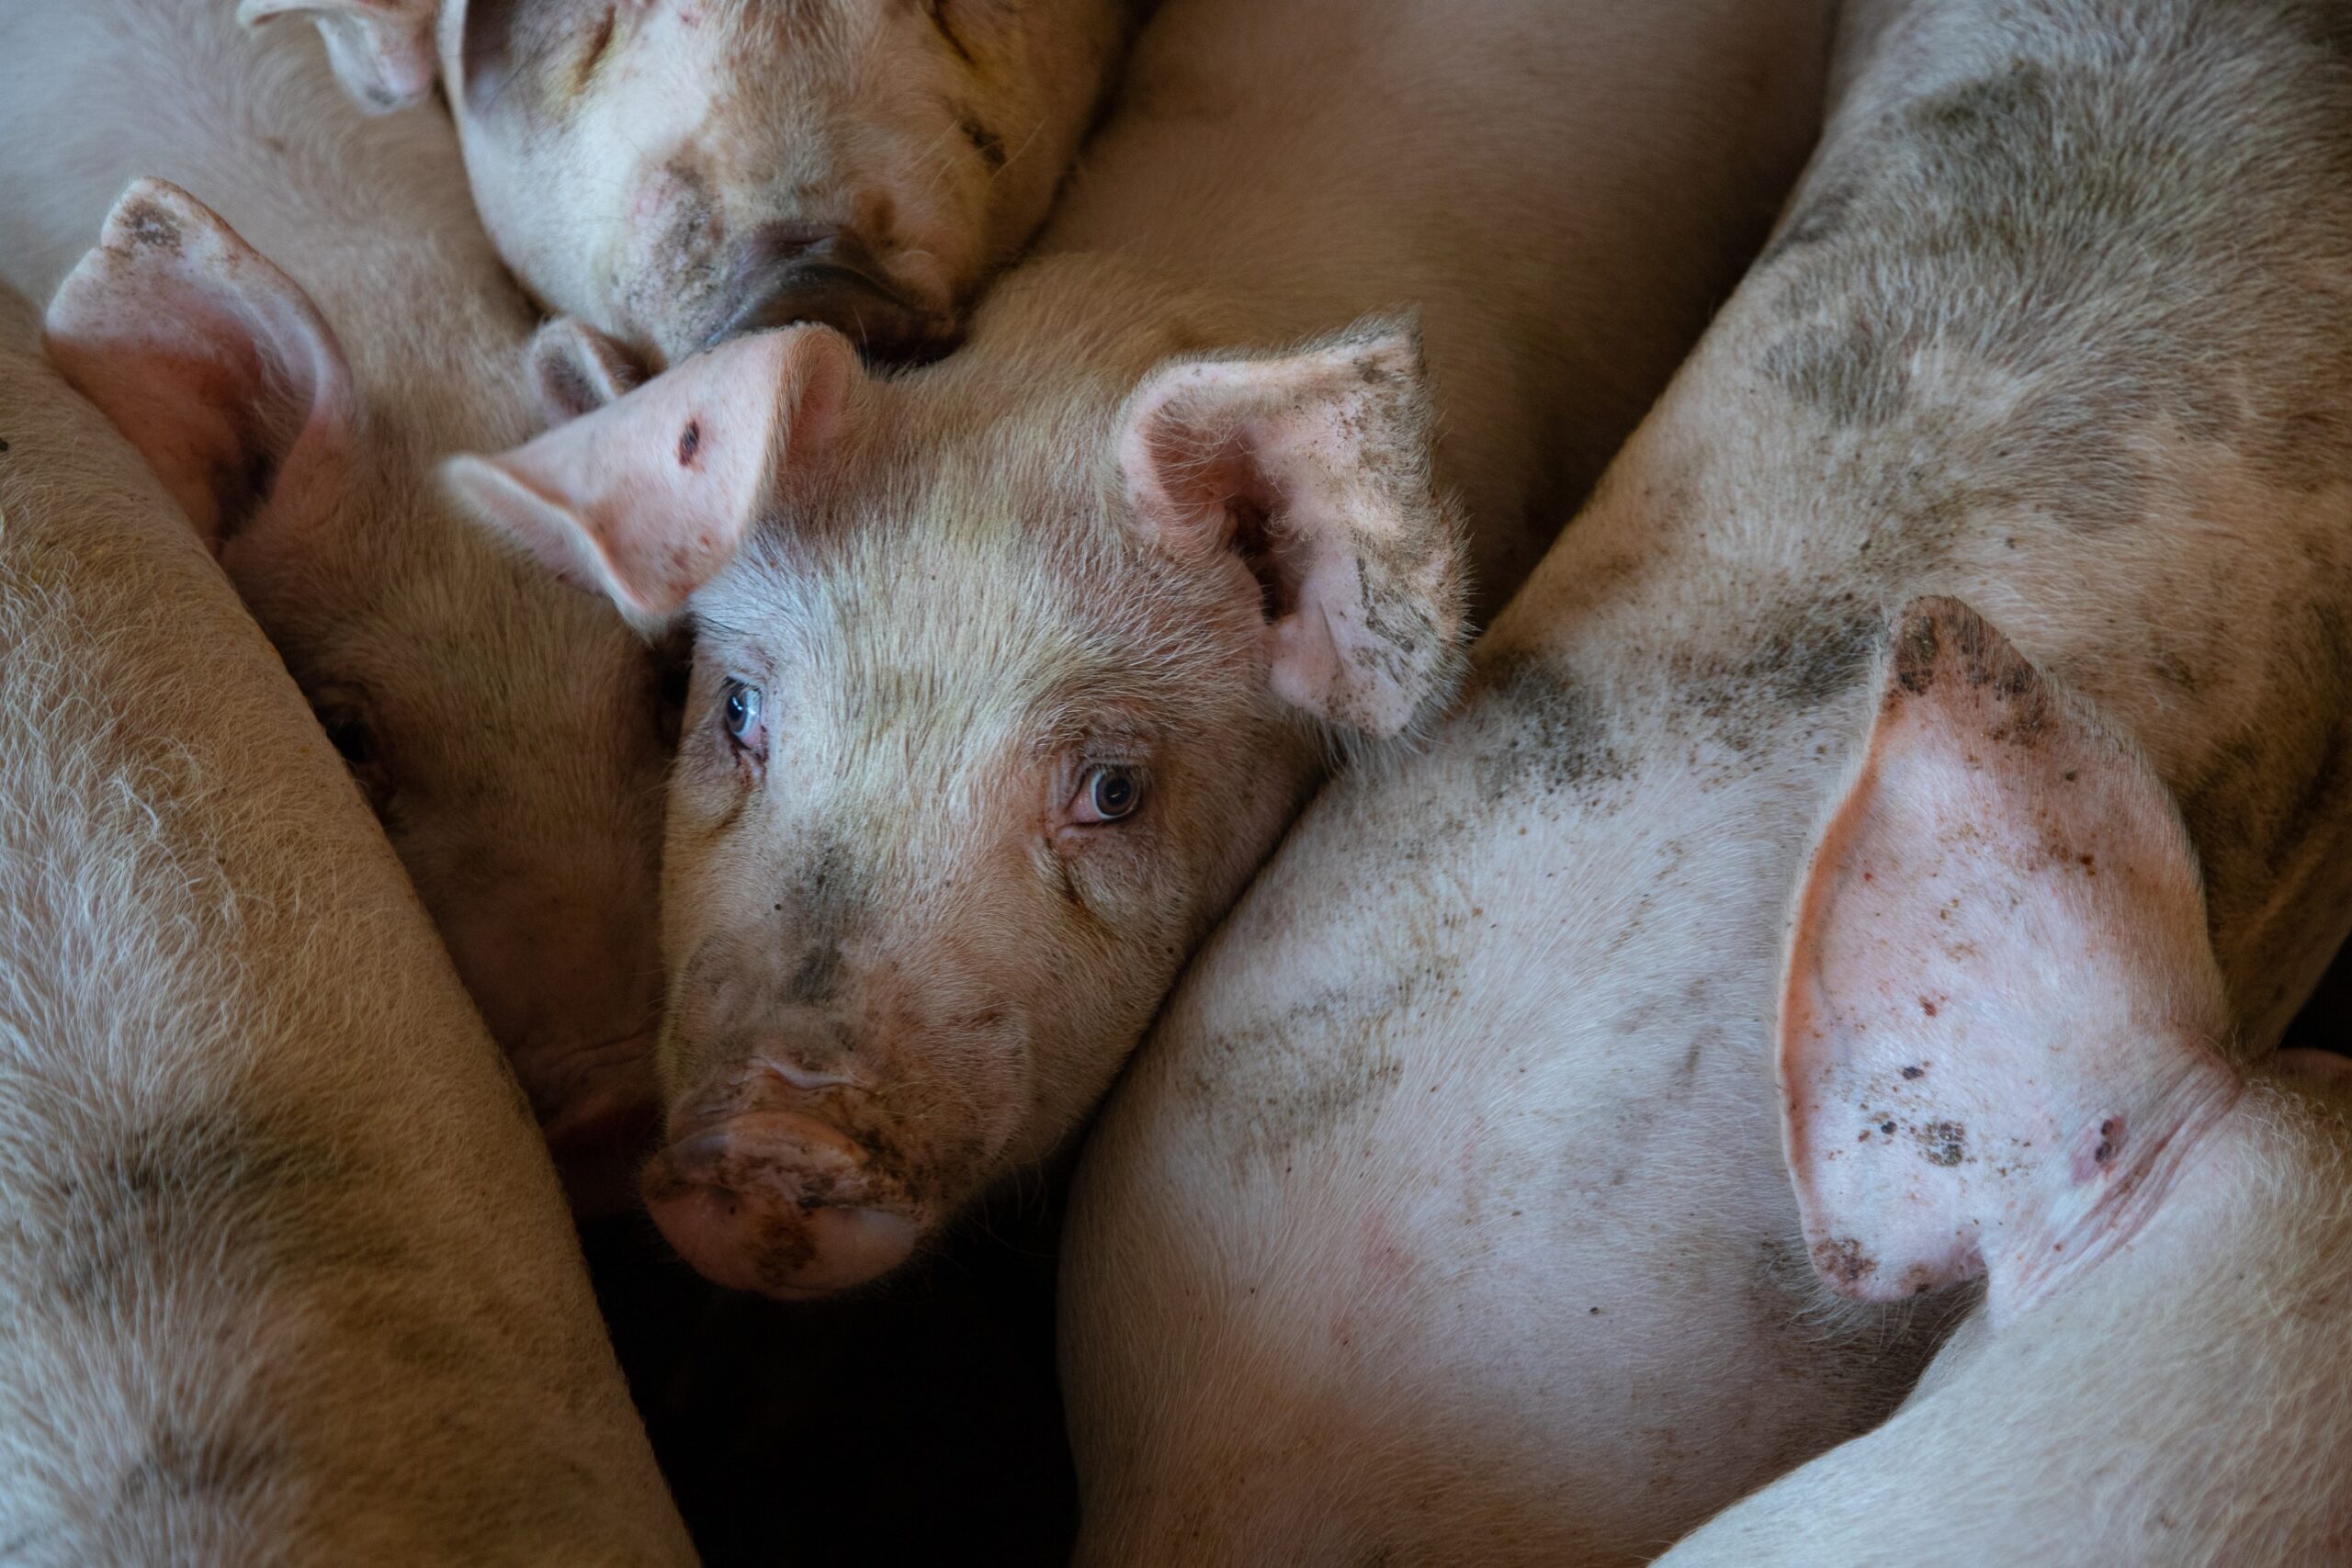
    On July 1st, 2023, California’s Proposition 12, which sets production standards for pork sold in California, officially came into effect. This animal welfare law requires that all uncooked pork sold in California comes from the offspring of sows that are kept in pens with at least 24 square ft. of space.  California accounts for approximately 14% of U.S. pork consumption but less than 2% of pork production, leaving producers and processors in major hog producing states, such as those in the Plains, Corn Belt, and North Carolina, to decide if it is economically viable to meet Prop 12 requirements and continue to supply the California market. A Sacramento County court order extended the time for non-compliant pork that was in the supply chain before July 1st to continue to be sold in the California market until December 31st, 2023. This modification was expected to help mitigate any supply chain disruptions or price spikes. 

    Nevertheless, early indications from Circana retail-level scanner data reveal signs of strain in California markets after July 1st. Pork prices have surged, expenditures are down—a classic symptom of a supply shock.  For example, pork ribs and pork loin, the top two consumed fresh pork* products in California, have witnessed substantial price hikes by the end of July. The average sales price of pork ribs and loins were 25% and 43% higher, respectively, in California, in August, compared to June. In comparison, pork rib and loin average sales prices for the rest of the U.S. were 6.4% higher and 5.4% lower over the same period. 

    Concurrently with the price increase, there has been a notable decline in the volume of pork purchased in California. The total volume of fresh pork purchased in California decreased by 23% from June 2023 to August 2023. This volume represents 37% less than the average volume sold in California in August from 2020-2022. As depicted in the graph below, the volume in California generally follows the rest of the U.S. volume patterns up until the large deviation in July 2023. California is the first and largest state to implement this type of law, but it is worth noting that Massachusetts also recently enacted a similar law. These developments are likely to have far-reaching implications for consumers in affected states and livestock producers throughout the United States, including many in the South.

    *Fresh pork products reported in the scanner level data include AO pork, ground pork, leg (fresh ham), pork ingredient cuts, pork loin, pork offal, pork ribs, and pork shoulder.

    Figure 1: Pork Rib and Loin Average Sales Price

    Source: Authors calculations using Circana Retail Sales Data

    Figure 2: Fresh Pork Sales, by Volume

    Source: Authors calculations using Circana Retail Sales Data

    Hawkins, Hannah. “Proposition 12 Preliminary Price Impacts.Southern Ag Today 3(38.2). September 19, 2023. Permalink

  • USDA Refining of Forecasted U.S. Cotton Production

    USDA Refining of Forecasted U.S. Cotton Production

    For spring planted crops like cotton, a key market influence in the fall season is the refinement of the national production forecast.  U.S. cotton production forecasts are published monthly by USDA’s National Agricultural Statistics Service (NASS).  For example, the current U.S. cotton production forecast is 13.13 million bales.[1]  The forecast is expressed in standard 480-pound bale equivalents (or statistical bales).  Actual physical bales (or running bales) tend to weigh closer to 500 pounds, so analysts typically use conversion factors following USDA, e.g., 1.0275 statistical bales for every running bale.

    Acreage and Production Data. Between May and July, NASS’s forecast of cotton production is based on surveyed planted acreage and assumed historical averages for yield and abandonment. Beginning in August, the production forecast incorporates grower survey data on acreage, yield, and abandonment.  Also beginning in August, the South Texas cotton forecast incorporates data from “objective yield surveys” which involve field sampling of boll counts and weights.  In September, this field sampling expands to include all of Texas, Arkansas, Georgia, and Mississippi, with repeat monthly sampling through December.  Lastly, the production forecast is occasionally adjusted in the fall months based on crop insurance information (USDA Risk Management Agency) and/or certified acres data (USDA Farm Service Agency).

    Ginnings Data.  All U.S. cotton is ginned following harvest.  Surveys of gins are performed by USDA NASS who then publishes a monthly forecast of cumulative bales ginned as of that month.  For example, the number of actual U.S. bales ginned as of September 1 was forecasted at 484,450 running bales.[2]  This converts to 497,772 statistical bales, which is 4% of USDA’s September production forecast for this year’s crop.  This is a seasonally normal percentage of the total U.S. crop.  

    Classing Data.  All U.S. cotton bales are sampled for fiber quality.  It follows that the most accurate, albeit unfolding, measure of cotton production is the cumulative count of bales classed by USDA’s Agricultural Marketing Service (AMS).  These data are reported weekly as running bales.  Through the week ending September 8, 2023, AMS reports cumulative classings of 531,866 running bales of upland cotton and no pima cotton.[3]  This converts to 546,492 statistical bales of all cotton which, unexpectedly, exceeds NASS’s ginned bale forecast.  It is assumed that the weekly count of classed bales is always the more accurate measure.

    Reconciliation/Refinement.  The ginnings and classings data are published until the conclusion of ginning season, typically in the first quarter of the year following harvest. NASS will then reconcile their production forecast with final cumulative ginning and classing numbers (the latter two being converted to statistical bales).  The effect of this reconciliation is the refining of NASS’s production forecast to its final estimate.  Figure 1 shows that August production estimates have been between 15% below and almost 20% over final estimates with a lot of variation.  Each monthly refinement in production estimates occurred until final estimates were achieved by May for the last twelve crop years (2011 through 2022).  The refinement concluded by April in eight out of the twelve crop years and was finished in March in six out of the twelve crop years.  In general, the tightening pattern of percent deviations from the final production forecast reflects the influence of the updated USDA data flow.


    [1]  USDA-NASS.  2023.  Crop Production 09/12/2023.

    [2]  USDA-NASS.  2023.  Cotton Ginnings 09/12/2023.

    [3]  USDA-AMS.  2023.  Cotton Weekly Quality Report by State 9/8/2023.


    Robinson, John. “USDA Refining of Forecasted U.S. Cotton Production.Southern Ag Today 3(38.1). September 18, 2023. Permalink

  • EPA Publishes Updated Waters of the United States Rule

    EPA Publishes Updated Waters of the United States Rule

    The EPA released an updated regulation defining “waters of the United States” (WOTUS) on August 29, 2023, which significantly narrows the scope of the previous rule.  WOTUS has been a continual issue facing landowners since the passage/update of the Clean Water Act (CWA) in 1972.  

    But what is WOTUS and why does it matter?  WOTUS is a definition that determines where the federal government has jurisdiction to enforce the CWA.  

    The CWA extends to “navigable waters,” and navigable waters are defined as “waters of the United States.” The definition did not provide a great deal of clarity on where and when the U.S. Environmental Protection Agency (EPA) or the U.S. Army Corps of Engineers (the Corps) could enforce the CWA against private landowners.  Courts and successive administrations have grappled with this definition for years because the definition of WOTUS matters greatly.  The broader and more expansive the definition, the more types of water bodies will be covered, extending the jurisdiction over more property.  Providing a bright-line definition on where the CWA applies has proven to be elusive. 

                On May 25th, 2023, the United States Supreme Court (Court) ruled in Sackett v. EPA, narrowing the types of water bodies that can be considered to fall under the jurisdiction of the CWA.  The updated regulation released on August 29th incorporated the Court’s findings in the Sackett case and significantly narrowed the scope of where the CWA can be applied (to read a summary of the changes, click here). 

                A number of lawsuits challenging the earlier version of this rule remain pending and other challenges to the revised regulation could be initiated. There will also be questions to work through as the agencies begin implementing the new rule across the country.  Still, the new rule represents a substantial change to a definition that has garnered much attention over the past four decades.

    To learn more about the updated regulation, click here.

    To learn more about the Sackett decision, click here.

    To learn more about the Clean Water Act, click here.

  • Crop Insurance Rating: the Curious Case of STAX

    Crop Insurance Rating: the Curious Case of STAX

    The Stacked Income Protection Plan (STAX) was first offered to cotton producers in 2015.  Along with the Supplemental Coverage Option (SCO), STAX is one of the area-wide plans of insurance that are designed to help a grower cover a portion of their underlying crop insurance deductible.  Unlike the underlying Multi-Peril Crop Insurance (MPCI) policies, both STAX and SCO trigger indemnities based solely on area-wide losses (i.e., only if the entire county triggers a loss). Both STAX and SCO are taking on newfound importance in the 2023 Farm Bill debate, as improvements to both could serve to reduce the need for ad hoc disaster assistance.  Currently STAX is still only available to cotton producers whereas SCO is widely available across the country.

    In our travels around the country over the last several months, we’ve often been asked about the future of policies like STAX and SCO, and we’ve repeatedly been told that they are simply too expensive. That wasn’t too surprising to us in the case of SCO, because the premium support is just 65%. On the other hand, we were considerably more surprised in the case of STAX because the premium support is 80% – growers must pay just 20% of the premium. Consequently, in this article, we take a closer look at STAX premiums across the country for the 2023 crop year.

    In the maps that follow, we present STAX premium rates (dollars of premium per dollar of liability) for the 2023 crop year assuming a coverage band ranging from 70% to 90% with a 120% protection factor (resulting in the maximum level of coverage of 24%). STAX was also assumed to include the harvest price (i.e., the guarantee can increase at harvest if prices increase during the growing season). Figure 1 illustrates dryland STAX premiums and Figure 2 illustrates irrigated STAX premiums.  

    As noted in the maps, there is significant variability in premium rates both within and across states, ranging from 28.83% to 81.87% for dryland and 26.7% to 75.82% for irrigated. The highest rate (81.7%) is for dryland cotton production in Bee County, TX. In other words, if the maximum indemnity possible is $1,000 per acre, RMA is charging $817 per acre to insure the crop!  If premiums are actuarily fair, this implies that RMA expects the average indemnity over time to be $817. In reality, indemnities have been zero in Bee County seven of the eight years since STAX was first introduced.  Even with an 80% premium subsidy, the coverage is cost prohibitive.   Neighboring San Patricio County has had a very similar indemnity experience (one indemnity in eight years), and they faced a 72.69% premium rate in 2023. On close examination of the maps, it’s clear that almost every state faces situations where there is considerable variability in rates between neighboring counties.

    Congress may very well choose to provide additional premium support for area-wide policies in the 2023 Farm Bill. Arguably, buying additional area-wide coverage would make considerably more sense than giving away free deductible coverage via ad hoc assistance after disaster strikes. But, the additional premium support is only effective if the underlying premiums being charged by RMA are reasonable and rational and not otherwise pricing producers out of the market for area-wide insurance, a point Congress may wish to explore as they continue their work on the next farm bill.

    Figure 1:  2023 Dryland STAX Premium Rates by County

    Figure 2:  2023 Irrigated STAX Premium Rates by County

    Fischer, Bart L., Joe Outlaw, and Henry L. Bryant. “Crop Insurance Rating: the Curious Case of STAX.Southern Ag Today 3(37.4). September 14, 2023. Permalink

  • 2023 Land Values and Buyer Motivations

    2023 Land Values and Buyer Motivations

    In August 2023, the USDA National Agricultural Statistics Service published their annual report of state-level land values for farm real estate, which includes both cropland and pasture values. The results of the report indicate a strong market in the Southeast, with Georgia leading the region at a 9.8% increase in 2023 farmland values over 2022. The overall increase for the United States was 7.4%, and Kansas led the nation with a 16.3% increase in farm real estate values from 2022.

    Over the last three years, farmland values have increased by record amounts, according to the USDA-NASS survey data. At the same time, the financial position of many farmers has been affected by higher input costs and increasing interest rates. Why don’t we see a one-for-one decrease in land values when interest rates increase and farm profitability moderates? Well, the most straightforward answer is that farmers are a mixed group, and their individual financial positions aren’t necessarily the same as their neighbor’s. This makes it hard to predict the movement of the land markets during times of transition.

    When I read about the farmland market in articles from across the country, I am always struck by the variety of factors at play. First, crop yields are going to drive willingness to bid. Several years of good yields and prices will motivate both farmers and non-farm investors to participate in the land market. But there are always other factors including proximity to urban development or water availability/rights. It is important to remember that farmers are the majority owners of farmland, and their motivations to buy and sell land are big drivers in the market. This means when that rare piece of good farmland near your operation comes up for sale, you will likely be in the market regardless of where interest rates are today. You may also be looking to expand your operation and bring on another generation. When that is the case, buying land becomes a priority for your farm business, and your willingness to bid in a strong market is going to be robust. Each of these factors will contribute to support for the local land market that may keep these recent increases in interest rates and moderation of farm incomes from having a big impact on land values in your area. 

    Source: https://www.nass.usda.gov/Charts_and_Maps/Land_Values/farm_value_map.php

    Taylor, Mykel R. “2023 Land Values and Buyer Motivations.Southern Ag Today 3(37.3). September 13, 2023. Permalink