Blog

  • 2024 Beef Cattle Market Review

    2024 Beef Cattle Market Review

    In 2024, cattle markets remained strong, driven by declining cattle numbers—a trend consistent with expectations outlined at the start of the year. The ongoing cattle cycle began in 2014 and saw beef cow inventories peak in 2019 at 31.69 million head. Since then, inventories have declined at an annual rate of 2.3%. 

    Cattle and calf prices continue their upward trajectory, ending the year on a high note. In the Southern Plains, prices for 500-600 pound steers have increased by approximately $40 per CWT from early October to mid-December. Contributing factors include recent rainfall in the region and a reduced number of calves, which have collectively helped to elevate calf prices. Additionally, the current import restrictions on feeder cattle from Mexico are likely providing some further support to prices, given that December is typically a peak month for imports. 
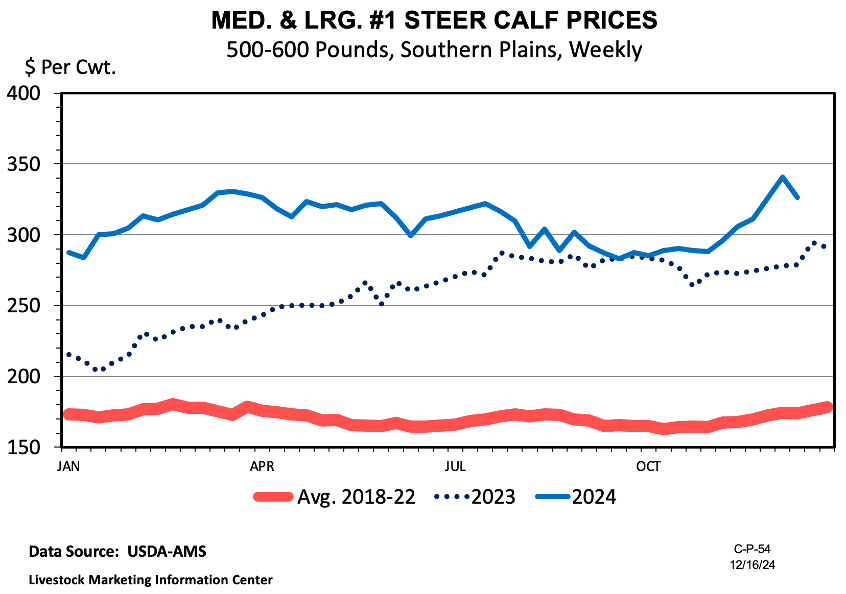
    We also have a strong fed cattle market to finish the year.  Fed steer prices in the Southern Plains reached $195 in mid-December. Carcass weights remain very high compared to history. Steer dressed weights are near 960 pounds. Lower corn prices are supporting longer feeding periods, but there are typically seasonal declines in fed weights. It will be very interesting to watch cattle weights as 2025 begins.

    2025 will begin as another year on the heels of herd contraction in the previous year. The USDA’s January 2025 Cattle Inventory Report is expected to confirm that cattle numbers did indeed decline in 2024. Weekly slaughter data from USDA support this projection. Year-to-date beef cow slaughter is down by 18%, but the implied cull rate—calculated as slaughter divided by inventories—remains at 10.2% for 2024, well above the that would indicate herd expansion. Heifer slaughter data also shows no signs of herd expansion. Year-to-date heifer slaughter is down 1.1%, with no evidence of heifer retention occurring at a rate sufficient to signal herd rebuilding.

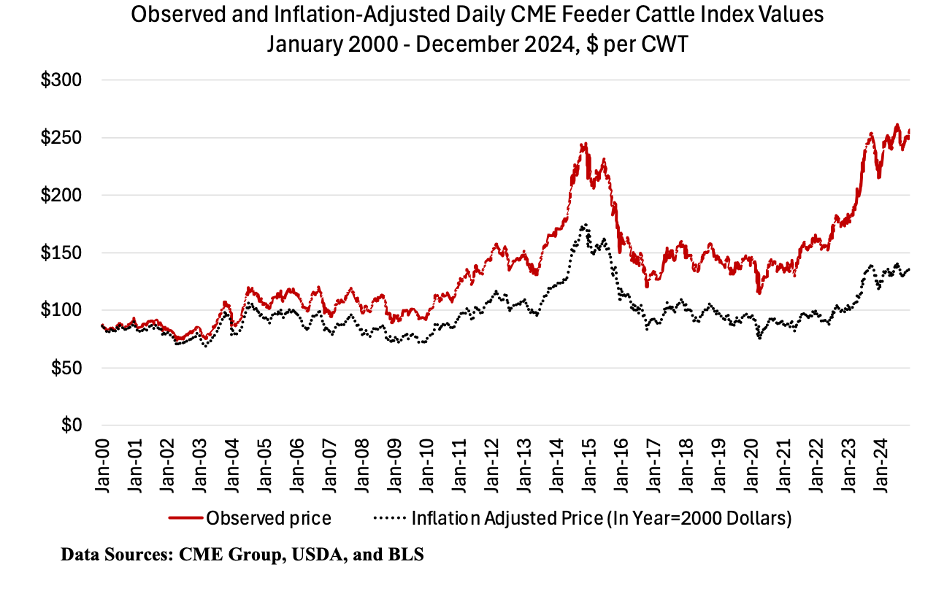
    Cattle market fundamentals at the close of 2024 offer plenty of bullish signals for 2025. Many producers remember the high prices in 2014-2015 as a cautionary tale of how quickly prices can come down after a run up. However, the current fundamentals are quite different than they were in 2015. By year two of the 2014-2015 high price environment, it was clear that herd expansion was occurring. Currently, there are no clear signs to suggest larger calf supplies anytime soon. While prices are high, they have not yet hit levels to persuade producers to expand. 2024 prices hit record levels as shown in the chart above. However, after adjusting for inflation using 2000 as the base year, the purchasing power from the 2024 producer revenues was still below 2014-2015. It could very well be that feeder cattle prices have not yet peaked and the market is beginning 2025 with more optimism. 
    Happy New Year!


    Maples, Josh, and James Mitchell. “2024 Beef Cattle Market Review.” Southern Ag Today 4(53.2). December 31, 2024. Permalink

  • What to Bring to Your Accountant

    What to Bring to Your Accountant

    Financial record keeping is an important aspect of farming. Tracking how your farm is doing over time can help you diagnose any potential issues that may arise. Having an accountant can help you understand how your farm is doing financially and prepare your tax returns. To save time and money, it is essential to provide your accountant with accurate records that reflect what actually happened on your farm. Mislabeling an income or expense can lead to incorrect categorization that will take your accountant more time to correct and/or could create a higher tax bill. 

    You know your farm better than your accountant, and the more detailed records you have on your farm, the better they are going to be able to help you prepare your financial documents. The following are some tips to make your records more organized for your accountant:

    1. Keep business and personal expenses separate.
      • If the farm bank account is used for a personal expense, make a note of it.
      • In a sole proprietorship or general partnership, what is personal and business use might be unclear, so it is useful to track all income and expenses. 
      • In a limited partnership, limited liability company (LLC), or corporation, you must use separate accounts for personal and business use. 
    2. Record information on each income and expense transaction.
      • Each income transaction should have the following: Date, Reference Number, Purchaser, Amount Deposited, and the Type of Income.
      • Each expense transaction should have the following: Date, Check/Reference Number, Payee, Amount Paid, and the Type of Expense.
      • Write legibly on checks and leave a note in the memo line as to the purpose of a purchase.
        • Clear and detailed information on each check will help you and your accountant decide how to categorize checks for tax or management purposes.
    3. Have the principal and interest payment figures separated for any fixed asset loans.
      • This can be found on the last statement of the year or a 1099 from the entity you are paying.
    4. For any contract laborer who is paid more than $600 within the tax year or any employee for whom you pay payroll taxes, your accountant will need that person’s social security number and address to file a 1099 or W-2 form for those workers on your behalf.
      • Consult your accountant for information on paying the proper payroll taxes for any farm worker.

    This list is just a starting point for what you need to think about before visiting your accountant. Again, you know your farm better than your accountant, so the more information you can bring to your accountant, the better they will be able to help you. This will save both your accountant’s time and your money. It will also allow you to get a better understanding of how your farm is doing financially. In both good and tough years, it is important to know your full financial situation so that you can plan accordingly. 


    Mills, Brian E., Kitty Charlton, and Kevin Kim. “What to Bring to Your Accountant.” Southern Ag Today 4(53.1). December 30, 2024. Permalink

  • Harnessing Workforce Development and Well-being in Communities

    Harnessing Workforce Development and Well-being in Communities

    The challenges associated with current labor shortages, availability of diverse job opportunities, and creation of employment pathways are well understood. Can the US deliver effective workforce development programs in ways that work for all?  The answer is a resounding Yes! However, designing effective employment programs and pathways that work for employed and unemployed community residents is not obvious or straightforward. Skill gaps vary according to geography (Moretti, 2024). The propensity to look for jobs and the availability of job opportunities varies across states and cities. For instance, workers entering job markets in states with strong economies will likely find work. Further, labor markets for manual and unskilled work tend to be localized, while professional positions attract job seekers from everywhere. 

    Many jobs require skills training beyond high school but not a formal degree. This creates a misalignment of skills, and training opportunities for those in-demand skills are often inaccessible to the citizens who need them most. This is true for Texas and many other states. Skills training has emerged as a pressing demand to address the challenges facing workforce development in the nation today. Workforce development stakeholders typically consist of employers and federal, state, and local governments. Employed residents are sometimes included in some of the planning and implementation of workforce development programs. However, unemployed residents are often overlooked or left out in the planning and design of workforce development initiatives. Moreover, offering support services, such as childcare or eldercare, can increase the participation of women in the workforce. Underscoring these trends, it is becoming clearer as to why some regions and cities have prospered more than others.

    Finding jobs that match our talent, pay well, and align with individual preferences significantly enhances our quality of life. Regions with strong economies offer a better quality of life. In contrast, low-resourced communities face more complex challenges in developing the local economy. Community members also face disparities related to health and well-being, access to public and private services infrastructure, and the quality of their physical and material environments (Bernard et al., 2022). For example, commuting to work daily or access to healthcare requires reliable transportation, and its absence can limit one’s ability to take advantage of existing resources. The availability of and access to resources and constraints to be overcome by community residents need to be examined from a region-specific and localized focus. Health and social inequalities play an important role in shaping well-being and employment challenges facing community members. Thus, the choice between workforce development and well-being is far from neutral. 

    My research shows that addressing the well-being needs of residents plays an important part in fostering a local ecosystem that, in turn, supports the community in addressing its workforce development needs. Thus, it is important to consider the well-being of community members to reshape and harness the full potential of our work environments. To succeed with workforce development programs, we need to refocus our priorities on well-being. When the health and well-being of community residents are fostered, they show up for work, take less leave, have the confidence to perform well in their jobs, and ensure the safety of their workplace. Investing in skills training enhances the health, quality of life, and economic success of residents and the broader community.

    References

    Moretti, E. (2024). Place-based policies and geographical inequalities. Oxford Open Economics3(Supplement_1), i625-i633.

    National Skills Coalition. (2022, May 12). Skills mismatch. https://nationalskillscoalition.org/skills-mismatch/

    Bernard, J., Steinführer, A., Klärner, A., & Keim-Klärner, S. (2023). Regional opportunity structures: A research agenda to link spatial and social inequalities in rural areas. Progress in Human Geography47(1), 103-123. https://doi.org/10.1177/03091325221139980


    Alagaraja, Meera. “Harnessing Workforce Development and Well-being in Communities.” Southern Ag Today 4(52.5). December 27, 2024. Permalink

  • EU-Mercosur Trade Agreement

    EU-Mercosur Trade Agreement

    The European Union (EU) and Mercosur (Brazil, Argentina, Uruguay, and Paraguay) signed a trade agreement on December 6, 2024, after more than 25 years of negotiations. The agreement, yet to be ratified, has the potential to become the most significant EU partnership, encompassing over 700 million people. It emerges amid the U.S. discussion of raising tariffs. 

    Highlights for Agriculture

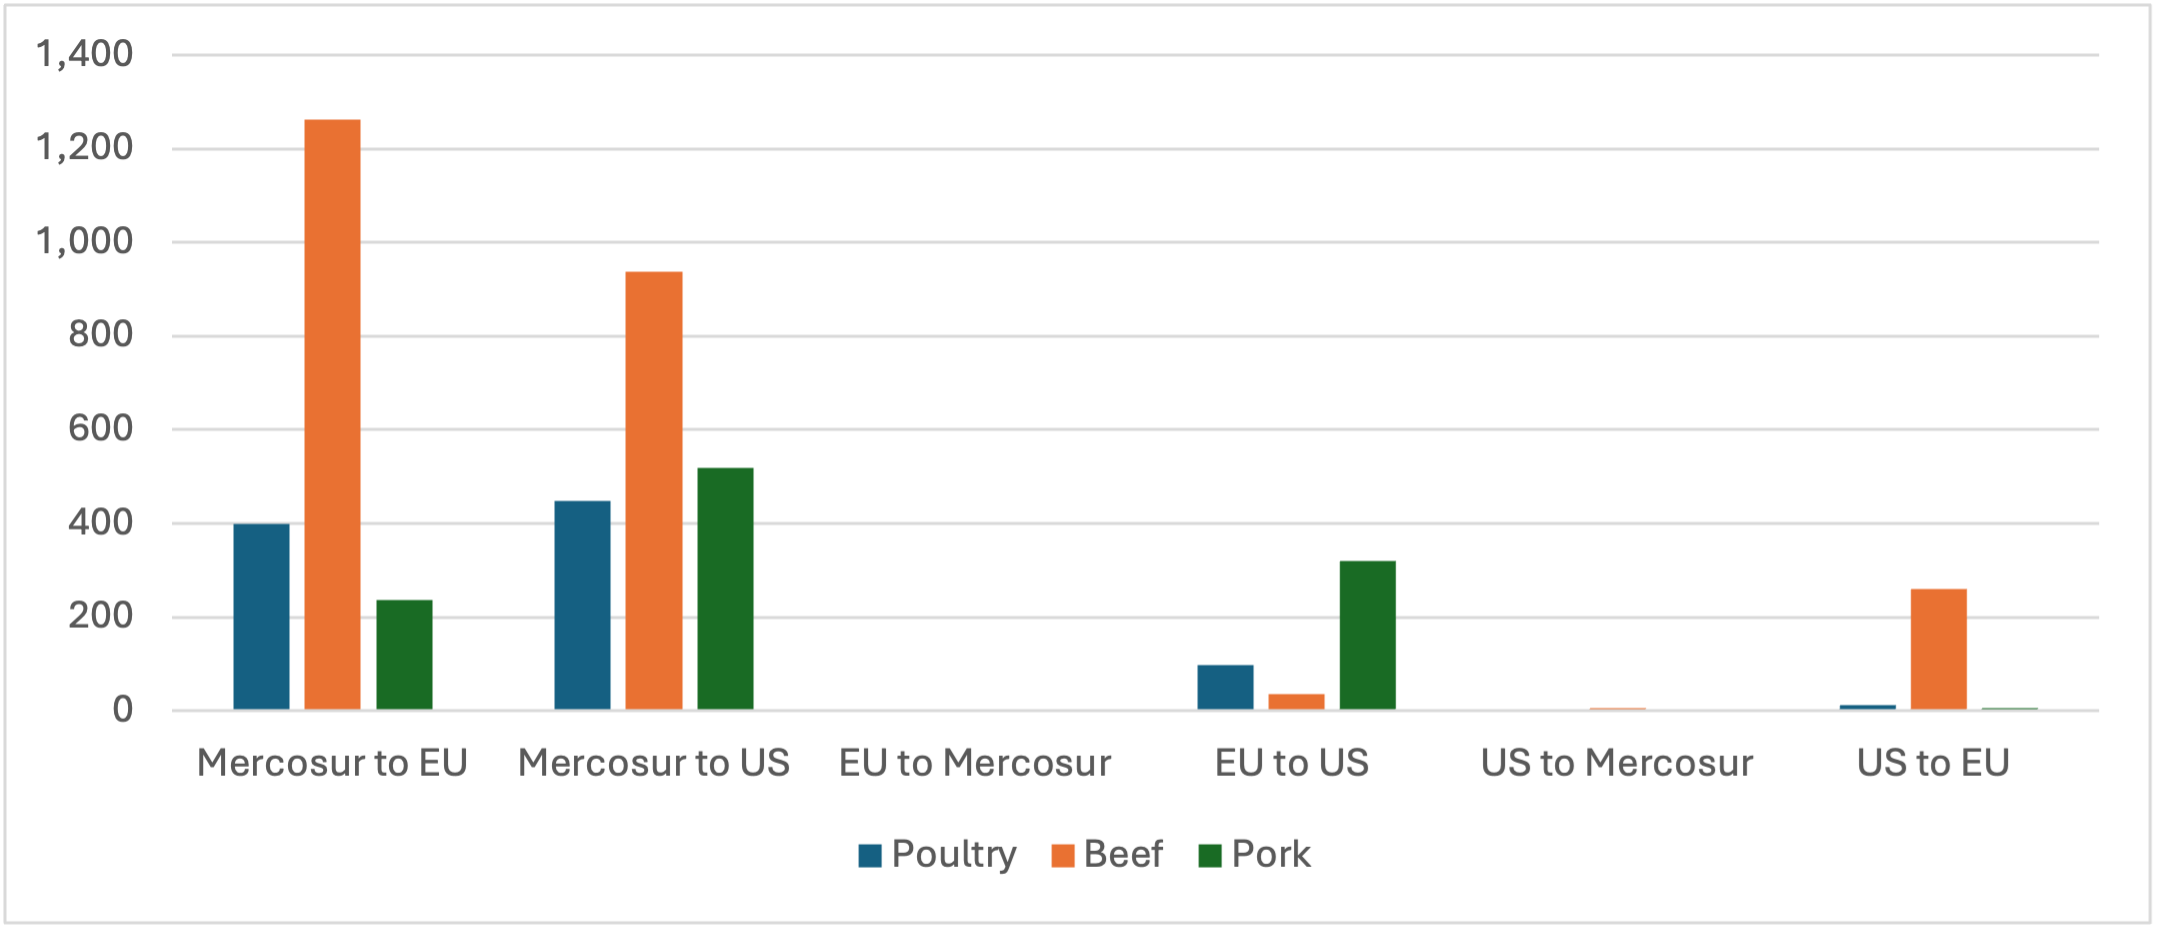
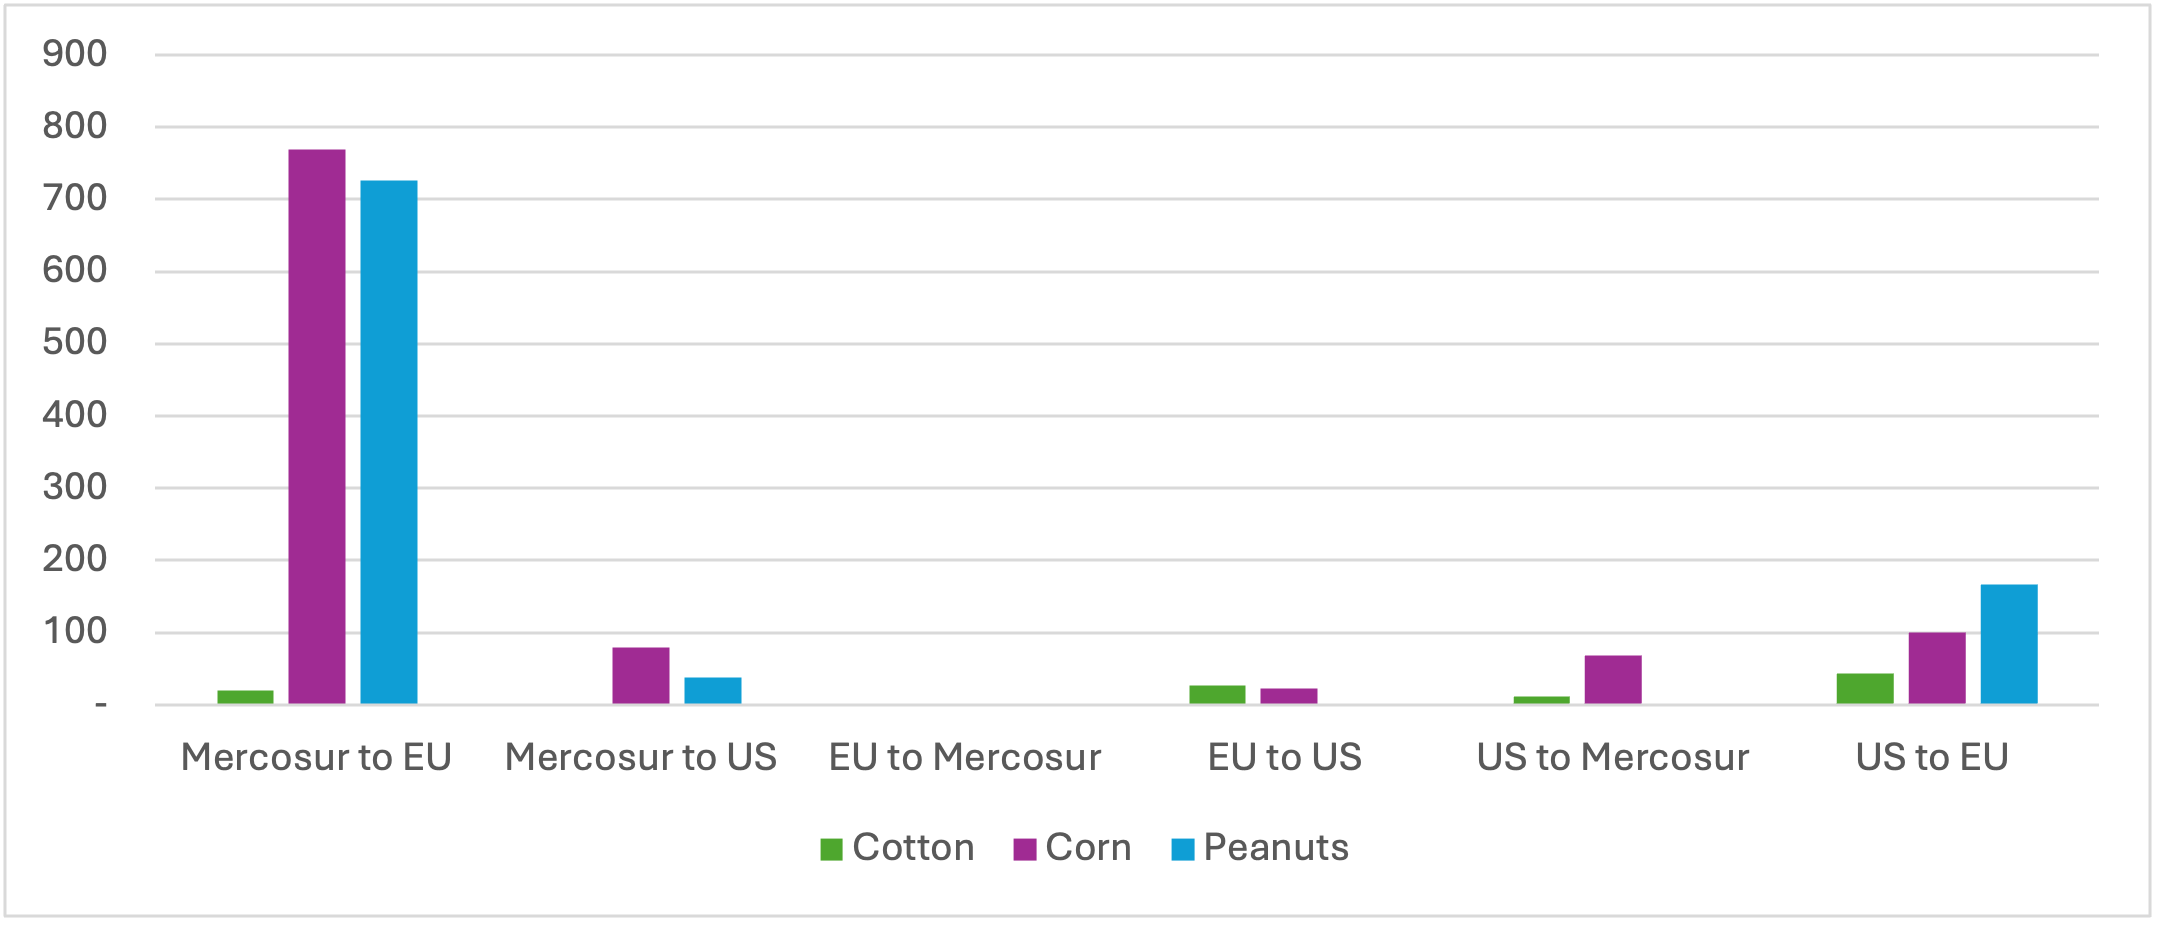
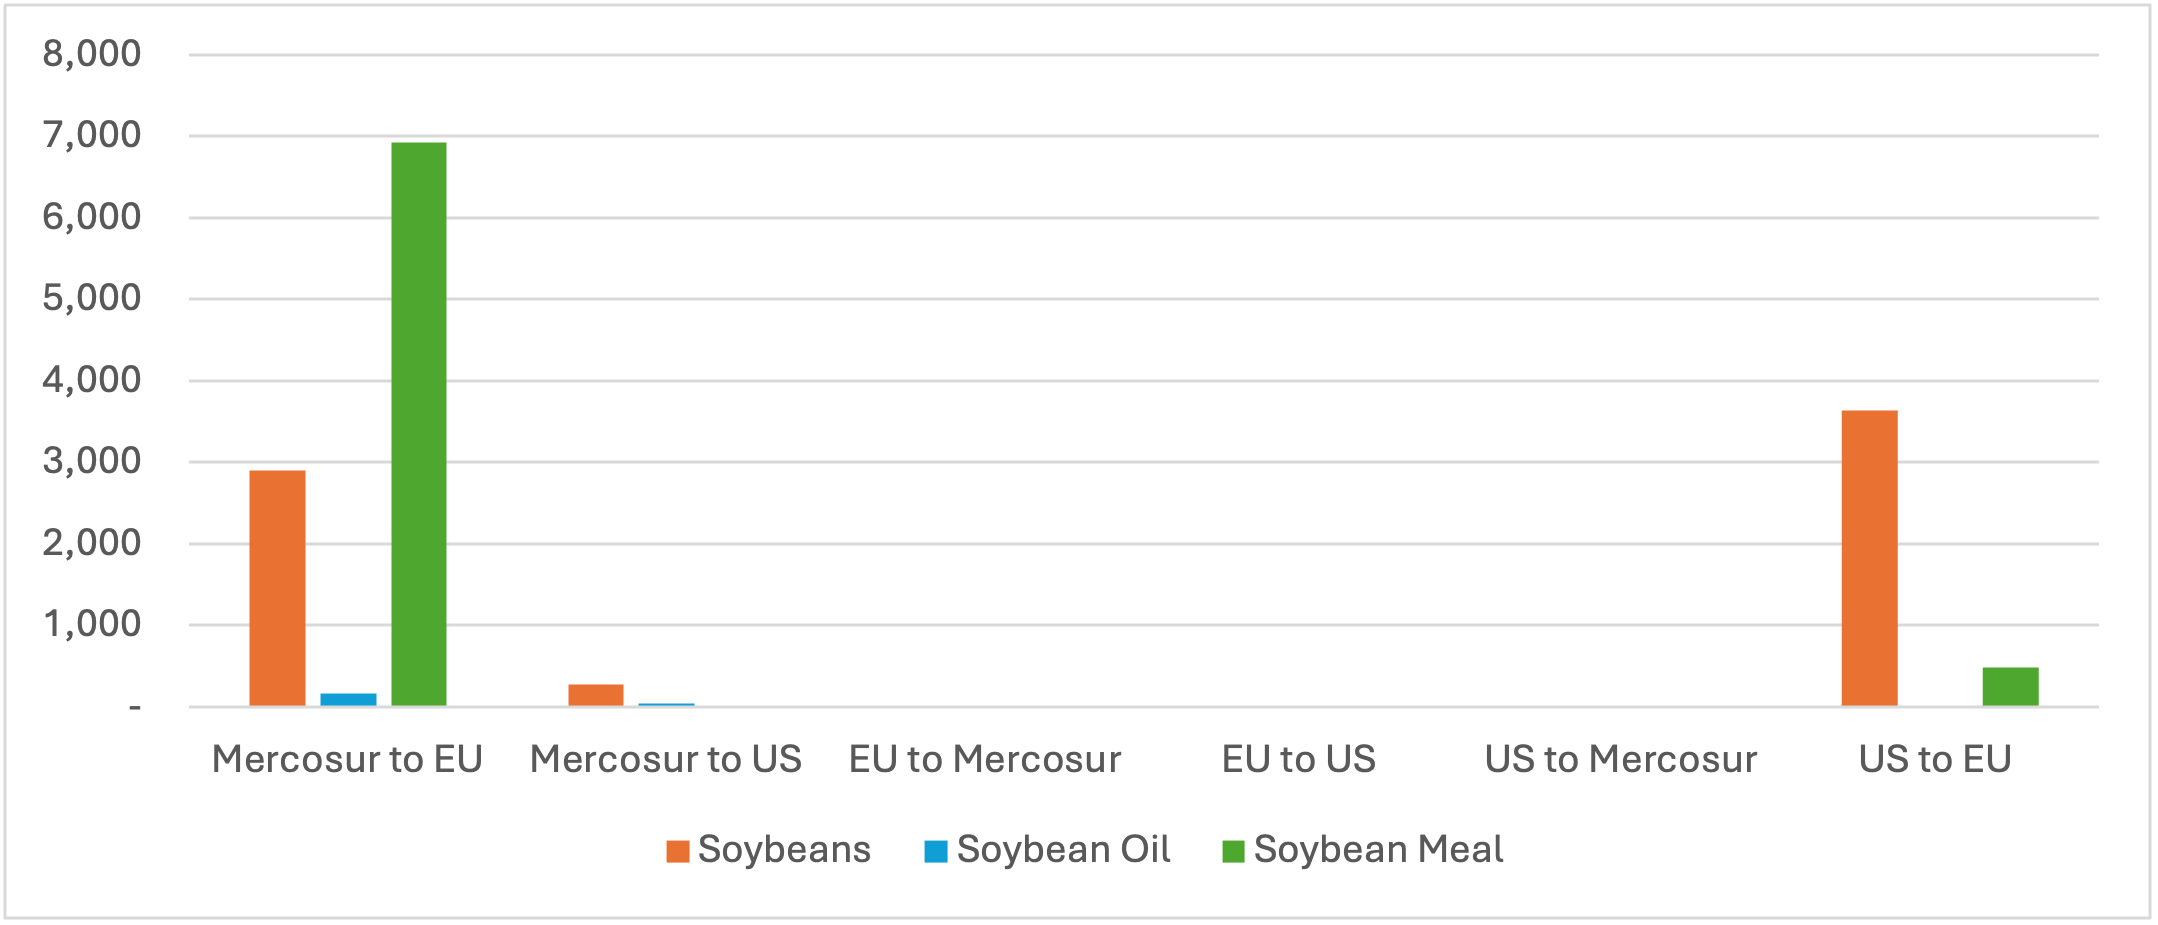
    The flow of agricultural products is more significant from Mercosur to the EU, as illustrated in Figures 1, 2, and 3. The EU-Mercosur Trade Agreement introduces significant changes to agricultural trade by establishing quotas and reducing tariffs over a phased period[1], providing greater access to Mercosur countries.  For beef, an additional quota of 99,000 metric tons (CWE) will be introduced over five years with a 7.5% tariff, while the existing Hilton Quota (10,000 metric tons) will become tariff-free upon the agreement’s implementation. Poultry exports will benefit from a 180,000 metric ton (CWE) quota, phased over five years, with zero tariffs, while pork will have a 25,000 metric ton quota with a fixed tariff of €83 per metric ton, implemented over five years.

    The agreement also includes quotas for sugar (180,000 metric tons with zero tariffs, including 10,000 metric tons reserved for Paraguay), ethanol (450,000 metric tons duty-free for industrial use), and corn (1 million metric tons at zero tariffs, increasing over five years). A 60,000 metric ton quota for rice will start at zero tariffs and gradually increase over five years. Additionally, orange juice tariffs will be eliminated over seven to ten years, with a 50% preferential margin during the transition. These provisions aim to expand market access for Mercosur’s agricultural exports while aligning with EU tariff structures.

    Sustainability: Both blocs committed to following the Paris Agreement, combating deforestation, and reducing greenhouse gas emissions. The EU committed to using data from Mercosur authorities to assess Mercosur’s compliance with the requirements established by European bloc legislation. 

    Challenges Ahead

    The signing of the EU-Mercosur trade agreement represents a significant milestone. However, the agreement may face political challenges in the future. The EU member states and the European Parliament must review and approve the final text. France and Poland are likely to express opposition to the agreement. Additionally, the Mercosur nations will need to ratify the agreement in their respective congresses.

    Implications for the United States

    The EU-Mercosur trade agreement introduces competitive challenges for U.S. agricultural exporters by granting Mercosur countries preferential access to European markets and strengthening the EU’s position in Mercosur. Commodities such as beef (Fig. 1), corn/peanuts (Fig. 2), and soybeans (Fig 3) will face increased competition, with Mercosur benefiting from reduced tariffs and expanded quotas in the EU. At the same time, the agreement allows European goods to gain a stronger foothold in Mercosur countries, reducing U.S. export opportunities in high-value sectors like processed goods and dairy. The deal further challenges the U.S.’s ability to compete globally by setting a precedent for trade norms.

    Figure 1 – 2023 Livestock Export Values by Product and Region (FOB, $ Millions)

    Source: UN Comtrade Database
    Notes: Poultry, HS Code: 0207 (Meat and edible offal of poultry), 1602 (Prepared or preserved poultry); Beef, HS Code: 0201 (Fresh or chilled beef), 0202 (Frozen beef); Pork, HS Code: 0203 (Fresh or frozen pork), 1602 (Prepared or preserved pork).

    Figure 2 – 2023 Crop Export Values by Product and Region (FOB, $ Millions)

    Source: UN Comtrade Database
    Notes: Cotton, HS Code: 5201 (Raw cotton), 5205 (Cotton yarn), 5209 (Woven cotton fabrics); Corn, HS Code: 1005 (Corn/maize), 1102 (Corn flour); HS Code: 1202 (Raw peanuts), 1508 (Peanut oil).

    Figure 3 – 2023 Soybeans Export Values by Product and Region (FOB, $Millions)

    Source: UN Comtrade Database
    Notes: HS Code: 1201 (Soybeans), 1507 (Soybean oil), 2304 (Soybean meal)

    [1] Sources: https://policy.trade.ec.europa.eu/eu-trade-relationships-country-and-region/countries-and-regions/mercosur/eu-mercosur-agreement/factsheets-and-guides_en

    https://agenciabrasil.ebc.com.br/economia/noticia/2024-12/entenda-como-ficam-exportacoes-agricolas-apos-acordo-mercosul-ue


    Calil, Yuri, and Pancho Abello. “EU-Mercosur Trade Agreement.Southern Ag Today 4(52.4). December 26, 2024. Permalink

  • Christmas Dinner!

    Christmas Dinner!

    By Christmas Eve you probably have your Christmas dinner plans already made.  This article looks at wholesale meat prices for some popular celebration cuts.  Wholesale prices are used due to a lack of retail prices for many cuts.  These prices give a good fundamental look at meat prices even though a grocery store customer might have scored a deal through weekly features at their store.

    Beef

    Prime rib, a standing rib roast, or ribeyes are a great holiday dinner.  Ribeye prices increased, as usual, in the runup to Christmas.  Prices normally increase this time of the year as demand picks up for these cuts for holiday dinners.  Prices increased more than seasonally this year compared to prices last year or a 5-year average.  Wholesale, boneless, ribeyes hit $15.61 per pound before dropping to $12.00 per pound in mid-December after holiday buying hit its peak.  Strength in the primal rib value boosted boxed beef cutout values which spilled over into higher fed cattle prices late in the year.

    Pork

    Hams jumped higher while pork loins languished late in the year.  Wholesale 23-27 pound hams increased to $1.09 per pound by mid-December, well above last year’s $0.76 per pound.  That was not the high price for the year as the peak occurred in mid-year, as is often the case with pork due to normally reduced supplies during summer.  Pork loins were $0.94 cents per pound compared to $1.01 last year.  Hams, bellies, and ribs prices have boosted the pork cutout values.  If pork tamales are included in your holiday fare, pork butts have helped.  Pork butt primal values have been lower than last year through most of the Fall.  

    Lamb

    Wholesale rack of lamb prices have been about the same as a year ago, $11.44 per pound, in recent weeks. Light racks have been a little higher than last year while medium racks have been a little cheaper than the year before.  Loin prices have been about equal to a year ago throughout the Fall.  

    Turkey

    Wholesale 8-16 pound hen prices jumped higher after Thanksgiving.  They hit $1.04 per pound in mid-December compared to $0.86 per pound a year ago.  Prices remain well below the 5-year average.  Continued turkey losses from HPAI and the financial hit from low prices will likely continue to cut supplies and move prices higher in the new year.

    Whatever your holiday dinner choice, Merry Christmas and Happy New Year from all the Southern Ag Today livestock economists!


    Anderson, David. “Christmas Dinner!” Southern Ag Today 4(52.2). December 24, 2024. Permalink