It seems like a long way to Thanksgiving but, in a production sense, most plans are already made for turkey production for the Fall. Thanksgiving turkey prices have been a hot topic for the last couple of years as high prices were fueled by reduced production due to High Pathogenic Avian Influenza (HPAI), high feed, other costs, and changing demand. Now, producers have had a chance to respond to high prices by increasing production. Increasing supplies are driving down prices providing some hope for lower prices this Fall.
For the year, turkey production is 3.4 percent greater than last year but that masks that production has jumped even more dramatically in the last 8 weeks. In the last 8 weeks ending July 15th, turkey production is 12.3 percent greater than the same period last year. Last year’s production was greatly impacted by HPAI. Normally, production peaks seasonally in October just in time for Thanksgiving. With the latest June data indicating that poults placed for grow out is 3.5 percent greater than June 2022 and poults hatched were 4.3 percent more than a year ago, it looks like production will remain above a year ago.
The amount of turkey in cold storage increases throughout the year before being drawn down in the Fall. Total turkey cold storage stocks in June were about 6.3 percent above a year ago. It’s important to note that the increase is in breasts and other cuts. Whole birds in storage are about 5.5 percent below last year. While we normally think of the whole birds for the holiday, turkey breasts are an important part of grocery deli sections, sandwich restaurant chains, and other retail outlets.
Turkey prices have declined since the first of the year and are now below a year ago for both whole birds and boneless, skinless breasts. For the week of July 22, 2023, 8-16 pound frozen hens were $1.45 per pound compared to $1.55 per pound the same week last year. Bigger, 16 to 24 pound, toms were $1.40 compared to $1.57 a year ago. The breast market has seen a much more dramatic decline in price, 61.5 percent, from $6.65 a year ago to $2.56 per pound this year.
More turkey production and lower wholesale prices are providing the opportunity for lower turkey prices this Fall. After the last couple of years, that’s some good early Thanksgiving news!
Many factors influence commodity prices. Recently, movements in commodity prices have been driven by U.S. acreage estimates and weather concerns across a large portion of the Corn Belt, and this is likely to remain the principal focus of markets into August. As of July 11, 2023, the percentage of soybeans in Moderate Drought (D1), Severe Drought (D2), Extreme Drought (D3), and Exceptional Drought (D4) was 1%, 6%, 20%, and 30%, respectively (USDA-Ag in Drought). However, there are always numerous factors impacting price direction simultaneously. An interesting trend that has potential repercussions for soybean exports has been the movement in currency exchange rates in 2023.
Soybean exports are largely a three-country game. For the 2023/2024 marketing year, the majority of global soybean exports are expected to come from Brazil (56%) and the U.S. (31%), while China is projected to account for 59% of global soybean imports (USDA-PSD). As such, the prevailing currency exchange rates between the three countries are important. Figure 1 shows the number of Chinese Yuan Renminbi (CNY) and Brazilian Reais (BRL) required to purchase one United States Dollar (USD). Since the start of 2023, the BRL has increased by 11.6% compared to the USD, and the USD has appreciated by 3.3% compared to the CNY (Figure 1). For example, on January 3, a bushel of soybeans worth 14.50 USD would be 78.67 BRL. On July 14, that same bushel of soybeans at 14.50 USD would be 69.58 BRL. From a Chinese buyer’s perspective, due to changes in the value of currencies, a bushel of U.S. soybeans increased 3.3% from January 3 to July 14 and a bushel of soybeans from Brazil increased 15.4% over the same time. Over this time, the change in currency values would support Chinese purchases of U.S. soybeans over Brazilian soybeans, all else being equal. However, supplies of soybeans in Brazil and the U.S. largely minimize this potential effect. Brazil has record supplies, and based on current prices, could have record plantings this fall. The U.S. has lower acreage (83.5 million acres planted) than initially anticipated, lower potential yields due to drought, and limited endings stocks (230 million bushels) for the 2022/2023 marketing year. Moving forward, trends in exchange rates could influence the quantity of soybeans purchased, by China, from the U.S. and Brazil. If the USD appreciates in value, relative to BRL, it makes U.S. exports relatively more expensive for foreign buyers. If the USD depreciates in value, it makes U.S. exports less expensive for foreign buyers.
Figure 1. Brazilian Reais and Chinese Yuan Renminbi to 1 United States Dollar, January 3, 2023, to July 14, 2023
On July 4, 2023, the world experienced the hottest temperature on record: 17.18 Celsius (62.92 Fahrenheit) degrees (Paddison, 2023). Heat waves have been felt across the Earth in places like India, China, and the Americas in the last few weeks. The United States also hit new highs: Phoenix experienced a temperature of 114 Fahrenheit on July 12, while Fort Lauderdale, Cincinnati, Philadelphia, St. Louis, Detroit, Miami, San Antonio, McAllen, and New Orleans broke records with temperatures close to 100 degrees Fahrenheit or above (Bushard, 2023). Moreover, on July 16 most areas in the South were facing an abnormal (and potentially dangerous) heat wave (Figure 1), which was predicted to extend at least for the entire week (Figure 2). The excessively high temperatures and low air quality could have been exacerbated by the smoke from wildfires in Canada. However, phenomena like “El Niño” and “La Niña” (associated with climate change), are expected to increase in frequency and severity regardless.
Agriculture, construction, landscaping, and oil and gas extraction are some of the sectors in which workers are most at risk of being impacted by rising temperatures. Farmworkers are one of the most vulnerable populations to be affected by extreme weather episodes, as they perform physically demanding tasks in environments that can be humid, polluted (by smoke from fires or pesticides), and heat stress. Given the nature of their job, agricultural workers are generally exposed to the elements and need to be outdoors a significant amount of time. The harvesting seasons of some labor-intensive crops grown in Southern states and other parts of the country peak around the summer, limiting the ability to re-schedule activities throughout the year as can be done in other industries. Excessive and constant exposure to elevated temperatures can lead to heart disease, heart stroke, faintness, sunburn, dizziness, dehydration, chronic kidney illnesses, and death (Farmworker Justice, 2022).
There are several measures that can be taken to protect farmworkers during heat waves and prevent negative impacts on their health:
Access to clean water: workers should be able to drink clean and sufficient water whenever they need to. Ideally, water should be cold, provided free of charge, and be offered near the employees’ workplace. Frequent water drinking should be encouraged.
Access to shades: workers should be offered the opportunity to access shaded areas during their free and recovery times. Whenever possible, employers should use tractors or other tools to transport and keep shade-providing structures around harvesting areas. Fans and other cooling devices should also be offered to workers in their housing arrangements.
Introduction of “alternative” shifts: the hottest hours during the day should be avoided for outdoor activity. If portable lights are an option, shifts could be moved to the evening or early morning to avoid exposure to sunlight.
Increasing the frequency and number of resting periods: to allow workers to recover and hydrate. Special considerations should be given to older workers.
Implementation of peer-involving strategies: incentivizing workers to constantly look, together with their supervisors, for indications that their co-workers could be suffering from heat stress.
Training: workers on how to detect heat-related stress symptoms, what to do if they experience any, where to access water and shades, and how to adapt their clothing depending on the temperature.
Information: about weather forecasts and other recommendations by public officials should be monitored. Generally, Extension personnel at universities, state and local health departments, and non-profit groups can provide additional resources related to protecting workers during heat waves (both in English and Spanish).
Heat waves are likely to happen more often as the planet experiences the consequences of climate change. Naturally, agriculture is going to be one of the most negatively impacted sectors. Some labor-intensive crops have very small windows of harvesting times. In addition, farmworkers generally get paid by the hour or piece and if crops are lost to heat or not harvested, their incomes can be substantially reduced, making them reluctant to protect themselves. For these reasons, it is important to take precautionary measures to take care of workers’ health, as agricultural production processes will need to continue and adapt to new weather conditions. Measures taken by employers and employees should be complemented by governmental actions tackling climate change.
Figure 1. Extreme Heat Distribution in the United States: July 16, 2023
Source: The Washington Post, July 17, 2023, online version.
Figure 2. Extreme Heat Distribution in the United States: July 17-22, 2023
Source: The Washington Post, July 17, 2023, online version.
References
Ahmed, N., and Muyskens, J. (2023). 70 million people in the U.S. may be exposed to dangerous heat today. The Washington Post, July 17, 2023, online version.
Bushhard, B. (2023). Record-breaking high temperatures: Here’s where the U.S. has hit new highs for 2023, including Miami, Phoenix and Austin. Forbes, July 11, 2023, online version.
Farmworker Justice. (2022). Farmworkers and the climate crisis. Environmental Justice Symposium Report.
Paddison, L. (2023). The planet saw its hottest day on record this week. It’s a record that will be broken again and again. CNN, July 6, 2023, online version.
Photo by Pixabay: https://www.pexels.com/photo/abstract-beach-bright-clouds-301599/
On July 20th, 2023, the Government of India announced the prohibition of exports of white non-basmati rice (semi-milled or whole milled, whether or not polished or glazed: other; HS 10063090) effective immediately. This measure follows the implementation of a 20% export tariff on non-basmati white rice last September. Exports of basmati (aromatic) and parboiled rice are not affected.
The measure is expected to have a significant impact on the global rice market given that India is the largest exporter of rice. In the last two marketing years (2021/22 and 2022/23) India exported an average of 21.8 million metric tons or almost 40% of global rice exports. Figure 1 shows India’s rice export breakdown by category. The export ban affects 5.8 million metric tons or 27% of the rice exported by India, most of which is exported to Africa. The countries most directly affected by the measure are Madagascar, Benin, and Nepal because India’s white non-basmati rice is the bulk of their imports. At this point, it is safe to say no other single country (except maybe China?) could step up and supply that volume to balance the market.
Figure 1. Share of India’s rice exports in the last two marketing years by category.
The export restriction comes on top of rising global rice prices. According to FAO, since June 2022 the all rice price index and the Indica (long-grain) index, which corresponds to white non-basmati rice, increased 14% and 16%, respectively. Export quotes for India’s Indica rice increased sharply from U.S. $ 355/ton a year ago to U.S. $495/ton in mid-July (Creed Rice Market Report).
The export ban is expected to put upward pressure on rice prices, which can benefit the U.S. long-grain rice industry. Given current market conditions, U.S. long-grain rice is not competitive vis-à-vis Asian rice, the export ban could help reduce the price gap and increase the opportunities for U.S. rice. Nevertheless, the main challenge for the southern U.S. rice industry remains Mercosur, primarily Brazil.
Finally, it is important to acknowledge that the export ban could have severe food security implications, primarily among segments of the population that rely on rice as an affordable source of calories. This potential consequence of the measure is likely to catch the attention of the broader public in the coming months.
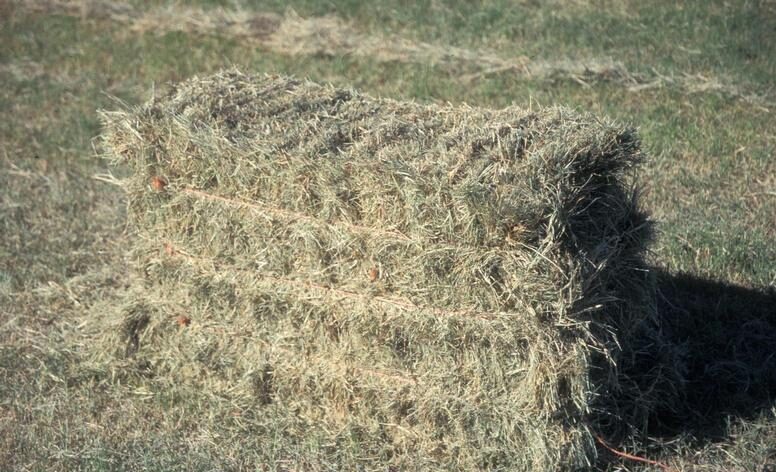
What is the value of the nitrogen, phosphorous, and potassium that is removed when hay is baled and carried away from the field? In March, we looked at wheat straw nutrient removal1, but the value of nitrogen, phosphorous, and potassium should also be considered in hay production.
Baling and removing 8,000 pounds of Bermuda grass hay over the course of a hay season removes 400 pounds of nitrogen (N), 90 pounds of phosphorus (P2O5), and 345 pounds of potash (K2O) per acre2. Prices of $0.71 per pound of nitrogen, $0.73 per pound of phosphorus, and $0.61 per pound of potash3 were used to reflect the approximate value of the nutrients. The table below shows the value of the N, P2O5, and K2O removed on a per acre basis when 8,000 pounds of Bermuda grass hay is removed. The value of the nutrients removed by the Bermuda grass hay is $561.61 per acre per year. Or on a 1200-pound round bale basis, that value is $54.24 per bale. Adding the cost of baling (1200 lbs. round bale) of $14.504 per bale and moving4 the bales out of the field at $4.35 per bale brings the total costs to $103.09 per 1,200-pound bale. Converting these values to a per ton basis (4 tons/acre), the nutrient value is $140.40 per ton, and baling and moving is an additional $31.42 per ton. The total per ton costs are $171.82.
It should be noted that this is just the value of N, P, and K, as there are some micronutrients that are removed as well.
There are caveats. The amount of hay harvested, costs of nutrients, baling and moving will likely be different depending on numerous factors, including location, yield, type of bales, the efficiency of the baler, and soil type. Check local resources in your area to estimate the value/cost of the nutrients and baling costs.
Information for the values included in this article can be found in the following resources.