Blog

  • Shifting Winds: The Changing Landscape of Cotton Production and Exports in the U.S. and Brazil (Part 1)

    Shifting Winds: The Changing Landscape of Cotton Production and Exports in the U.S. and Brazil (Part 1)

    The United States has led world cotton exports since the 1980s. After the 1990s, the U.S. shipped most of its cotton production to foreign markets. As domestic processing capacity shrank,  U.S. cotton farmers became more dependent on international markets. Brazil expanded cotton production and exports in this context, challenging the U.S. leadership in cotton. We briefly contrast the U.S. and Brazilian cotton markets in two parts: the first highlights trade and the second production.  

    The importance of international markets for U.S. cotton farmers has grown in recent decades. In 1995, the World Trade Organization (WTO) implemented the Agreement on Textiles and Clothing (ATC). The ATC gradually phased out quotas on textile imports over ten years. Since the ATC’s implementation, U.S. exports jumped from 37% to 72% of total supply in 2023, underscoring the U.S.’s competitiveness overseas. Brazil exhibited a similar trajectory, reaching 66% of its total supply exported in 2023. Total supply includes beginning stocks, production, and imports. Figure 1 illustrates the upward trend of export relevance to cotton farmers. 

    Figure 1 – Cotton Exports as a Percentage of Total Supply. 

    Notes: Total supply is the sum of beginning stocks, production, and imports. ATC: Agreement on Textiles and Clothing. 2024 are estimated values. 
    Source: FAS/USDA/PSD. 

    Brazil surpassed U.S. cotton exports in 2023. The U.S. exported 11.75 M bales in the 2023 crop season, and Brazil shipped 12.1 M bales, leading cotton exports for the first time (USDA, 2024). Figure 2 shows the growth of Brazilian exports while U.S. exports stagnated. Factors such as Asian demand, favorable exchange rates, government support, and competitive prices fueled Brazilian exports. The U.S.-China trade war (2018-19) further shifted trade dynamics. 

    Figure 2 – U.S. and Brazil Cotton Exports. 

    Notes: ATC: Agreement on Textiles and Clothing. 2024 are estimated values. 
    Source: FAS/USDA/PSD. 

    Before the U.S.-China trade war, China ranked third among the largest importers; today, it tops the list. China now serves as the primary destination for U.S. and Brazilian cotton. According to U.N. Comtrade (2024), Brazil’s share of the Chinese market surged from 9% in 2014 to 37% in 2023, matching the U.S.[1] From 2022 to 2023, Brazilian cotton shipped to China jumped 49%, while U.S. exports dropped 33%. However, in the first half of 2024, the U.S. increased its exports to the Asian country by 79% compared to the same period last year. 

    The continued growth of Brazil’s cotton exports will likely challenge U.S. dominance further. Understanding the surge in Brazilian supply is particularly relevant for Southern growers, which are facing prices below $0.70 per pound, less than half of the May 2022 peak. Also, modest economic growth and high interest rates have constrained consumer spending worldwide, depressing the global demand for cotton. In part 2, we will review yield and production trends and how they may shape the export outlook. 

    References. 

    FAS/USDA/PSD. PSD Data Sets. Retrieved from: https://apps.fas.usda.gov/psdonline/app/index.html#/app/home[Accessed August 22, 2024].

    U.N. Comtrade. Trade Data. Retrieved from: https://comtradeplus.un.org/ [Accessed August 29, 2024].


    [1]. Market share is calculated from cotton quantity. The analysis with the U.S. Comtrade Database used HS 5201 cotton (not carded or combed). 


    Cali, Yuri, and Rachel Judd. “Shifting Winds: The Changing Landscape of Cotton Production and Exports in the U.S. and Brazil (Part 1).Southern Ag Today 4(36.4). September 5, 2024. Permalink
  • Irrigation Water Pumping Costs in the Mid-South

    Irrigation Water Pumping Costs in the Mid-South

    Irrigation water is a significant resource for row crop agriculture in the Mid-South (Eastern Arkansas, Northeastern Louisiana, Northwestern Mississippi, and Southeastern Missouri). The primary crops grown in the region are rice, soybeans, cotton, and corn. All rice acres and most soybean, corn, and cotton acres in the region are irrigated. The region’s primary irrigation source is groundwater pumped from the Mississippi River Valley alluvial aquifer (MRVAA) (Massey et al., 2017). Pumping costs vary greatly throughout the region depending on the crop grown, the mode of power used to pump the water, and the pumping depth of water. This article looks more closely at the range of pumping costs for the Mid-South.

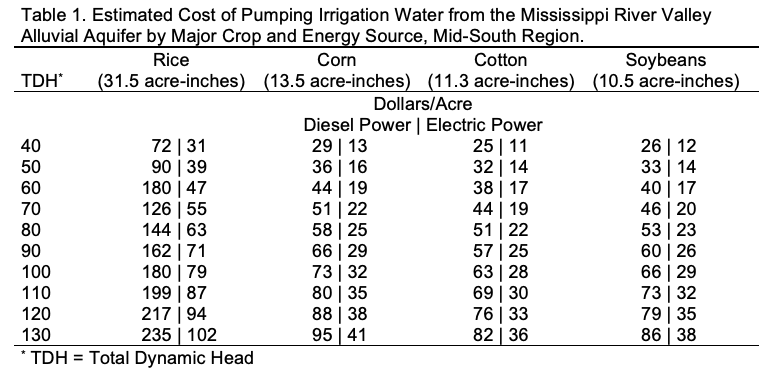
    Table 1 presents the estimated costs per acre of pumping irrigation water for the four major crops grown in the Mid-South by energy source (diesel, electric) and by total dynamic head (TDH) (depth to water plus drawdown and discharge pressure). Crop irrigation amounts (acre-inches) represent average amounts reported for each crop in enterprise budgets from both the University of Arkansas and Mississippi State University. A diesel price of $3.54/gallon is used to calculate diesel pumping costs, while an electric price of $0.138/kWh is used to calculate electric pumping costs. The amount of diesel and electric energy used to pump irrigation water for a given TDH is based on irrigation energy consumption data for alluvial wells from McDougal (2015). 

    Diesel power is currently more expensive than electric power. Farmers in the region have switched many of their diesel irrigation motors to electric motors because of the lower cost of electricity, but diesel is still prevalent due to the expense of running electricity to fields located far from electric utility lines. The proportion of diesel to electric pumps can vary greatly by farm in the region.

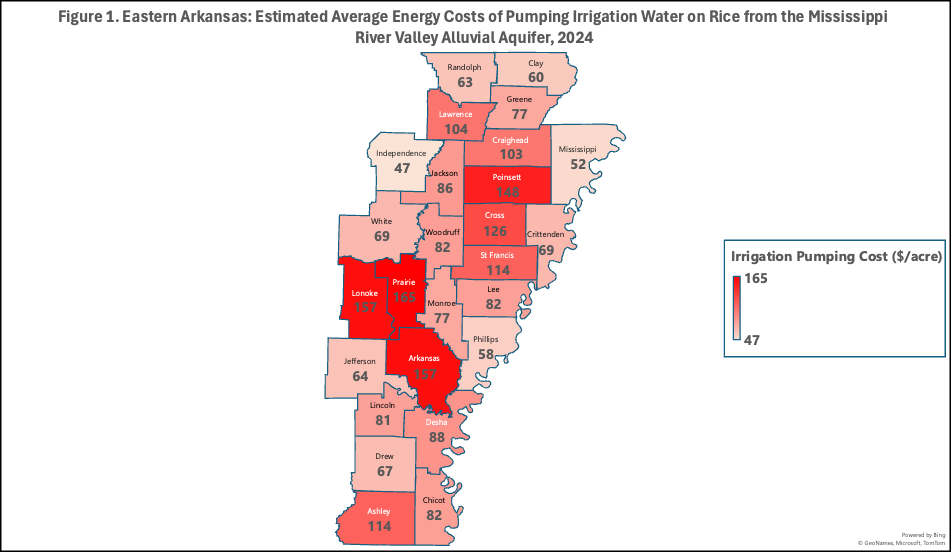
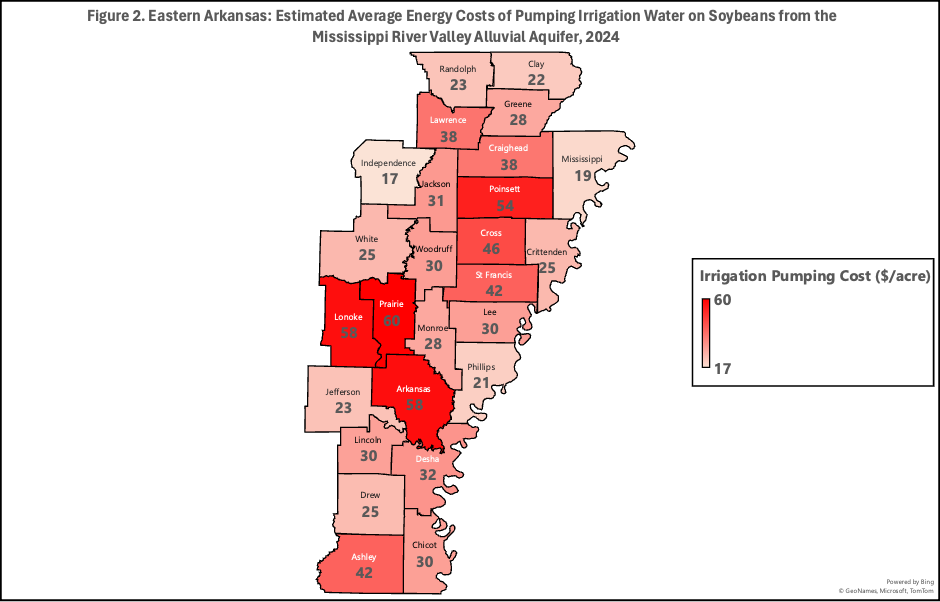
    Pumping costs can vary greatly depending on geographic location and groundwater availability. To demonstrate this, Figures 1 and 2 present estimated average pumping costs per acre for rice and soybeans by county in Eastern Arkansas. Estimated average pumping costs in these figures assume half diesel and half electric power and are calculated using depth-to-water data from the Arkansas Groundwater Protection and Management Report for 2023 (Arkansas Department of Agriculture, NRD, 2024). Average depth-to-water values for each county are adjusted upward to TDH by adding 28 feet to account for drawdown and discharge pressure (Chris Henry, University of Arkansas Water Management Engineer, personal communication). Counties with a darker shade of red in both figures have the highest average pumping costs. Groundwater is more limiting for these counties relative to counties where water is more plentiful (counties with a lighter shade of red). Less groundwater translates into deeper pumping depths, making irrigation water more expensive in locations where water is more limiting.

    References and Resources

    Arkansas Department of Agriculture, Natural Resources Division (2024). Arkansas Groundwater Protection and Management Report 2023. https://www.agriculture.arkansas.gov/wp-content/uploads/2023-Groundwater-Report-Final.pdf

    McDougall, W. M. (2015). A Pump Monitoring Approach to Irrigation Pumping Plant Performance Testing. Graduate Theses and Dissertations Retrieved from https://scholarworks.uark.edu/etd/1146

    Massey, J.H., C.M. Stiles, J.W. Epting, R.S. Powers, D.B. Kelley, T.H. Bowling, C.L. Janes, and D.A. Pennington (2017). Long-Term Measurements of Agronomic Crop Irrigation Made in the Mississippi Delta Portion of the Lower Mississippi River Valley. Irrigation Science. 35:297-313. 


    Watkins, Brad. “Irrigation Water Pumping Costs in the Mid-South.Southern Ag Today 4(36.3). September 4, 2024. Permalink

  • Feeder Heifer Imports from Mexico and U.S. Herd Rebuilding

    Feeder Heifer Imports from Mexico and U.S. Herd Rebuilding

    Whether or not herd rebuilding has started is among the most frequently asked questions.  For the most part, the answer is there is not much evidence of rebuilding yet.  The number of heifers held for herd replacement in the January 1 inventory report was the smallest on record.  The quarterly cattle on feed reports indicated more heifers on feed than a year ago which implies more heifers placed in feedlots rather than kept in producers’ herds to produce a calf next year.  However, there is a different set of data that might shed some more light on heifer retention.

    Monthly cattle imports from Mexico have been greater than a year ago during every month of 2024.  We import both feeder steers and spayed feeder heifers which eventually go to feedlots.  The quarterly cattle on feed reports, which indicate the number of heifers on feed, would include those heifers that came from Mexico. If the number of feeder heifers imported from Mexico is large enough, it could suggest fewer U.S.-born heifers have been placed on feed in 2024. This could be an indication of fewer U.S. heifers available or that more heifers were held back for replacement.  

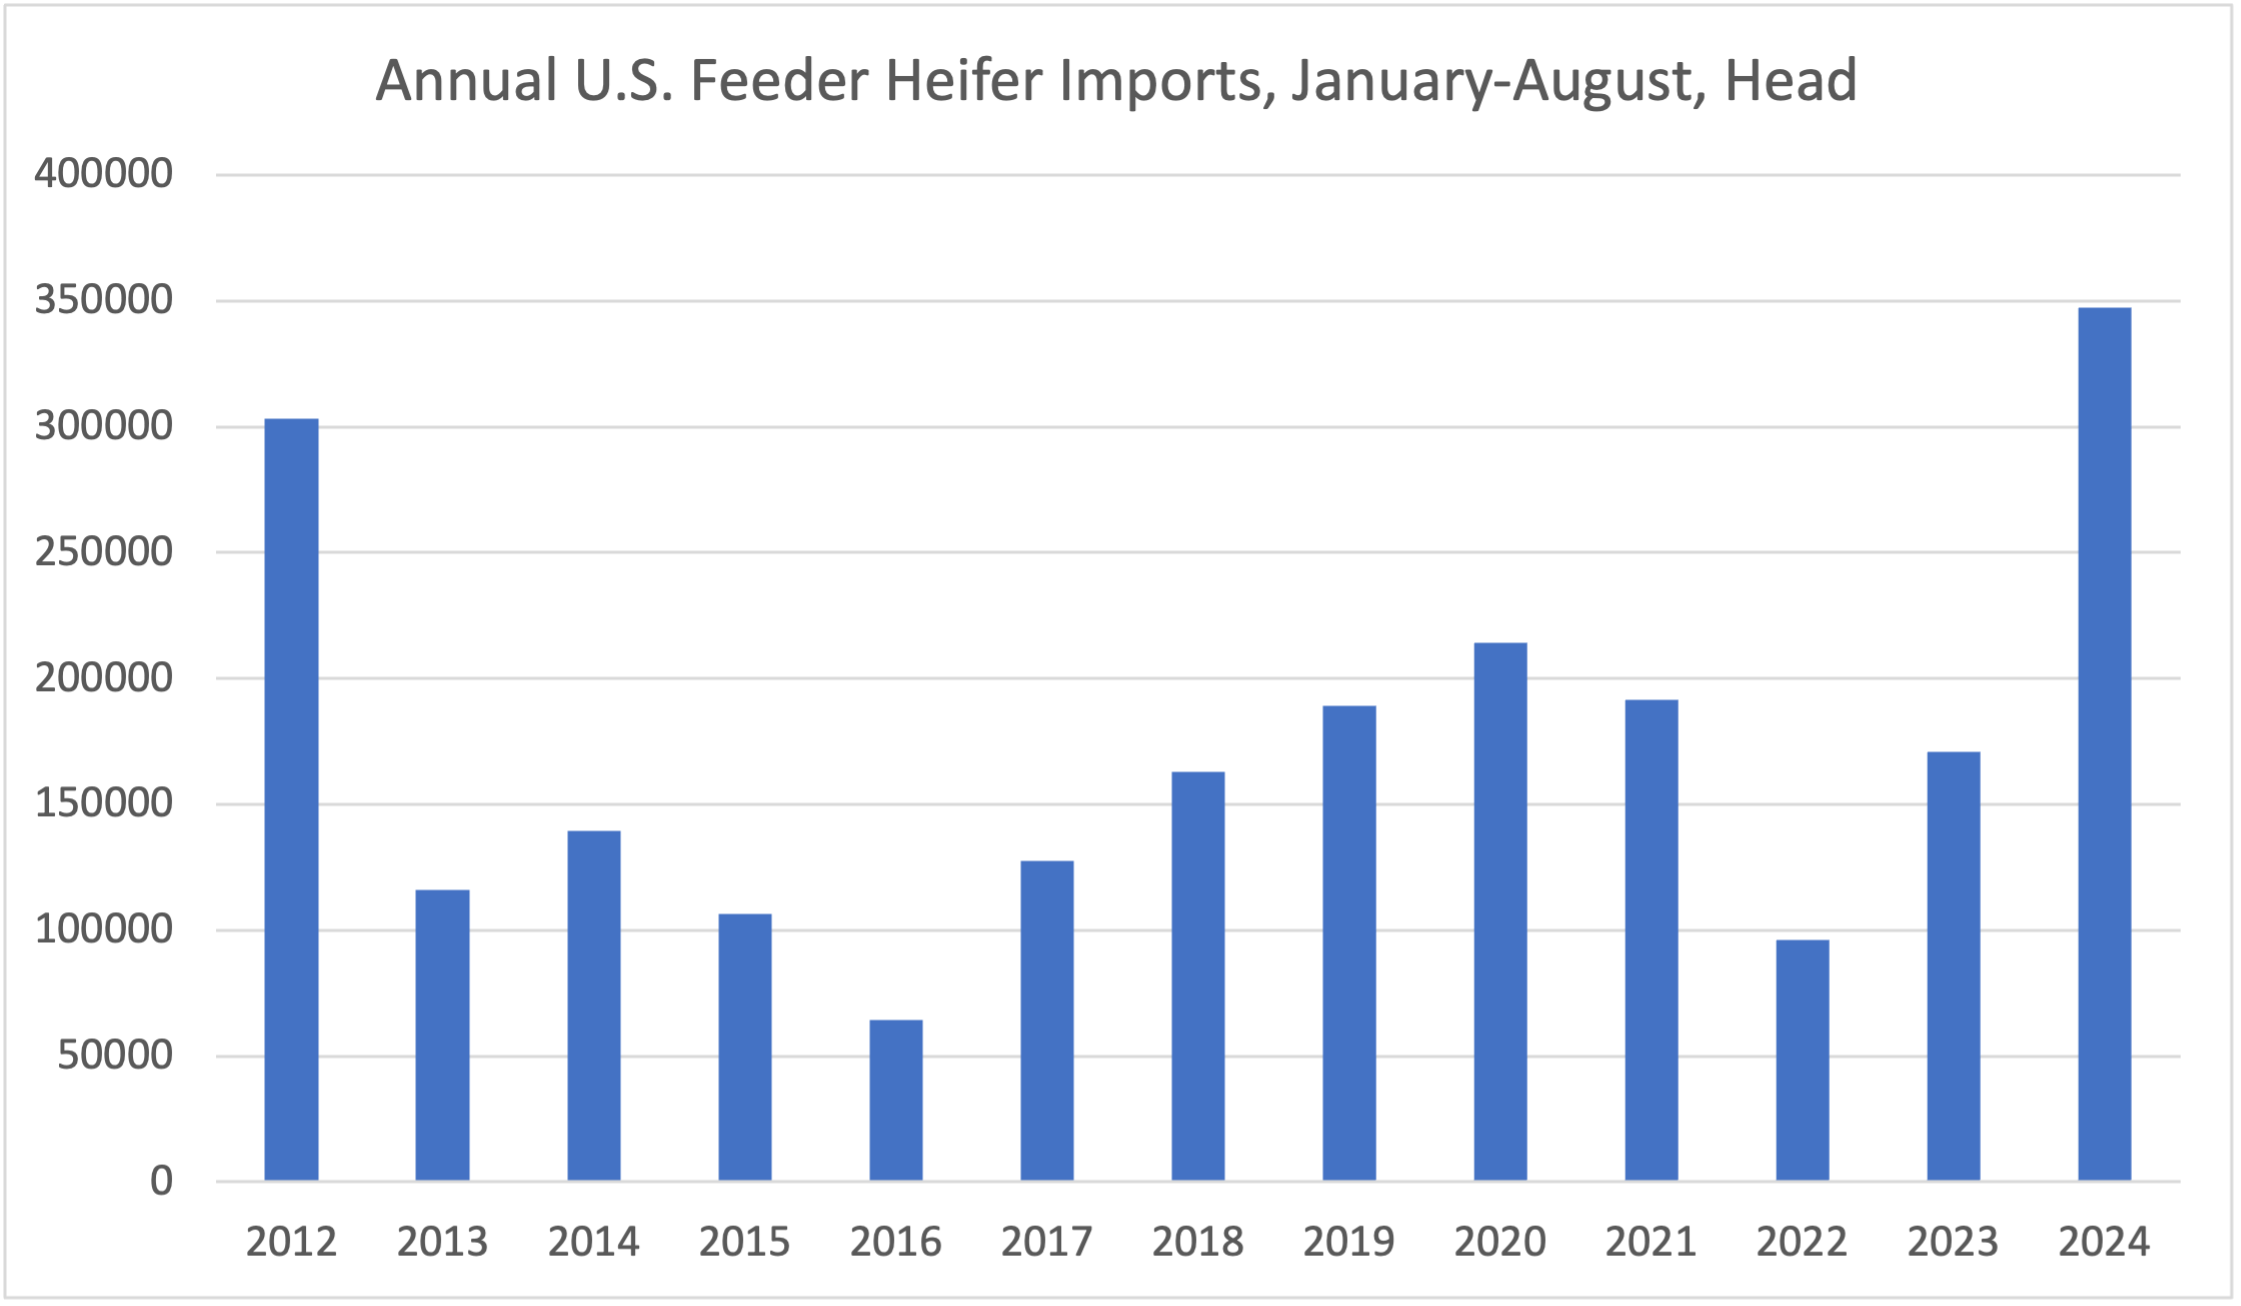
    We have the weekly data for feeder steers and feeder heifers imported from Mexico beginning in January 2012.  Through the week of August 24, there were 347,401 feeder heifers imported during 2024.  That is 176,644 more than the same period last year.  It is also the most feeder heifers imported for this time period going back to at least 2012 when 303,290 head were imported.  Feeder heifers make up 37 percent of total feeder cattle imports, the highest since at least 2012. Over the same number of weeks, total feeder cattle imports (including steers) are the second largest behind only 2012.  

    What does this mean for U.S. herd rebuilding?  If we take the total number of heifers on feed on July 1 and then subtract the number of feeder heifers imported from Mexico during January-June, it would indicate 126,784 fewer domestic heifers on feed than last year.  It is probably too big of an assumption to think all of those imports have already been placed in feedlots since many imported feeder cattle go to pasture before heading to feedlots.  Still, this result might indicate that a few more domestic heifers have been held back, although some of this decline could simply be due to fewer heifers born in the U.S. We certainly aren’t convinced of any widespread expansion yet.  However, larger heifer imports from Mexico are propping up the percentage of U.S. heifers on feed and need to be carefully considered when making comparisons to previous years.  

    Anderson, David, and Josh Maples. “Feeder Heifer Imports from Mexico and U.S. Herd Rebuilding.” Southern Ag Today 4(36.2). September 3, 2024. Permalink

  • Land Ownership and the Preservation of Family Farm Legacies 

    Land Ownership and the Preservation of Family Farm Legacies 

    The preservation of land for future generations and the creation of family legacies is an important part of the U.S. agricultural heritage.  Unfortunately, many families are left vulnerable to losing their land or face complicated management decisions.  This occurs because the land is passed down from one generation to the next without an appropriate transition plan or without a properly probated will.  

    Two recent Southern Ag Today articles (referenced below) focused on estate and transition planning, both illustrating the importance of the process of organizing and arranging the transfer of one’s assets, including real estate, to heirs in a structured and legally recognized manner. It typically involves creating a will or trust, designating beneficiaries, and addressing issues like taxes and debts. It is a crucial aspect of risk management that can keep land in the family.  Land ownership where property is passed down without clear legal documentation and is shared among all the heirs is known as heirs property.  

    Heirs property can limit land management and complicate access to some federal programs. Each heir has an equal right to full use and possession and is legally responsible for taxes and other property-related expenses and activities.  As land is passed down to future generations, and the number of heirs increases, it becomes more fractionated with each person’s percentage interest in the land decreasing.  Furthermore, heirs property becomes vulnerable to loss through issues such as partition sales, tax sales, or adverse possession.  Maintenance of the land and the ability to manage the use of the lands resources is also limited and can result in conflict and disputes amongst the heirs.  

    While heirs property is a significant issue, there are means to resolution and preventing the future creation of heirs property.  This starts with a will or appropriate estate or transition plan.  According to a Gallup Poll in 2020, only 46% of U.S. adults have a will.  Almost a quarter of adults 65 years and older are also without a will.  While we do not have these data for agricultural producers, the USDA Census of Agriculture does report the number of producers who are engaged in some form of estate and transition planning.  Table 1 reports the percentage of producers in the 13-state southern region that reported being engaged in estate or transition planning in the 2017 and 2022 Census of Agriculture.  In 2017, this percentage ranged from a low of 49% in Louisiana to a high of 62% in Oklahoma.  These numbers fell in 2022 in all states, with Louisiana remaining the smallest percentage at 44% and Oklahoma, while still the highest, dropped to 56%.  This illustrates the significant gap that exists in agricultural estate planning, leading to increased risk of creating heirs property for future generations. 

     There are various reasons why individuals do not engage in proper estate planning.  Sometimes they feel they do not have enough assets, the process is too expensive, or the process is too complicated.  Another reason is that some people are simply holding off because the conversation is uncomfortable and morbid. However, the best prevention for heirs property is education, choosing the right attorney, and formalizing a transition plan. A well-crafted estate plan can prevent a property from becoming heirs property by ensuring that a clear title is passed down to future generations.  More information on the resolution and prevention of heirs property can be found in the Heirs Property in Alabama publication. 

    Table 1: Percentage of Agricultural Producers Engaged in Estate or Transition Planning 

    State20172022Percentage 
    Change
    OK62%56%-6%
    AR57%53%-4%
    TX58%53%-5%
    VA56%53%-3%
    AL56%52%-4%
    GA55%52%-3%
    MS55%51%-4%
    SC56%51%-4%
    TN55%51%-4%
    KY55%50%-5%
    NC54%50%-4%
    FL51%48%-3%
    LA49%44%-5%
    Source: Author Calculations based on 2022 USDA Census of Agriculture 

    References:

    Gallup. “How Many Americans Have a Will?” The Short Answer. June 23, 2021.

    Graff, Natalie. “Government Incentives for Agricultural Generational Transfer?” Southern Ag Today 4(25.4). June 20, 2024.

    Johnson, Portia, Ryan Thomson, Adam Rabinowitz, and Katie Keown. “Heirs Property in Alabama.” Alabama Cooperative Extension System HE-0852. Revised July 2024.

    Martinez, Charley, and Kevin Ferguson. “Estate Transition Planning.” Southern Ag Today 4(27.3). July 3, 2024.


    Rabinowitz, Adam, Justin Anderson, and Jamie Mardis. “Land Ownership and the Preservation of Family Farm Legacies.Southern Ag Today 4(35.5). August 30, 2024. Permalink

  • Timeline of the ARC and PLC Programs: Why Are Payments Received a Year Later?

    Timeline of the ARC and PLC Programs: Why Are Payments Received a Year Later?

    The Agriculture Risk Coverage (ARC) and Price Loss Coverage (PLC) programs are vital components of the farm safety net for many producers, helping them manage the considerable risks they face. Eligible commodities for these programs include wheat, corn, sorghum, barley, oats, seed cotton, long- and medium-grain rice, certain pulses, soybeans/other oilseeds, and peanuts. Given the importance of these programs, we are often asked why the payments are made so late, generally well over a year after harvest. This article illustrates the timeline for the ARC and PLC programs, explains the reasons behind the one-year delay in payments, and examines the impact on current farm bill discussions.

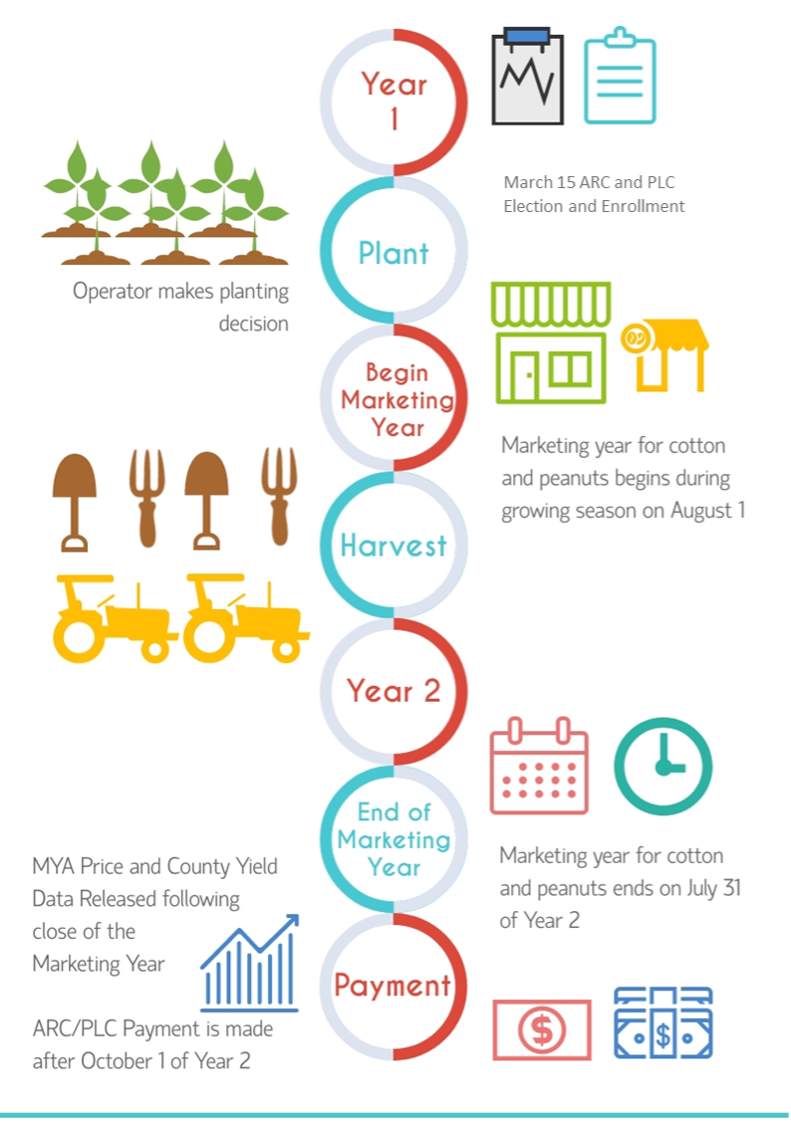
    Typically, prior to planting a crop, producers must make a decision (i.e., an election) between ARC and PLC on a crop-by-crop and farm-by-farm basis. They generally have until March 15 to notify USDA’s Farm Service Agency (FSA) of their election decision and to enroll in an annual ARC/PLC contract for the covered commodities for which they have base acres. Because ARC and PLC are decoupled from production, a producer’s individual production, harvesting, and marketing decisions have no bearing on ARC and PLC payments. In fact, the marketing year is standardized and does not depend on when a farmer harvests their crops on individual farms. Instead, it is based on a fixed start date specific to each commodity, which generally aligns with the typical harvest period for that crop and lasts for 12 months from this standardized start date. For example, the marketing year for cotton and peanuts starts on August 1st and lasts until the following July 31st. The national average price over this “marketing year” is then used to calculate any required ARC or PLC payments. Farmers can then expect the processing of ARC and PLC payments to occur after October 1 following the end of the marketing year, in accordance with the farm bill. 

    Figure 1 illustrates the timeline of the ARC and PLC programs using cotton and peanuts as examples. For the 2024 crop year, producers signed up for ARC/PLC and planted the crop this past spring. The marketing year started on August 1, 2024. Some producers (e.g., South Texas) have already harvested, and the remainder will be harvested this fall. The marketing year will continue into next year, concluding on July 31, 2025. USDA will then calculate marketing year average prices and county yields, and they will make any ARC/PLC payments after October 1, 2025. In other words, more than 18 months will have transpired between the time a producer enrolled in ARC/PLC and the time when assistance was eventually paid.

    Interestingly, it hasn’t always been this way. Using the Counter-Cyclical Payments (CCP) program – the predecessor to PLC – from the 2002 Farm Bill as an illustration: the 2002 Farm Bill required USDA to make payments “as soon as practicable after the end of the 12-month marketing year for the covered commodity.” To help lessen the impact of the lagged payment timing, if the Secretary estimated that a CCP payment would be required, the 2002 Farm Bill required the Secretary to “give producers on a farm the option to receive partial payments of the [CCP] projected to be made for that crop of the covered commodity.” This all changed in the 2008 Farm Bill. The 2008 Farm Bill required any CCP payments to be made “beginning October 1, or as soon as practicable thereafter, after the end of the marketing year for the covered commodity.” In other words, payments were further delayed – until after October 1 following the end of the marketing year – and no partial/advance payments were allowed. The payment timing introduced in the 2008 Farm Bill was maintained with the creation of ARC and PLC in the 2014 Farm Bill, and it is still in place today. This all naturally leads to the question: why? 

    First, both ARC and PLC use the marketing year average price to determine if assistance is warranted. That necessarily means waiting until the end of the marketing year before final ARC and PLC payments can be made. While some attempts have been made to reduce the wait time – such as utilizing prices based on the first few months of the marketing year – those haven’t taken hold. Regardless, that doesn’t explain the further delay introduced in 2008. When the drafters of the 2008 Farm Bill delayed payments until after October 1, they effectively pushed payments into a subsequent fiscal year, as the federal fiscal year starts on October 1 each year. In so doing, this “timing shift” resulted in one less year of assistance that had to be funded by the 2008 Farm Bill, freeing up those resources to be used on other priorities. The problem: reversing this would result in another fiscal year of ARC/PLC assistance having to be provided by the existing farm bill budget. While complicated, it is simply a matter of policymakers deciding if it is better to use scarce resources to (1) accelerate the timing of payments or (2) make programmatic improvements like increasing reference prices. Over the last two farm bill cycles, policymakers have opted for leaving the timing alone and making programmatic improvements instead.

    The more acute concern is this: even if Congress passes a new farm bill this fall (in time for the 2025 crop year), under current ARC and PLC payment timelines, producers will not see any assistance until after October 1, 2026 (the first month of fiscal year 2027). Given growing concerns about the state of the farm economy, even with a new farm bill in place, there undoubtedly will be tremendous pressure on Congress to provide ad hoc assistance for the 2024 crop year this fall, as was highlighted in a recent Southern Ag Today article, to help fill in the gap.

    Figure 1. Two-Year Timeline for Key Dates of ARC and PLC Payments Using Cotton and Peanuts as an Example


    Li, Yangxuan, Bart L. Fischer, and John Lai. “Timeline of the ARC and PLC Programs: Why Are Payments Received a Year Later?Southern Ag Today 4(35.4). August 29, 2024. Permalink