Blog

  • Low Hog Prices and Red Ink

    Low Hog Prices and Red Ink

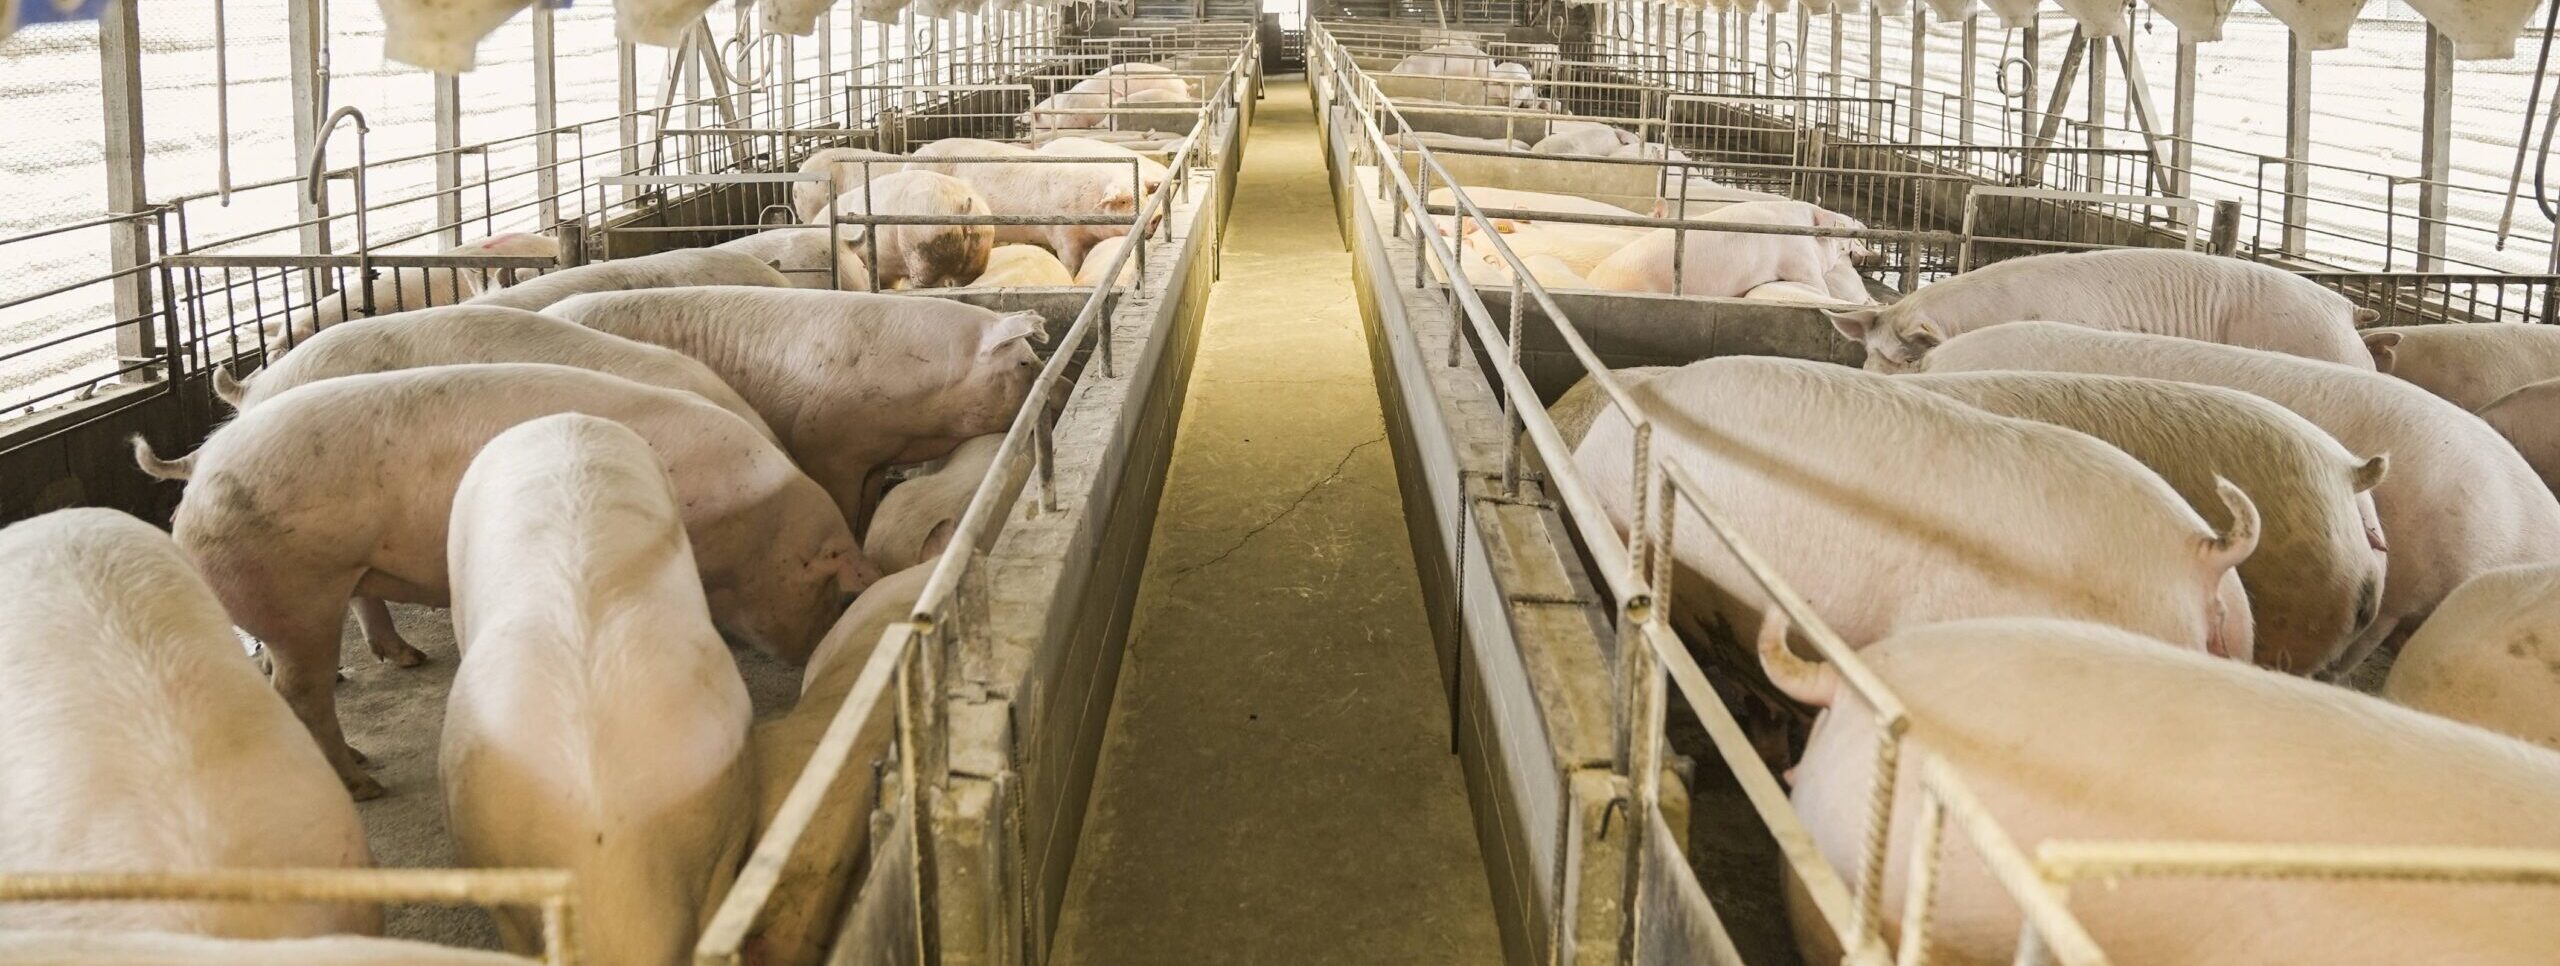
    Low hog prices and losses are causing significant financial stress in the hog industry.  Farrow to finish returns as estimated by Iowa State University have been negative for the last 6 months and were as large as -$36.04 per head in January.  This string of monthly losses has been the largest in at least a decade.  It’s interesting to note that financial losses have been reported by hog producers worldwide.  European and Asian producers have reported significant breeding stock culling due to losses.

    Barrow and gilt slaughter is 1.7 percent larger than last year through the first week of May.  When combined with lighter barrow and gilt weights, pork production is just under 1 percent larger than last year, but with a rebound in exports so far this year, means that there is slightly less pork on our domestic market than last year.  

    Tighter pork supplies after netting out trade have not translated into higher hog prices.  Slaughter weight hog prices, net of premiums and discounts, were $79.11 per cwt in mid-May compared to $100.35 last year at this time.  While $79 per cwt is about equal to the 5-year average price, costs are higher.  Feeder pig and early weaned pig prices have declined dramatically since the first of the year, down 50 and 64 percent, respectively. Extremely low prices for feeders don’t indicate a lot of hope for higher prices in the future.

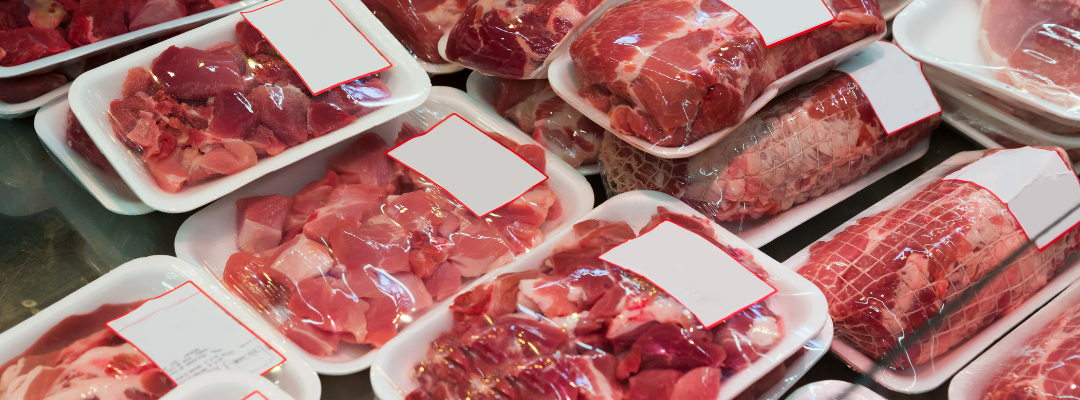
    The pork cutout value in mid-May was $82.48 per cwt compared to $103.57 last year.  Most primal cuts are well below last year’s prices as well, including bellies which are 50 percent lower than this time last year.  Some bad news for those interested in BBQ, prices for pork butts are 9.9 percent higher than last year. However, on the positive side, the primal rib is about 41 percent lower than last year.

    There are several things to watch for in this market in the coming weeks.  Sow slaughter should increase as breeding numbers are reduced.  Fewer gilts may be held back also lending a boost to slaughter numbers.  USDA’s June quarterly inventory report should help confirm some direction for future farrowing and breeding herd inventory.  We should start to see slaughter decline seasonally boosting prices.  A seasonal price rally would be welcome news for producers.  


    Anderson, David. “Low Hog Prices and Red Ink.” Southern Ag Today 3(21.2). May 23, 2023. Permalink

    Photo by Mark Stebnicki: https://www.pexels.com/photo/groups-of-pigs-in-pigpens-6791938/

  • Flooding in the Upper Mississippi River is Associated with Relatively Weak Soybean Basis in the Midsouth 

    Flooding in the Upper Mississippi River is Associated with Relatively Weak Soybean Basis in the Midsouth 

    Grain and oilseed producers in the Midsouth experienced record low soybean basis, which is the cash price less futures price, in October 2022 due to reduced barge traffic and record high barge freight rates along the lower Mississippi River. These factors were associated with soybean basis as weak as 125 cents under the harvest time futures contract which was nearly one dollar below the 5-year average of 28 cents under for the month of October.  In a previous Southern Ag Today article, Biram et al. (2022) noted the primary reason soybean basis values fell to historic lows was because grain buyers at local elevators were pushed to bid lower cash prices for soybeans to compensate for the additional cost to transport grain from the elevator to the port of New Orleans for export. Further, grain buyers essentially had no place to store the grain even if they wanted to buy it which supports the principle of offering lower cash prices to disincentivize farmers from making delivery.

    While we witnessed the association of record-low basis with record-low river levels in the lower Mississippi River last fall, we are now witnessing an association of relatively lower basis and record-high river levels in the upper Mississippi River due primarily to snow melt. As the Mississippi River level increases to flood-level stages, barge traffic is limited as locks and dams along the river are closed, preventing the transportation of grain downriver or empty barges upriver. On April 16th, the Mississippi River gauge height at McGregor, IA, reached 16 feet which is considered a minor flood stage by the United State Geological Survey (USGS, 2023). On April 20th, the gauge height measured at the same location reached a moderate flood stage of 19 feet. On April 28th, the gauge height was measured at 23 feet, above major flood stage of 22 feet, which is the greatest gauge height reported since April 26, 2019, when it measured 22 feet. 

    Soybean basis reported in locations along the lower Mississippi River began to diverge from historical trends on April 10th and continue throughout the month of April. Consider the case of soybean basis at Elaine, AR, which is representative of basis reported in other southern states in the region (Figure 1). In this example, I consider the basis for 2023 delivery at harvest time which is the difference of the forward cash price and the November 2023 soybean futures contract (ZSX23). The first reported drop in this specific soybean basis was on April 10th with a fall from 25 cents over to 18 cents over which suggests a local response to the rising upper Mississippi River levels (Figure 1). This weakening of basis is associated with the increase in river gauge height throughout the month of April despite the relatively strong 4-year average basis for years in which the gauge height at McGregor, IA, did not reach moderate or major flood stage (i.e., 2018, 2020, 2021, and 2022). The most recent period basis fell below zero in April was in 2019 when it consistently stayed near 40 cents under which is another period in which the upper Mississippi River experienced record-high levels.

    The river level in the upper Mississippi River is starting to fall and with it will most likely come relatively stronger soybean basis in the Midsouth if the historical association between these two variables continues. Additionally, forward cash prices typically reach their strongest in early summer before declining as we approach the harvest months. One implication for a grain marketing plan would be to consider holding off on the May forward contracting decision for 2023 harvest-time delivery until the latter part of the month in anticipation of recovery in the  soybean basis.

    Figure 1. Spring Soybean Basis at Elaine, AR and Mississippi River Gauge Height at McGregor, IA (2018-2023)

    Note: The Nonflood Four-Year Average is calculated using the years when the gauge height at this location did not reach moderate or major flood stage.

    References

    Biram, Hunter, John Anderson, Scott Stiles, and Andrew McKenzie. “Low Water Levels in the Mississippi River Result in Abnormally Weak Soybean Basis“. Southern Ag Today 2(45.1). October 31, 2022. Permalink

    Report-Arkansas Daily Grain Bids | MARShttps://mymarketnews.ams.usda.gov/viewReport2960

    Mississippi River at Mcgregor, IA – 05389500, United States Geological Survey. May 3, 2023.https://waterdata.usgs.gov/monitoring-location/05389500/#parameterCode=00065&timeSeriesId=43560&startDT=2023-04-01&endDT=2023-04-30


    Biram, Hunter. “Flooding in the Upper Mississippi River is Associated with Relatively Weak Soybean Basis in the Midsouth.” Southern Ag Today 3(21.1). May 22, 2023. Permalink

    Photo by Tom Fisk: https://www.pexels.com/photo/mississippi-river-during-golden-hour-14819622/

  • United States Supreme Court Upholds Proposition 12

    United States Supreme Court Upholds Proposition 12

    Last week, the United States Supreme Court issued its Opinion in National Pork Producers Council v. Ross.  The National Pork Producers Council (NPPC) challenged California’s Proposition 12, a law imposing certain animal welfare requirements such as pen size and space on pork sold in California, alleging that it violated the Dormant Commerce Clause.  

    The Dormant Commerce Clause essentially implies that because the United States Constitution expressly grants power to regulate interstate commerce to Congress, that, by implication, means such power is not vested with the states.  Here, NPPC argued that the California law had extraterritorial impacts on pork producers in other states, thereby violating the Dormant Commerce Clause.

    The Court issued a fractured Opinion affirming the lower courts’ grant of California’s Motions to Dismiss, with some portions agreed upon by each of the 9 Justices, and others garnering support from far fewer.

    The Justices unanimously agreed on two points.  First, the “antidiscrimination principle lies at the very core of” Dormant Commerce Clause jurisprudence.  Here, NPPC did not allege that Proposition 12 was facially discriminatory statute, admitting it applied equally to in-state and out-of-state pork producers.  Second, all Justices rejected NPPC’s argument that there is an “almost per se” rule that forbids state laws that have a “practical effect of controlling commerce outside the state.”  This was too broad a reading of the Dormant Commerce Clause for all of the Justices.  As the Court explained, “In our interconnected national marketplace, many (maybe most) state laws have the ‘practical effect of controlling’ extraterritorial behavior.”

    Where the Justices disagreed, however, was the proper scope and analysis under the Pike balancing test.  When a law has a substantial burden on interstate commerce, the Pike balancing test requires a court to balance the burden on interstate commerce against the local benefits from the law.  Some Justices held that the Court was not intended to, or able to, weigh such burdens.  Other Justices held that there was no proof of a substantial burden on interstate commerce, which means the Court should not reach the balancing test at all in this case.  Still others found that a substantial burden was alleged, but that the US Court of Appeals for the Ninth Circuit improperly applied the balancing test and would have remanded the case with instructions to correctly balance the interests.

    Where does this leave producers?  Currently, the regulations surrounding Proposition 12 are not set to go into effect until July 1, 2023. Another challenge alleging additional facts seeking to prove that Proposition 12 does impose a substantial burden could potentially be filed.  A similar law was passed in Massachusetts, and a lawsuit is currently pending challenging that law.  It is certainly possible that additional laws related to animal husbandry practices could be passed in other states as a result of this ruling. 

    For more information click here.


    Lashmet, Tiffany. “United States Supreme Court Upholds Proposition 12.” Southern Ag Today 3(20.5). May 19, 2023. Permalink

    Photo by Mark Stebnicki: https://www.pexels.com/photo/close-up-shot-of-pigs-2737178/

  • U.S. Beef Exports Down in 2023 (so far) – U.S. Beef is Losing Ground in China

    U.S. Beef Exports Down in 2023 (so far) – U.S. Beef is Losing Ground in China

    Despite record beef exports in 2022 ($11.7 billion), there are signs of weakening beef trade for the U.S. in 2023. Note that total U.S. beef and beef product exports year-to-date (January-March) in 2023 were down in terms of value by 22% when compared to the same period in 2022, and down 8% in terms of volume. This overall decline was primarily driven by declines in sales to Asian markets, most notably the leading destinations for U.S. beef exports: Japan, South Korea, and China. In terms of value (volume), U.S. beef exports to Japan were down 20% (4%), South Korea 36% (15%), and China 21% (15%) (USDA, 2023). A noted reason for these declines is the relatively strong U.S. dollar, which has made beef exports relatively more expensive, and recent and anticipated declines in U.S. beef production.

    In previous SAT articles, I highlighted the rise of China as a major buyer of U.S. beef and a major beef importing country overall. As mentioned in these articles, China emerged from relative obscurity and is now the third leading market for U.S. beef behind Japan and South Korea. In 2022, China imported $2.2 billion dollars of U.S. beef and beef products, with sales comparable to well established foreign markets: South Korea ($2.7 billion in 2022) and Japan ($2.3 billion in 2022). Unfortunately, the trade data for 2023 indicate that U.S. beef may be losing ground in the Chinese market. Figure 1 shows China’s beef imports from the U.S., as well as from all countries in 2022 and 2023 (January – March). Even as U.S. beef exports to China declined in the first quarter of 2023 from $382 million to $344 million (or 40 thousand to 38 thousand metric tons), China’s beef imports overall increased by more than $100 million and nearly 103 thousand metric tons. According to Trade Data Monitor® (2023), China imported 125% more beef from Brazil during this period (124 thousand metric tons in the first quarter of 2022 versus 280 thousand metric tons in 2023). Foreign demand for U.S. beef demand will remain a significant concern going forward as declining beef production could put even more pressure on U.S. beef prices. It appears that this is having and will continue to have a negative impact on U.S. beef exports overall and in China in particular.

    Figure 1. China’s beef and beef product imports in 2022 and 2023: YTD (January – March)

    Note: TMT is Thousand Metric Tons. Beef and beef products are defined according to the U.S. Department of Agriculture BICO category, which mostly comprised of beef cuts and to a lesser degree beef offal.
    Source: Trade Data Monitor®

    References

    USDA (2023). Global Agricultural Trade Systemhttps://apps.fas.usda.gov/gats/default.aspx

    Trade Data Monitor® (2023). https://www.tradedatamonitor.com/


    Muhammad, Andrew. “U.S. Beef Exports Down in 2023 (so far) – U.S. Beef is Losing Ground in China.Southern Ag Today 3(20.4). May 18, 2023. Permalink

  • Foreign Investment in Agricultural Land

    Foreign Investment in Agricultural Land

    Foreign land ownership has recently become a hot topic for politicians and the news media in the United States. Reasons given for interest in this topic include rising land values, added barriers for beginning farmers, and concerns about food security and national security due to non-U.S. ownership of agricultural assets. There is currently no federal law that prohibits the ownership of private agricultural land by foreign persons or entities. The federal government’s only involvement is the monitoring of land acquisitions and recording of information on those purchases through the passage of the Agricultural Foreign Investment Disclosure Act of 1978 (AFIDA).  Under AFIDA, qualifying foreign entities who buy or sell an interest in agricultural land are required to report the transaction within 90 days of the date of transition. Failure to comply with the AFIDA results in a civil penalty of up to 25% of the fair market value of the interest held in the land (USDA-FSA 2021). 

    Under AFIDA, the term agricultural land includes cropland, pasture, and timber. Foreign holdings of U.S. agricultural land increased by 2.4 million acres in 2020 (USDA-FSA 2021). However, these holdings represent a relatively small proportion of the overall base of farm and timber land in the United States. The total amount of U.S. cropland, pasture, and forest land under foreign ownership in 2020 was 37.6 million acres, which represents about 2.9% of all agricultural land. It is also important to note that more than half of US farmland held by foreign countries are long-term leases, often by energy companies, as opposed to outright ownership.

    The largest purchaser of U.S. agricultural land is Canada, representing 32% of land owned by all foreign buyers, or 12.4 million acres held. The next four countries holding U.S. agricultural collectively purchased 12 million acres or 31% of foreign-owned land. Those countries are the Netherlands (13%), Italy (7%), the United Kingdom (6%), and Germany (5%). In contrast, China owned 352,140 acres as of the end of 2020, which is less than 1% of foreign-held acres in the United States. As shown in Figure 1, China ranks 18th overall in U.S. land holdings among foreign countries and ranks 11th if we focus on U.S. farmland acquired between 2010 and 2020.

    The USDA does not have the authority to intervene in private land deals, but individual states can and have passed legislation that affects who can buy agricultural land and how much they can own. In the past two years, many states have proposed legislation limiting foreign ownership of farmland and sometimes all real property. Those bills have varied in detail affecting scope of limitations, countries affected, and differentiating between individuals and corporations. Similarly, at the federal level there were several proposed measures introduced seeking to control, prohibit, restrict, or increase oversight on foreign investments in the U.S. agricultural sector.  As this issue continues to evolve in legislative spheres, it is important to stay abreast of the details of proposed state and federal legislation.

    Figure 1. Top 25 Foreign Countries by U.S. Farmland Ownership in 2020

    Reference:

    Foreign Holdings of U.S. Agricultural Land through December 31, 2020, by the Farm Service Agency and the Farm Production and Conservation Business Center, U.S. Department of Agriculture. Available at http://www.fsa.usda.gov/programs-and-services/economic-and-policy-analysis/afida/index


    Taylor, Mykel. “Foreign Investment in Agricultural Land.Southern Ag Today 3(20.3). May 17, 2023. Permalink