Blog

  • Brisket Prices on the Rise

    Brisket Prices on the Rise

    As cattle prices and the boxed beef cutout have increased, so have briskets.  Higher brisket prices are starting to hit restaurants and home BBQ’ers.  Fewer cattle going to market and tighter beef supplies will pressure beef prices for all cuts, briskets included. 

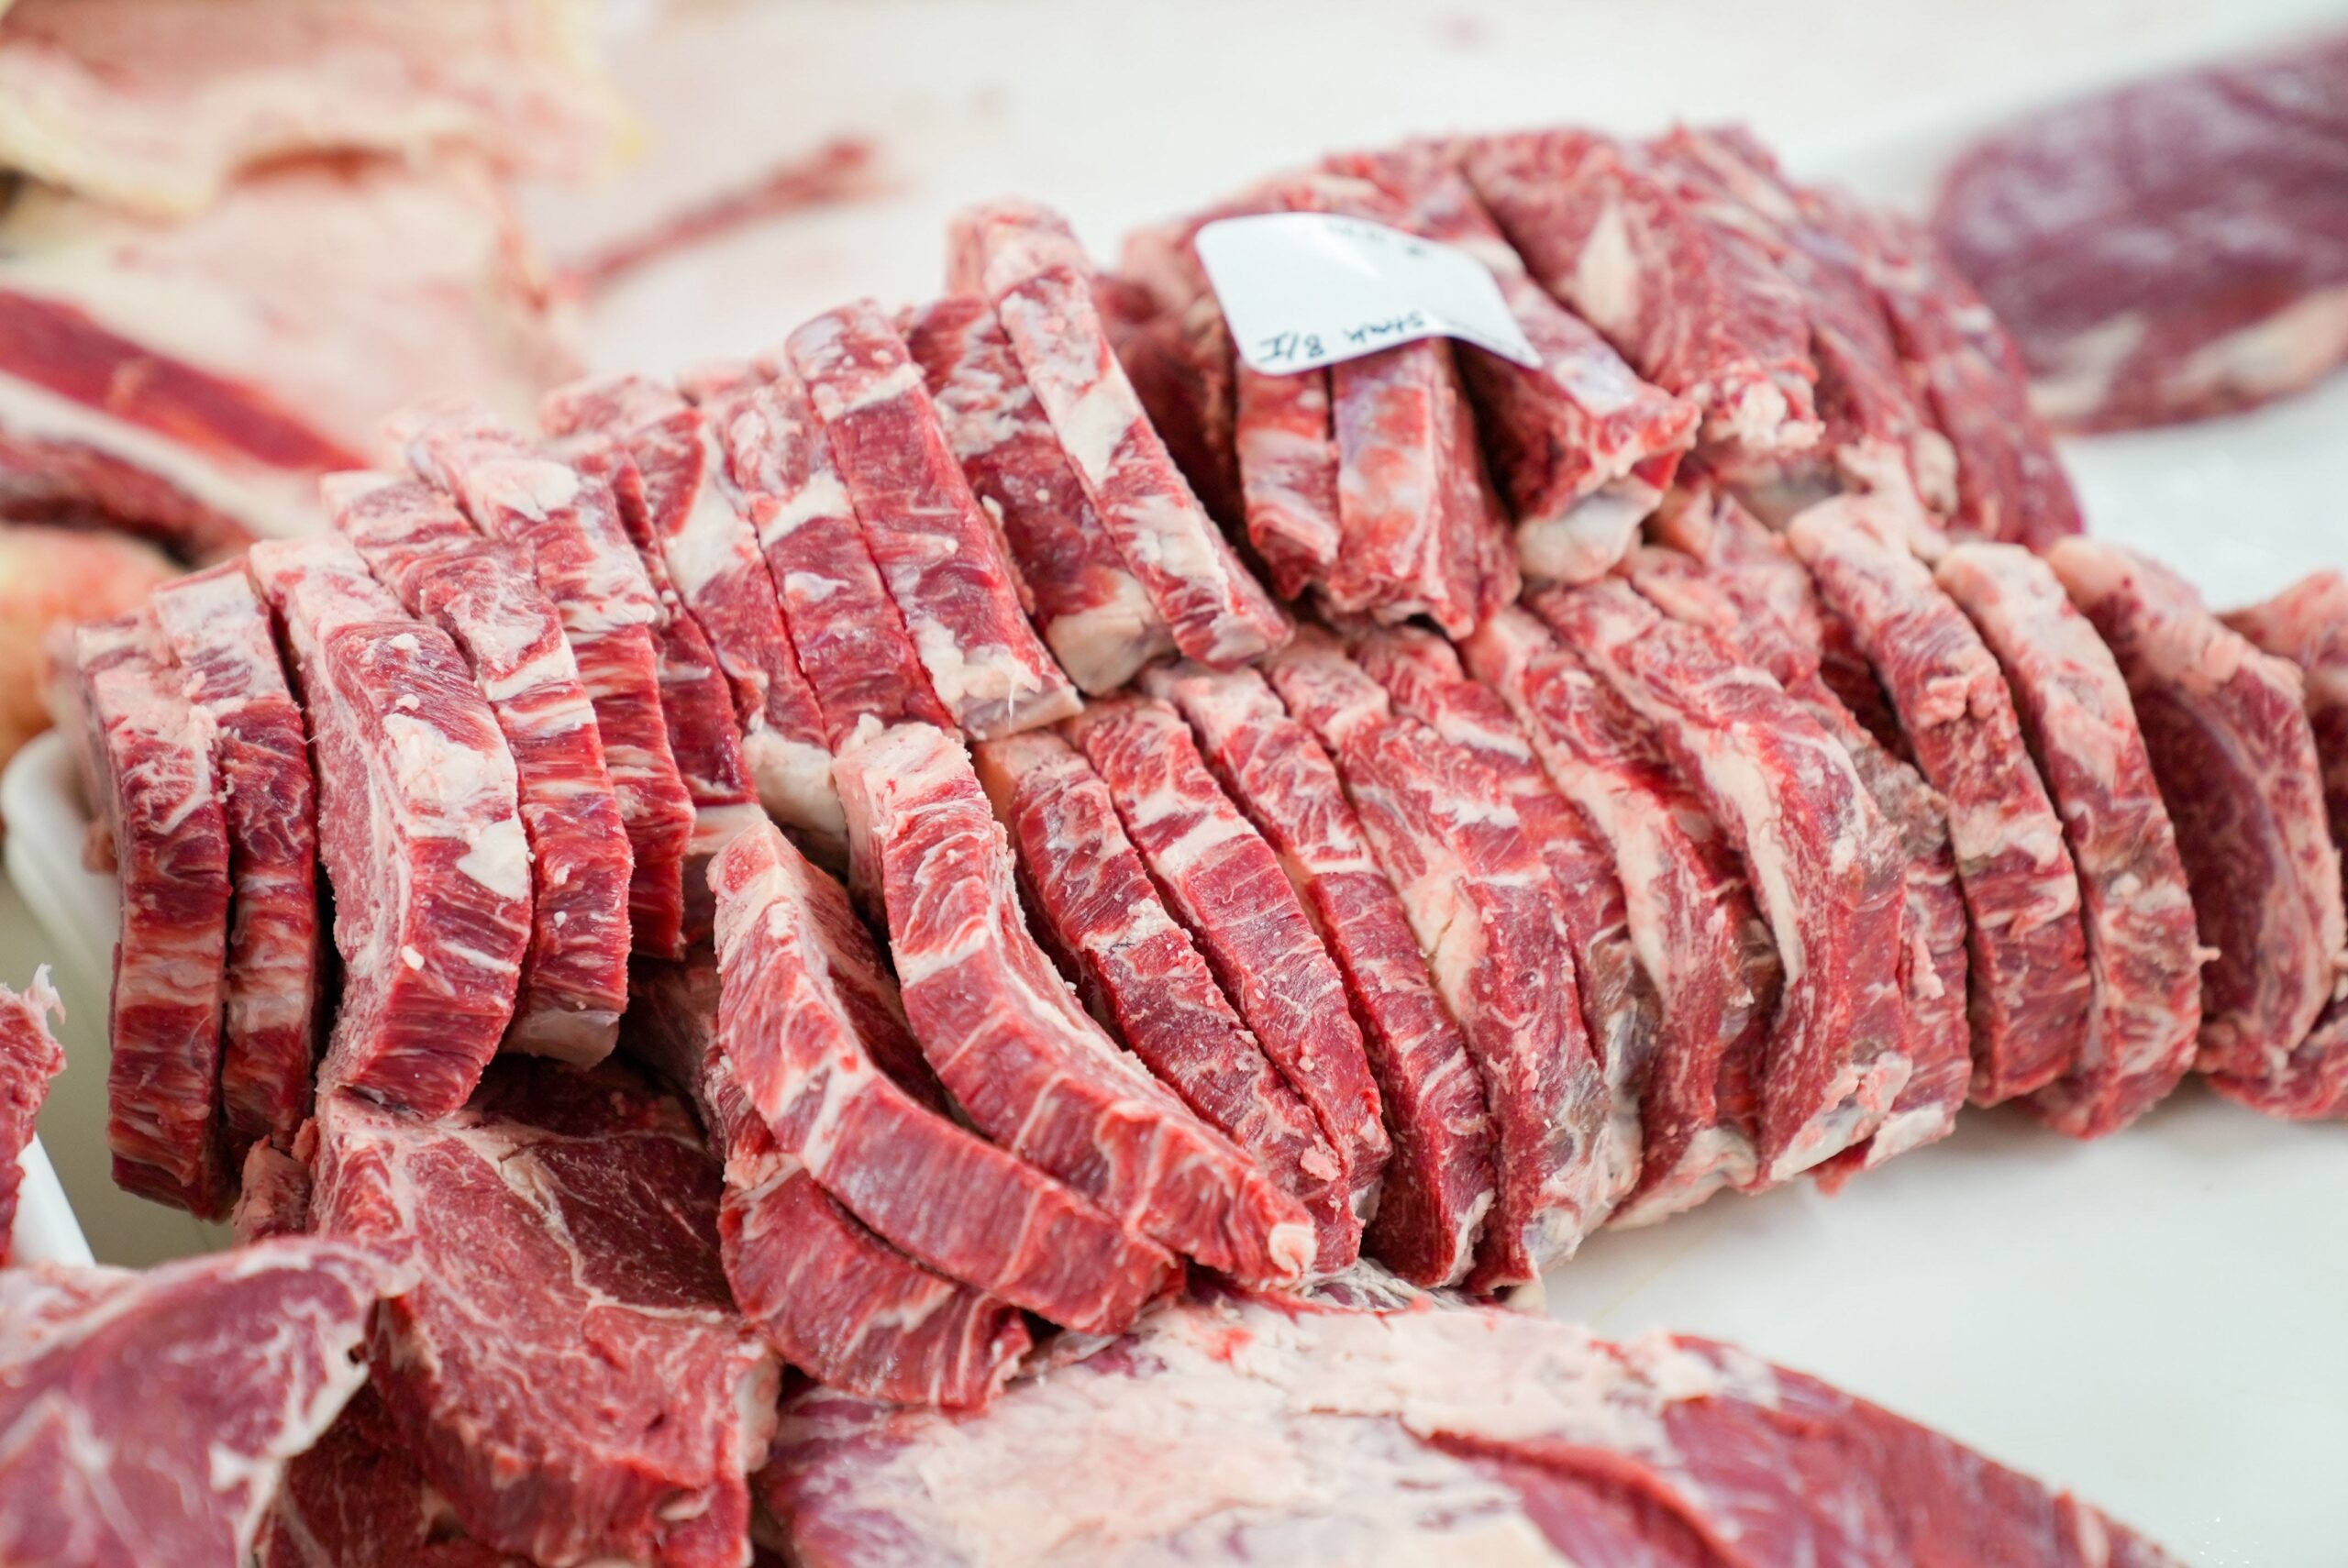
    For the year, through the week ending May 13th, beef production is down 4.7 percent compared to last year.  Steer slaughter is 4.7 percent below last year and heifer slaughter is 0.3 percent more than last year.  The number of cattle going to market is important for briskets because each animal has two and briskets are a cut that is often sold as the whole primal.  In addition, steer and heifer dressed weights are below a year ago, so total pounds of brisket available is further reduced. 

    Prime grade briskets were $2.43 per pound for the week of May 12th.  Even though price has come down 6 cents over the last 3 weeks it is 16 percent higher than the first of the year and 11 percent higher than a year ago.  Choice, branded, and Select quality grade brisket prices are up similar percentages to Prime since January and compared to a year ago.  

    Typically, branded briskets (briskets like certified angus beef or other brands) have the highest price meaning that other quality grades, including Prime, trade at a discount in the wholesale market.  Since February, Prime briskets have commanded the highest price in the market.  That price strength is likely related to slightly fewer cattle grading Prime and more Choice than a year ago.  Many smaller, high end BBQ restaurants source Prime and branded briskets due to their cooked qualities.

    What might we expect in our favorite brisket BBQ spots in coming months?  Tight beef supplies and reduced slaughter will keep the pressure on for higher prices.  Restaurants will face higher costs and their ability to pass those on in the form of higher prices might be limited.  Even though less beef is produced leading to higher prices, fears of a recession, reduced consumer incomes, and spending may limit the ability to pass on higher costs. 


    Anderson, David. “Brisket Prices on the Rise.” Southern Ag Today 3(20.2). May 16, 2023. Permalink

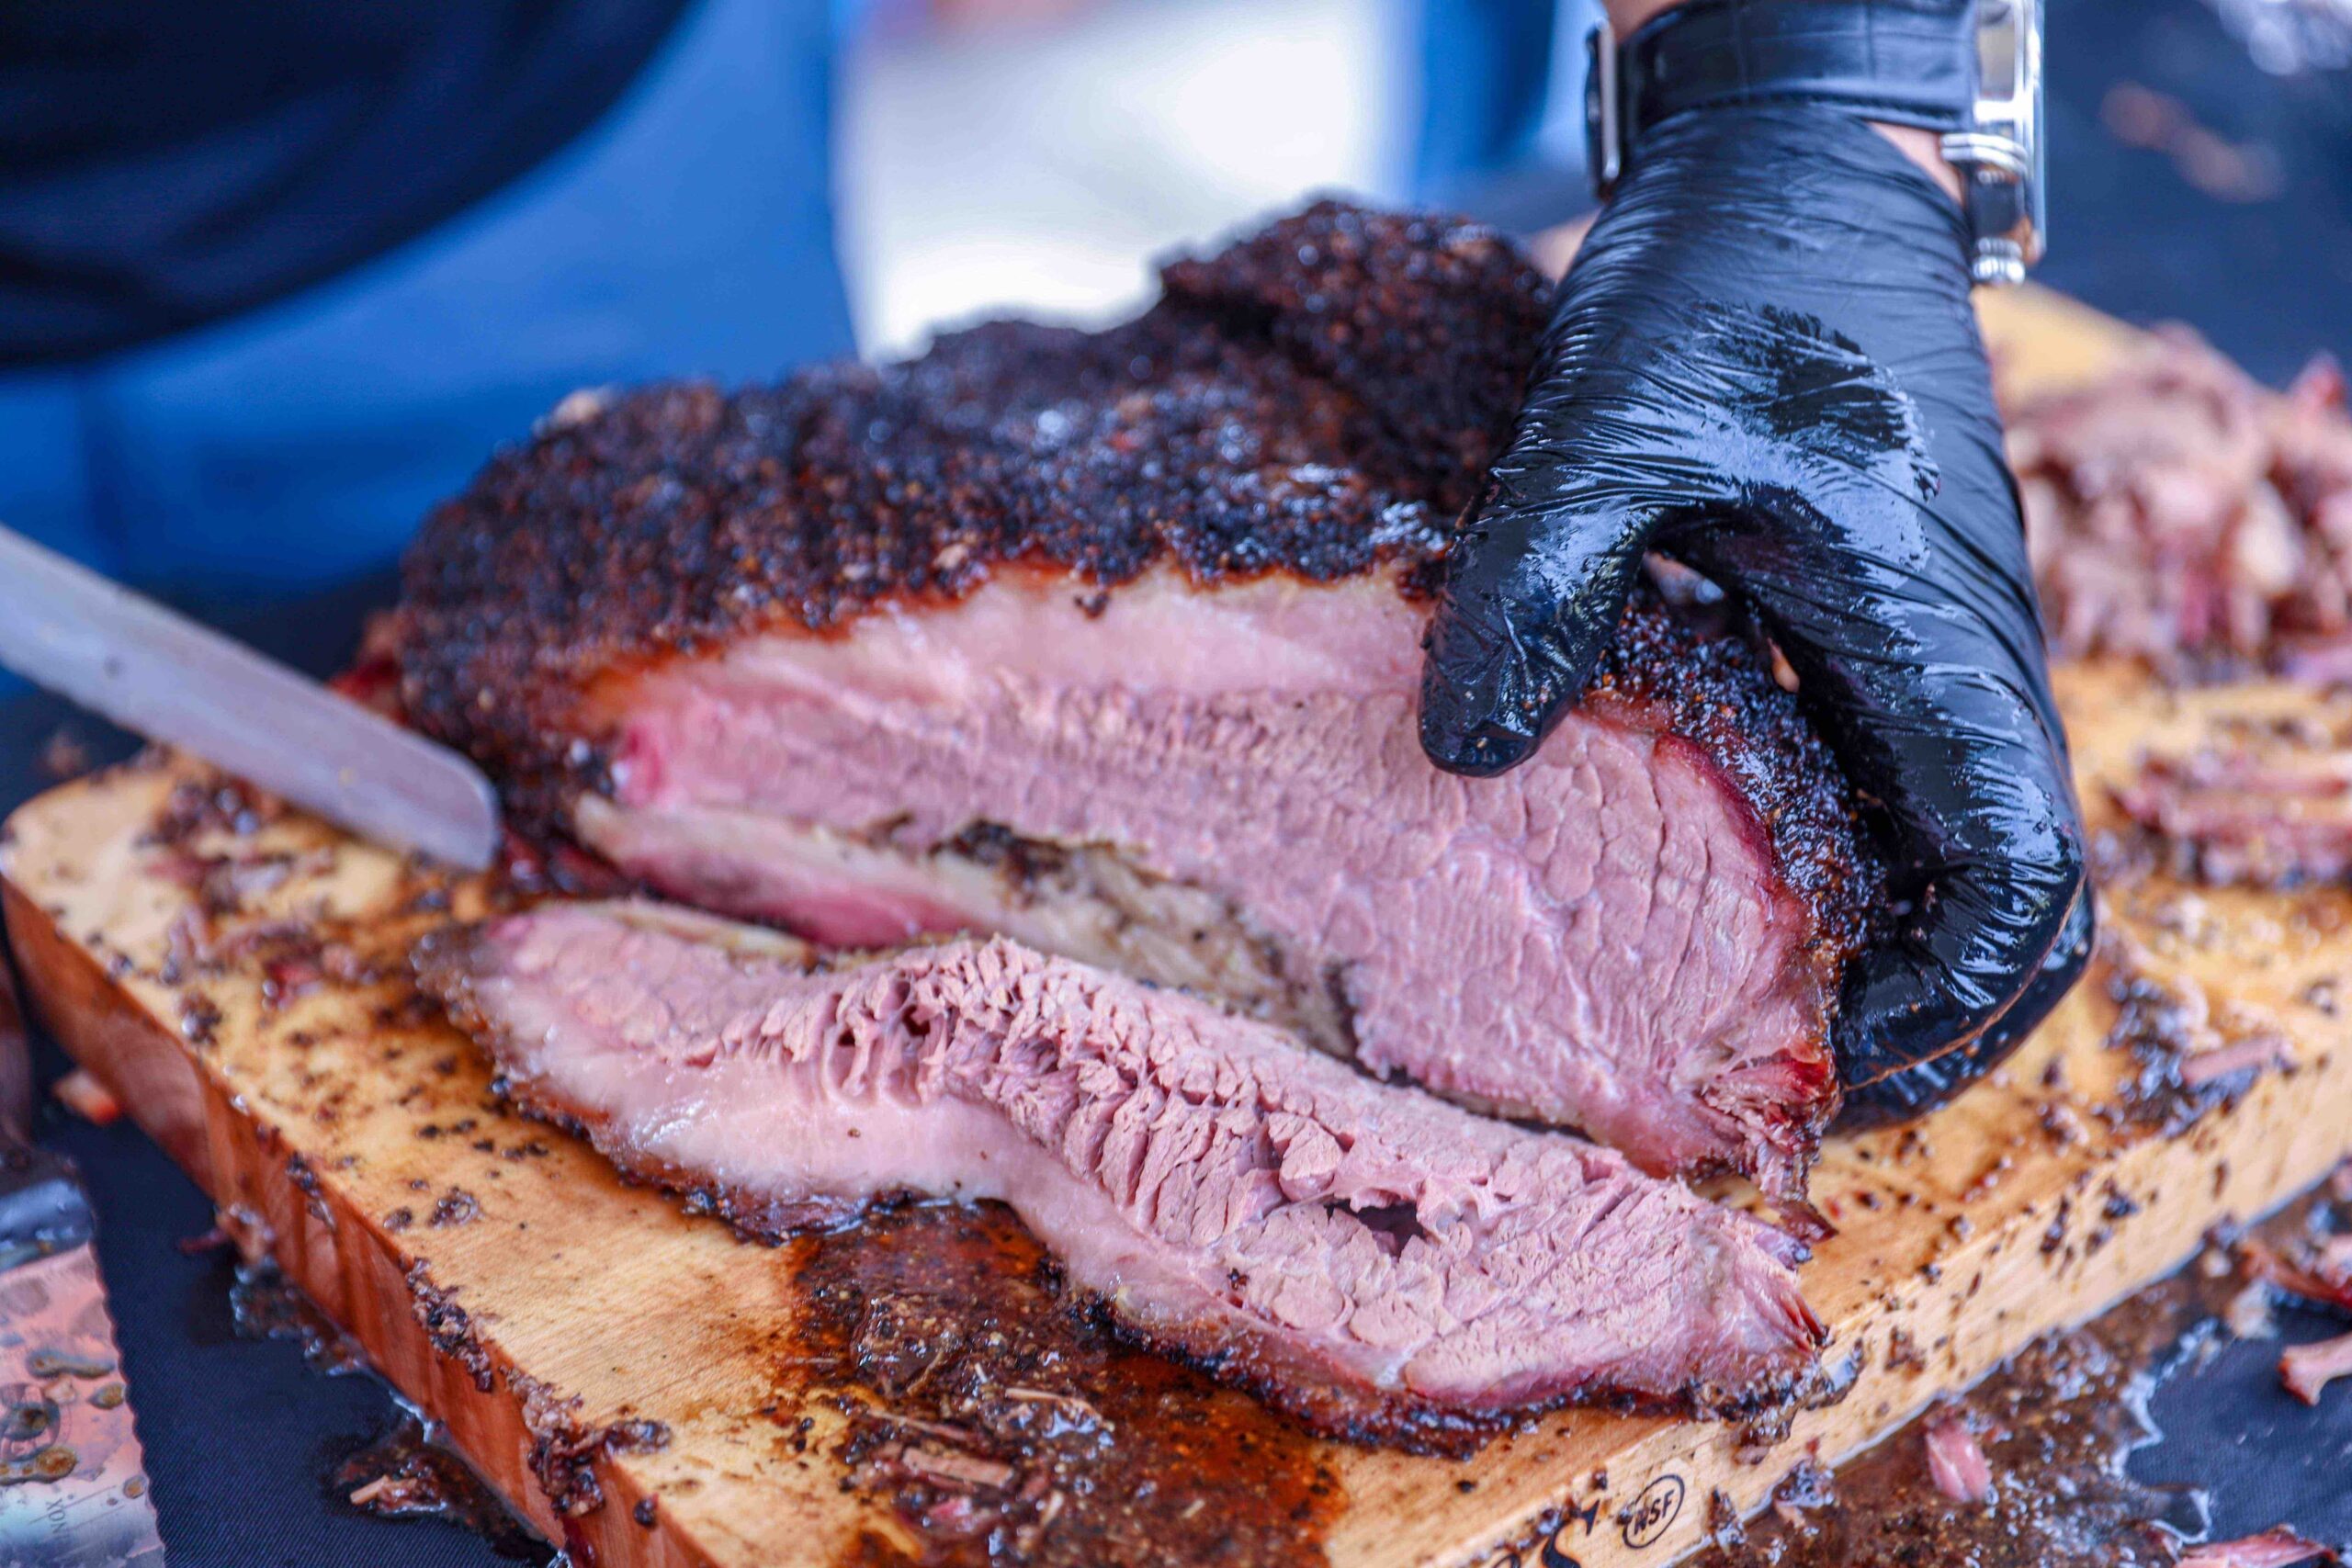
    Photo by Hayden Walker: https://www.pexels.com/photo/a-person-slicing-barbecue-beef-brisket-9397270/

  • Higher Supplies and Lower Prices Projected for U.S. Crops in 2023

    Higher Supplies and Lower Prices Projected for U.S. Crops in 2023

    On May 12th, USDA released the latest World Agricultural Supply and Demand Estimates (WASDE) report. The May WASDE is significant as it provides USDA’s first official projections for the 2023 marketing year. The report provides annual forecasts for the supply and use of various crops based on marketing years, which start August 1 for cotton and rice and September 1 for corn and soybeans. It should also be noted that projections for production are based on the acreage reported in the March 31st USDA Prospective Plantings report and yield forecasts based on trend models or historical yields depending on the crop. Thus, the projections in Table 1 and discussed below will change as the growing season and marketing year advance. 

    U.S. corn production is projected at 15,265 million bushels, based on 84.1 million harvested acres and a national average yield per harvested acre of 181.5 bushels. If realized, this would be a record yield and level of corn production. Combined with carryover stocks from last year, the total U.S. corn supply is projected to be 10% higher than in 2022. This supply increase is offset by a 5% increase in total use. Feed use is projected to increase by 375 million bushels, and ethanol to increase by 50 million bushels. Exports are projected to be up 18%, at 2,100 million bushels. Corn ending stocks are projected at 2,222 million bushels, a 57% increase from 2022. The average farm price is projected at $4.80 per bushel. 

    Like corn, U.S. soybeans are projected to see higher supplies and lower prices in 2023. U.S. soybean production is projected to be 4,510 million bushels, a 5% increase from 2022. Most of the production increase is due to a higher expected yield of 52 bushels per harvested acre – also a record if realized. On the demand side, domestic crushings are projected to increase by 90 million bushels from 2022, but exports are projected to decrease by 40 million bushels. With supplies outpacing demand, ending stocks are projected at 335 million bushels, a 56% increase. 

    U.S. cotton is projected to plant less acreage in 2023 but will see higher production than in 2022. The 2022 cotton crop saw a record level of abandonment, with 13.76 million acres planted but only 7.31 million acres harvested, mainly due to dry conditions in Texas. Currently, USDA projects 11.26 million acres planted with 8.71 million acres harvested. It will be important to keep an eye on acres abandoned as the year advances, with growing conditions in West Texas remaining dry. In the May WASDE, U.S. cotton production is projected at 15.50 million bales, a 7% increase from 2022. On the demand side, exports are expected to increase by 0.9 million bales to 13.5 million bales. With higher exports, cotton ending stocks are projected to decrease by 0.20 million bales to 3.30 million bales. The average farm price is projected to weaken to 78 cents per pound. 

    Lastly, the carryover of long-grain rice from 2022 is low at 16.8 million hundredweight but is more than offset by higher production. Long-grain rice production is projected to increase by 11% to 142 million hundredweight. Exports are expected to increase by 4.0 million hundredweight to 52 million, but any further expansion is expected to be challenged by competition from South America. Ending stocks are projected to remain flat at 16.8 million hundredweight, the same as in 2022. Like other crops, the average farm price is projected lower to $15.00 hundredweight. Unlike other crops, though, the long-grain rice price is projected to remain above its 2021 price. 

    Overall, the USDA WASDE report projects a bearish supply and demand picture and lower prices compared to last year. There remains a large amount of uncertainty for the 2023 crop; however, USDA’s initial projections indicate lower prices for many southern row crops. Actual planted acreage, weather, and crop growth are some of the main factors that will determine if lower prices becomes a reality.


    Maples, William E. “Higher Supplies and Lower Prices Projected for U.S. Crops in 2023.Southern Ag Today 3(20.1). May 15, 2023. Permalink

  • Beef Custom Harvest Agreement Considerations  

    Beef Custom Harvest Agreement Considerations  

    Many cattle producers utilize a custom-exempt processing facility in their direct-to-consumer businesses. In this scenario, the producer sells a live calf (or fractional share thereof) to the consumer and then delivers the live animal to the custom-exempt facility, where it will be processed for the purchaser.  

    Anyone using this approach should have a custom harvest agreement to memorialize the contractual agreement between the producer and purchaser. 

    The following topics should be considered when drafting a custom harvest agreement:

    • Description of product being sold.  Be clear in the agreement that it is the live animal being sold to the consumer, not the processed beef.  Be clear on what percentage of the animal the customer is purchasing. If selling a specific animal, be sure to include the ear tag number or other description of the animal.
    • Educational information.  Include information a purchaser may not realize, such as the difference between the live animal weight and boxed beef weight, the amount of freezer space needed for a full, half, or quarter beef, and a sample cut sheet.
    • How will payment be calculated?  Describe how the price for the animal will be calculated, such as a flat fee or price per pound.  If per-pound, will it be calculated on the live weight or hanging weight of the animal? 
    • When and how will payment be due?  Detail any required deposit amount. Set payment deadlines. Identify allowable payment methods. 
    • Processing fees.  Typically, the purchaser pays the processor directly, and this should be spelled out in the agreement. 
    • Reselling/donating meat from the animal is prohibited.  Make clear in the custom harvest agreement that due to federal law, the beef from this animal may not be resold or donated.  
    • Point at which animal is property of the buyer.  Make clear at which point in time the animal officially becomes the property of the buyer.  Certainly, this has to be done at least by the point in time when it is delivered to the custom processing facility but could be as early as when the initial deposit is made.  This is important in the event of the death of an animal prior to delivery to a processing facility. 

    A custom harvest agreement provides important information to the purchaser and ensures both parties are on the same page about the sales transaction. For more information on direct-to-consumer beef sales, click here.


    Lashmet, Tiffany. “Beef Custom Harvest Agreement Considerations.Southern Ag Today 3(19.5). May 12, 2023. Permalink

  • Analyzing the Relative Riskiness of Rice Yields

    Analyzing the Relative Riskiness of Rice Yields

    Two of the primary risks faced by any producer at any point in time are production and price risk. In agricultural crop production, farmers must deal with the risk of crop yield losses due to several causes of loss such as excess rainfall, drought, and pest pressure via parasitic insects or weed populations. While all crops grown in the U.S. are exposed to these risks, the effect that these risks have on crop yield is not the same for all crops. Understanding the differences in the production of each crop and the risks faced by each crop is important for risk management as this information informs which tools a producer will need to select to minimize losses and stabilize their farm income year-to-year. In this article, we evaluate the relative riskiness of rice to other principal crops grown in the midsouth region to better inform a producer’s risk management strategy and provide implications for policymakers evaluating risk protection programs in the upcoming farm bill.

    We compare the relative yield risk of rice production to corn, soybean, and cotton production by considering the state-specific coefficient of variation (CV) for the yield of each crop as a measure of relative yield risk. Put simply, the CV is a measure of how much yield across a given state varies relative to the average yield of that state. The CV allows us to make comparisons between different crops and counties to assess if one crop is more or less risky to grow than another crop in a specific state. We used state-level data[1] from 2007-2022 (USDA-NASS, 2023) and removed a linear time trend from each crop yield in each state to account for changes in technology and production practices in each state over time.

    Figure 1 gives the state-specific ratio of the CV for corn relative to the CV for rice. This ratio of two CVs tells us how much more, or less, risky corn yield is relative to rice yield. For example, in Arkansas the ratio of 1.62 implies that it is about twice as risky to grow corn relative to rice in that state.  Figure 2 gives the state-specific ratio of the CV for soybeans relative to the CV for rice. Using Mississippi as an example, the ratio of 4.92 implies it is nearly 5 times riskier to grow soybeans than rice in that state. Finally, Figure 3 gives the ratio comparing CVs for upland cotton to CVs for rice with ratios ranging from nearly 2 to a little over 5 indicating it is nearly 2-5 times more risky to grow cotton than it is rice in the states considered.  

    There are several other levels of relative riskiness across rice-producing counties in the midsouth, but the same message generally holds: rice yield risk is relatively lower than the yield risk of its competing crops in the midsouth. This becomes important when deciding between risk management strategies that focus on production risk or price risk. Due to the lower rice yield risk, programs such as the Price Loss Coverage (PLC) may be more advantageous to rice producers than programs like the Agriculture Risk Coverage (ARC) program, which also helps explain why rice producers have overwhelmingly favored PLC. 

    Figure 1. Ratio[1] of the CV for Corn Yield to the CV for Rice Yield (2007-2022)

    [1] The Coefficient of Variation (CV) is the ratio of the Standard Deviation to the Mean of each state and crop yield distribution. The plots in Figures 1-3 gives the ratio of two CVs. The state-specific values plotted are not CVs. 

    Figure 2. Ratio of the CV for Soybean Yield to the CV for Rice Yield (2007-2022)

    Figure 3. Ratio of the CV for Upland Cotton Yield to the CV for Rice Yield (2007-2022)

    [1] We note that while we are unable to distinguish between irrigated and nonirrigated yields across time, USDA-NASS provides a breakdown of the shares of irrigated and nonirrgated acres in Table 34 of the 2017 Agricultural Census. The portions of acres irrigated in Arkansas for corn, soybeans, and cotton is 93%, 85%, and 93%, respectively. The same irrigated portions in Mississippi are 81%, 74%, 74%. The irrigated portions for Louisiana are 78%, 68%, 60%. The irrigated portions for Texas are 84%, 83%, and 52%.

    References

    USDA-NASS. (2023, May 10). USDA-NASS 2017 Agricultural Census. Retrieved from https://www.nass.usda.gov/Publications/AgCensus/2017/Full_Report/Volume_1,_Chapter_1_State_Level/

    USDA-NASS. (2023, April 20). USDA-NASS QuickStats. Retrieved from https://quickstats.nass.usda.gov/


    Biram, Hunter, and Brian E. Mills. “Analyzing the Relative Riskiness of Rice Yields.Southern Ag Today 3(19.4). May 11, 2023. Permalink

    Photo by Polina Tankilevitch: https://www.pexels.com/photo/close-up-photo-of-assorted-rice-4110255/

  • Economic Uncertainty and Ways to Prepare for the Worst

    Economic Uncertainty and Ways to Prepare for the Worst

    The overall farm financial health remained resilient and strong in the past few quarters. The agricultural loan default rates for both production and farmland loans have decreased in 2022. Observation from the Farm Credit Administration (FCA) also shows that the percentage of nonperforming loans is at 0.47%, a very low number compared to previous years. The total number of farm bankruptcy cases (Chapter 12 bankruptcies) was 169 in 2022, the lowest number since 2004. However, the outlook appears less positive.

    Source: USDA ERS

    We just began the first quarter of 2023 with great uncertainty. On April 28th, it was reported that the GDP growth rate in the U.S. slowed considerably. The annualized rate of growth was only 1.1%, half of what was forecasted. March inflation rate was higher than the expectation and reached 4.2%. There are signs of recession, including the yield curve inversion observed in the U.S. treasury. There have been massive layoffs in the tech sector, reduced corporate investments, and major bank failures on the West and the East coasts. 

    The agricultural sector is expected to be affected by these uncertainties. USDA’s forecast made earlier this year shows net farm income is predicted to drop significantly in 2023, by more than 13%. If we do enter a recession and consumers tighten their budgets, there is a possibility that the impact will be even more severe and extend beyond 2023.

    What can we do in the face of all these economic uncertainties? If the farm business is expected to be under financial stress in the worst-case scenarios, taking certain actions can lessen the impact. These actions fall into three strategies to improve the financial situation of the farm business.

    Managing Cash Flow

    Control costs. Reducing costs is an ongoing challenge for agricultural producers. Evaluate all procedures and purchases and seek ways to improve cost efficiency. 

    Reduce or postpone capital purchases and family withdrawals. Critically evaluate purchases and consider repairing for another year rather than replacing.

    Other income sources. Consider ways to leverage any excess capital and labor. For example, do you have the equipment/labor/time to provide custom work for other producers?  

    Marketing.  Sharpen your marketing plan, and be ready to act on opportunities to lock in profitable prices. 

    Renegotiate leases. Approach the landlord with a proposal to reduce the lease payment or shift from a cash lease to a shared lease agreement.

    Managing Liabilities

    Renegotiate loan terms. Extending loan terms will ease cash flow pressures by lowering loan payments. Refinancing carryover debt or paying interest only for a short term could be negotiated. 

    Reduce debt. Reducing debt will certainly relieve some financial stress, but be careful about sacrificing valuable working capital. Although not easy to find, outside equity investment may be a viable source of capital and/or debt reduction.

    Refinance. Carefully weigh the advantages of extended loan terms vs. today’s higher interest rates.  Refinancing may not save as much as expected.  If the broader economy moves into recession, watch for declining interest rates and future refinancing opportunities.

    Managing Assets

    Liquidate cash and investments. If the farm business has maintained a financial reserve of cash or investments, this may be the time to use it to reduce or avoid debt.

    Sell inventory and capital assets. If the farm business is holding inventory and waiting for higher prices, consider selling that inventory to reduce debt. If you can do it without affecting operations, selling land or equipment that is seldom used may be a good strategy to generate funds.


    Kim, Kevin, and Brian E. Mills. “Economic Uncertainty and Ways to Prepare for the Worst.Southern Ag Today 3(19.3). May 10, 2023. Permalink

    Photo by Mikhail Nilov: https://www.pexels.com/photo/a-person-typing-on-laptop-7731373/