Using social media content to grow an agribusiness should not be a mystery, but for most, it is. Often, the problem is that the content produced does not grab followers’ attention. When that happens, followers ignore the content.
But recent research shows how to create social media content to get attention and engagement. The solution is to avoid critical mistakes when creating content (Barnes, 2020).
One common mistake is agribusiness companies don’t explain that they solve a specific problem for customers. How do you write this type of content? Here’s an example post from a Mississippi agribusiness company calledHogEye Trap Cameras. This Facebook post reached more than 10 million followers:
Are you frustrated because you can’t stop feral hogs from destroying
your land, property, and habitat?
Now let’s see why the post attracted attention and engagement. [Frustrated] is the negative feeling landowners have. {Can’t stop feral hogs} is the problem. [Destroying your land, property, and habitat] are the economic losses. In a few words, this post asks landowners if they have this problem. If they do, they will keep reading. The rest of the post highlighted the solution this company sells and the savings that will accrue if customers buy, namely the economic value of stopping feral hog damages.
Talk about the problem you solve for your customers. It’s the easiest way to hook followers’ attention.
Want to learn how to avoid more mistakes and create social media content to grab your followers’ attention? Access the marketing resources provided by the Bricks-To-Clicks® Marketing Extension Program at Mississippi State University, including Dr. James Barnes’ new book and courses, or listen to the podcast. Get more customized help here.
References
Barnes, J. 2020. 5 Social Media Mistakes Your Business Should Avoid: A Step-By-Step Guide to Help You Grow Your Business [Amazon Kindle & Audible]. Mississippi State University Extension.
The Risk Management Agency (RMA) is responsible for rating crop insurance in an actuarially sound way. Unlike private insurance companies, RMA is not driven by profit when determining rates. Premium rates do not include the cost of sales, underwriting, loss adjustments, or the operating costs of RMA. Legislative language instructs that “the amount of the premium shall be sufficient to cover anticipated losses and a reasonable reserve[1].” RMA considers actual production history in the rating process, and rates are established independently of crop and geographic region. The loss experience of rice is not a factor when developing a premium rate for corn. Likewise, the loss experience of corn in Mississippi is not a factor when developing a premium rate for corn in Illinois.
The politics of crop insurance comes into play with the premium subsidy percentage amounts set by policy. Subsidy percentages are equitable across all crops, though, with each crop receiving the same subsidy percentage dependent on coverage level and unit choice. Total acres insured, coverage level, and premium rates all factor into the total amount of subsidies received by a crop. As seen in Figure 1., corn has received a total of $24.6 billion of crop insurance subsidies in the past decade, followed by soybeans at $14.9 billion. Rice and peanuts have total subsidy amounts of $617 million and $424 million, respectively, over the past decade.
Crop insurance performance is often judged by loss ratios. A loss ratio is simply calculated as indemnity payments divided by total premium. A loss ratio of 1.0 means that indemnity payments equaled total premiums. A loss ratio greater than 1.0 means indemnity payments exceed premiums, and a loss ratio less than 1.0 means total premiums exceed indemnity payments. The Risk Management Agency (RMA) is statutorily mandated to achieve a target loss ratio of 1.0. While loss ratios can fluctuate year-to-year, the national and crop-specific ratios have been trending down since 1989, as seen in Figure 2. Interestingly, many crops have trended down at similar rates. Rice, cotton, wheat, soybeans, and the national total have similar sloping trend lines. Corn has trended down but at a slower rate than the previously mentioned crops. Peanuts have seen the most dramatic decrease in the trend of any crop.
Figure 1. Total 10 Year Subsidy Amount by Crop, 2013-2022
[1] Coble, K. H., Knight, T. O., Goodwin, B. K., Miller, M. F., Rejesus, R. M., & Duffield, G. (2010). A comprehensive review of the rma aph and combo rating methodology: Final report. Prepared by Sumaria systems for the risk Management agency.
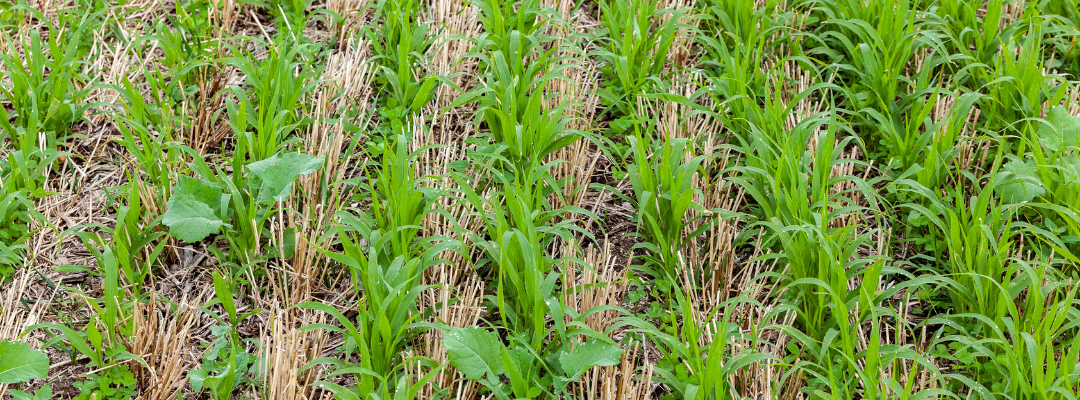
Large-scale ecosystem benefits tend to drive policy interest in cover crops. However, incorporating cover crops in a farm management plan will also require them to generate on-farm returns. To date, findings of their ability to generate profits have been mixed with inconsistent results across several studies. However, returns in a broad sense of cover crops include potential impacts on risks in addition to their effect on profits. A year of substantial loss savings can offset or justify years of minimal to slightly decreased net profit outcomes. Especially true in areas where crop prices are countercyclical to yields. Therefore, if or how cover crops help manage risk is an important consideration for their inclusion in a farm management plan.
Cover crops and their ability to reduce soil erosion and provide increased root infiltration into the soil have been studied in the context of managing specific risks, extreme wet and extreme dry (drought) conditions. Roughly 83% of total crop insurance losses in the Mid-South were related to one of these two events with 70% being excess moisture related and the majority of those from prevented planting. Regarding extreme moisture risks, most studies indicate that cover crops reduce crop damage under specific conditions. Where nutrient leeching is an issue, which may be a feature on some irrigated fields, cover crops, particularly grass cover crops, have been found to reduce corn yield losses during extreme moisture events because of higher available carbon during the growing season. A study in Northeast Mississippi showed reduced effects of excess moisture in corn-soybean rotation fields. However, some studies also show that cover crops can create early season planting challenges getting the cash crop planted in wet fields. The additional time required to terminate the cover crop may not allow sufficient time to get the cash crop planted and established. This is especially true in conventional tilling systems and where planting green (planting the cash crop in a living cover crop) is not possible.
In NRCS Zone 4 cover crop regions, the effects of cover crops in drought conditions seemed to be more consistent. The findings suggest that cover crops reduced soil compaction, increased root infiltration, and in general, led to increased water availability for the cash crop, reducing drought damage. More studies are needed in the mid-south, but a few studies observing farmers in the Midwest during the 2012 drought saw farms with cover crops experiencing an eleven (11) percentage point increase in yields relative to farms without cover crops.
Overall, cover crops show potential for risk management, particularly for managing drought risk. However, outcomes appear to be highly related to the suite of management practices on the farm, such as the cover crop variety used, whether combined with no-till, the ability to plant green, and the planting dates of the cash crop in question. In the mid-south, a cover crop before planting cotton or soybeans may be more feasible than a cover crop before planting corn when considering planting dates and early season weather risks. Nevertheless, where risk management rather than yield is the goal, a conversation with a local agronomist may help determine whether cover crops may be a good consideration as a long-term risk management tool on your farm.
Mid–South Causes of Indemnities Crop Insurance: 2015 – 2020
Source: RMA Summary of Business
References:
Bergtold, J., Ramsey, S., Maddy, L., & Williams, J. (2019). A review of economic considerations for cover crops as a conservation practice. Renewable Agriculture and Food Systems, 34(1), 62-76. doi:10.1017/S1742170517000278
Bharat Sharma Acharya, Syam Dodla, Lewis. A. Gaston, Murali Darapuneni, Jim J. Wang, Seema Sepat, Hari Bohara, Winter cover crops effect on soil moisture and soybean growth and yield under different tillage systems, Soil and Tillage Research, Volume 195, 2019, 104430, ISSN 0167-1987, https://doi.org/10.1016/j.still.2019.104430
Blanco-Canqui, H., Shaver, T.M., Lindquist, J.L., Shapiro, C.A., Elmore, R.W., Francis, C.A. and Hergert, G.W. (2015), Cover Crops and Ecosystem Services: Insights from Studies in Temperate Soils. Agronomy Journal, 107: 2449-2474. https://doi.org/10.2134/agronj15.0086
Chalise, K.S., Singh, S., Wegner, B.R., Kumar, S., Pérez-Gutiérrez, J.D., Osborne, S.L., Nleya, T., Guzman, J. and Rohila, J.S. (2019), Cover Crops and Returning Residue Impact on Soil Organic Carbon, Bulk Density, Penetration Resistance, Water Retention, Infiltration, and Soybean Yield. Agronomy Journal, 111: 99-108. https://doi.org/10.2134/agronj2018.03.0213
G.S. Marcillo and F.E. Miguez, Corn yield response to winter cover crops: An updated meta-analysis, Journal of Soil and Water Conservation May 2017, 72 (3) 226-239; DOI: https://doi.org/10.2489/jswc.72.3.226
In the areas of the Southern U.S. that received adequate rainfall this spring and summer, grazing warm-season annual forages have remained an economically viable option for many.
A warm-season annual forage mix was planted on April 20th containing several species (Sorghum-Sudangrass, Pearl Millet, Forage Sorghum, Cowpeas, Sunn Hemp, etc.). It received 50 pounds of nitrogen (N) fertilizer in one application after planting. Stocker steers weighing 625 lbs. began grazing on June 5th and are expected to graze for 120 days, finishing around October 5th. During the growing season, forage quality was tested at 65% total digestible nutrients (TDN) and 15% crude protein (CP).
The following are our expectations for our warm-season annual forage mix:
Forage Production: 8,000 DM lbs./acre,
Level of Forage Utilization: 40%
Production Costs: $175/acre
The table below provides a detailed view of the variables and equations used to determine the total cost of growing and grazing a warm-season annual forage mix per dry matter ton consumed. The resulting total cost of growing and grazing warm-season annual forages was $109/DM ton consumed.
It’s important when making the comparison to other feedstuffs, such as Soyhulls (77% TDN, 13% CP, $255/ton) or Corn Gluten (80% TDN, 22% CP, $260/ton) to factor in the cost to store, mix, and feed, as well as any waste that occurs.
For those that have the resources and management to grow and graze warm-season annual forages, I don’t think there are any readily available feedstuffs that can compete. Every ranch is different. Play with the numbers and see if grazing warm-season annual forages will work for your operation.
The 2023 winter wheat crop will soon be going in the ground. As planning and preparations are under way, producers continue to struggle with the challenges of high input costs, volatile commodity markets, weather extremes (drought in the west, flooding in the east), and global geopolitical instability.
As many input costs are being locked in, an important question is where do output prices go from here? A key tenet of economic theory provides insight into that question. In 1890, Lord Alfred Marshall told us where prices are going in the long run: prices will go to the cost of production (Marshall, 1890). In a free market economy, a price above the cost of production will provide incentives for an increase in supply or entice other entrants into the market. Prices below the cost of production will cause supply to decrease or participants to exit the marketplace.
Successful and sustainable financial performance in an economy where prices move to the cost of production implies two key components of management strategy that revolve around production and price:
Be the low cost/high quality producer. Input use efficiency is critical to achieve the lowest possible breakeven cost. Tools to achieve this goal include the use of crop rotations, hybrid and variety selection, conservation tillage, soil, and plant testing, and precision application of inputs.
Lock in profitable prices. Tools of financial management include budgets and breakeven analyses, cash flow projections, crop insurance, marketing plans, and price safety net provisions.
Does this management approach work? Evidence of the impact of these management strategies can be found by looking at the financial performance of the top 20 percent of corn producers over the last several years. This information can be found in the FINBIN database (FINBIN, 2022). This database summarizes actual farm data from thousands of agricultural producers.
Sorting key production and price characteristics by financial performance shows that, compared to the overall average, the top 20 percent of corn growers in 2021 had higher yields, received higher prices, and had lower costs (Figure 1). Looking back over the last several years, this group, the top 20 percent, outperformed the average every year in every category with one lone exception. In 2018, the average of all corn producers received a one percent higher price (Figure 2).
As a farm management philosophy, consider the adoption of what Danny Klinefelter, retired professor in the Department of Agricultural Economics at Texas A&M University and founder of The Executive Program for Agricultural Producers (TEPAP), calls the ‘5% rule’ (Janzen, 2018). In the upcoming crop year, where can I lower my costs by five percent? How can I increase my yields by five percent? How can I increase my average price received by five percent? Making relatively small changes in critically important areas over time can have a dramatic impact on financial performance.
Figure 1. 2021 Corn on Cash Rent Summary Report
FINBIN(2022) Center for Farm Financial Management: University of Minnesota.
Figure 2. Corn on Cash Rent Summary Report Comparisons, High 20% to Overall Average, 2018-202
FINBIN(2022) Center for Farm Financial Management: University of Minnesota.
References
FINBIN. Center for Farm Financial Management, University of Minnesota. Accessed August 1, 2022 and available at https://finbin.umn.edu/.
Janzen, Joseph. “The “5% rule of farm management shows how all the pieces matter”, Department of Agricultural Economics and Economics, Montana State University, Business and Finance posts, January 16, 2018. Accessed August 2, 2022 and available at https://ageconmt.com/.
Marshall, Alfred. Principles of Economics, London: Macmillan, 1890.