Blog

  • Tax Tips for Forest Landowners

    Tax Tips for Forest Landowners

    From planting trees to conducting timber sales, there are many things for landowners to consider when owning a timber property. Many forest landowners think about taxes only after they had a timber sale. However, there could be tax implications for each timber activity. It is important to conduct tax planning carefully. 

    Here are a few tax tips for forest landowners to consider.

    1.         Know the classification of your timber holding

    Your timber holding classification is the first step in figuring out the federal income tax consequences of your timber activities. The classification determines which tax rules are applicable. Timber holding generally could be classified as one of the following three types: 1) property for personal use or as a hobby (not-for-profit); 2) property held as an investment; or 3) property held in a trade or business. Generally, you will get the best tax advantages if you materially participate in a timber business.  

    2.         Understand timber sale income and capital gains tax

    When you have a timber sale, you are taxed on the net income, rather than the gross proceeds. You are allowed to subtract selling expenses, timber depletion allowance, and yield tax from the revenue to get the net taxable gain. In most cases, the income from a standing timber sale is taxed at favorable long-term capital gains tax rate (0%, 15%, or 20% depending on the taxable income) if the timber has been owned for more than one year. If your timber is inherited, the gain is considered long-term in nature regardless of how long you have owned the timber. 

    3.         Take advantage of the reforestation tax incentives

    Eligible forest landowners may deduct up to $10,000 (married filing jointly) in qualifying reforestation expenditures per year per qualified timber property and amortize the rest over 8 tax years. You make the deduction against taxable income from all sources. 

    4.         Recover operating expenses and carrying charges

    If you materially participate in the timber business, you can fully deduct ordinary and necessary expenses associated with carrying on the business. For 2018 through 2025, forest landowners who hold timber as an investment are not allowed to deduct eligible operating expenses as itemized deductions. You may consider capitalizing (adding to basis) certain forest management expenses and carrying charges with proper tax elections. Timberland property taxes can still be fully deducted if you itemize. 

    5.         Keep track of timber basis

    Timber basis is generally the amount of capital investment in the timber. If the forestland was purchased, the original timber basis is the amount of the total acquisition costs allocated to the timber. If the property was inherited, the timber basis generally is its fair market value on the decedent’s date of death. If the property was received as a gift, the basis is generally the donor’s basis plus the gift tax. 

    6.         Claim timber casualty loss deduction when a natural disaster hits

    Timber loss caused by a casualty event (e.g., hurricane, storm, fire) may be tax-deductible. A forest landowner may deduct the lesser of the basis or the decrease in the fair market value of the affected timber block caused by the casualty.

    7.         Consider excluding cost-sharing payments

    Some conservation-oriented cost-sharing payments from qualified government programs qualify for partial or full income exclusion.  

    8.         Take advantage of the Qualified Business Income (QBI) deduction if applicable

    If your timber business has received ordinary income from selling cut timber products, pine straw, live trees, or other products, you may consider taking the QBI deduction. It is available for tax years 2018 through 2025. 

    9.         Smooth out timber income over years

    You may consider using an installment sale approach (lump-sum contract) or a pay-as-cut contract to smooth out your timber income over several years if such an arrangement can minimize total taxes. 

    For more details on these tax tips as well as others, please see the publication: https://www.timbertax.org/publications/fs/taxtips/TaxTip2021.pdf.

    Disclaimer

    The material herein is for general informational and educational purposes only and is not intended as financial, tax, or legal advice. Please consult with your tax advisor for advice concerning your particular tax situation. 

    Li, Yanshu. “Tax Tips for Forest Landowners“. Southern Ag Today 2(10.3). March 2, 2022. Permalink

  • Marketing Feeder Cattle at 6-Year Price Highs

    Marketing Feeder Cattle at 6-Year Price Highs

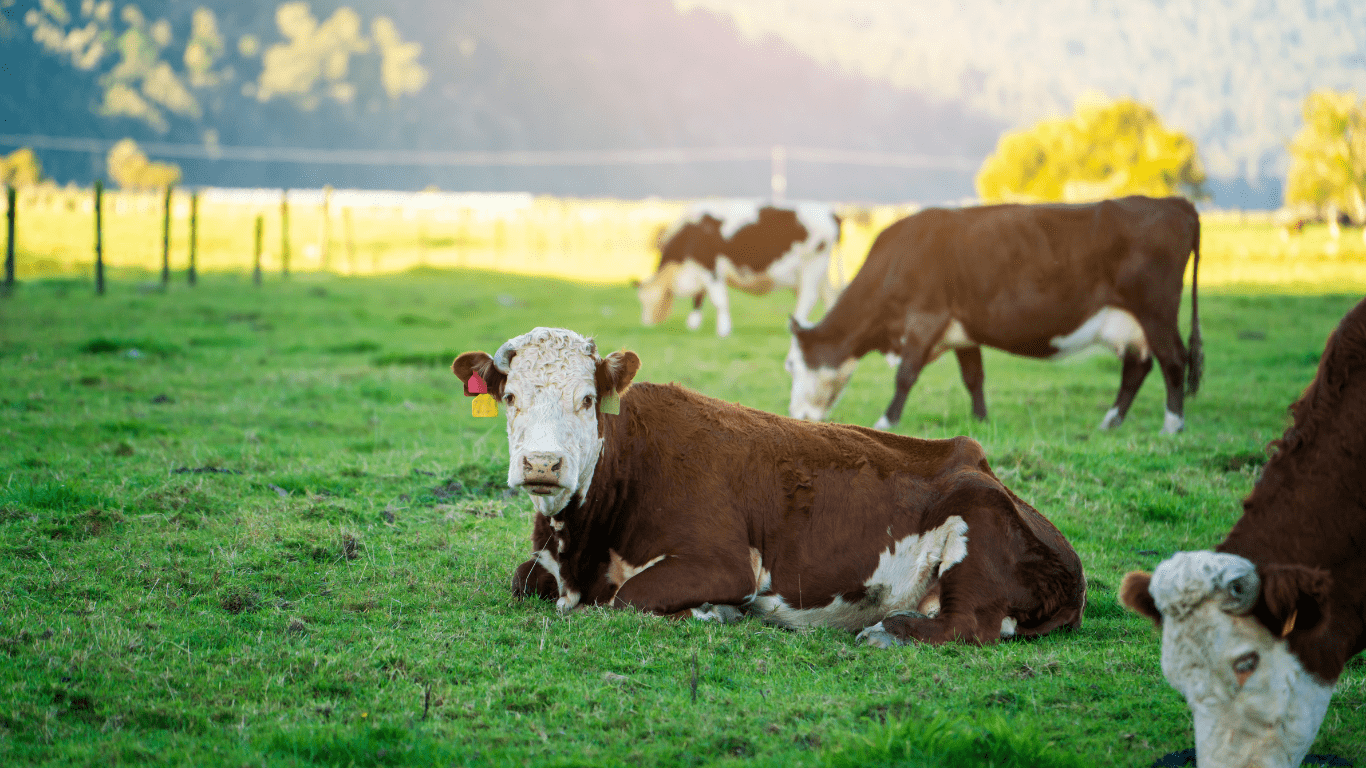
    Each year there are opportunities for producers to market feeder cattle near the high-end of the year’s market. Cattle producers will likely be marketing cattle throughout 2022 at the highest prices since, at least, January 2016. While great news, we still need a marketing plan for feeder calves. One useful method is to compare the relationship between the futures price (CME Feeder Cattle Futures) with the current market price (CME Feeder Cattle Index Price). The difference between these two prices provides the market’s expectation of price movement in the short run and expectation of market highs.  Note, this was written just prior to the market fluctuations following the beginning of the Ukraine-Russia war.

    Using the current CME Feeder Cattle Index price and the August 2022 Feeder Cattle Futures contract prices, as an example (Table 1.), Friday, February 18th’s CME Feeder Cattle Index was $162.14 per cwt (Reporting Date: 02/17/2022) and the settlement price of the August 2022 Feeder Cattle Futures Price was $186.08 per cwt.  The market’s expectation is for Feeder Cattle prices to increase from $162.14 to $186.08 per cwt. The market is pricing in a $24 per cwt, $191 per head, and $11,968 per truckload increase between now and the expiration of the August futures contract. Of course, basis adjustments may need to be made for your individual situation.

    The futures market expects feeder cattle prices to increase each month during 2022.  Over the last five years, market price highs have occurred during the second half of the year, and that is expected this year, as well.

    Prevatt, Chris. “Marketing Feeder Cattle at 6-Year Price Highs“. Southern Ag Today 2(10.2). March 1, 2022. Permalink

  • 2022 Corn Outlook

    2022 Corn Outlook

    For many feed grain producers, 2021 was a profitable year; however, the uncertainty and risk associated with the 2022 corn crop is elevated. Following is a look at how the components of the supply and demand balance sheet might provide price direction as we head into the new crop season.  Importantly, is there a likelihood of an increase in ending stocks that puts downward pressure on prices, or might stocks get tighter and prices go higher? 

    USE:  U.S. corn use over the last six years has ranged from a low of 14.0 billion bushels (2019/20) to a high of 14.8 billion bushels (2017/18, 2020/21, 2021/22).  Domestic use over this time frame is little changed, varying in a range from 12.1 to 12.4 billion bushels. 

    Looking at the major use categories, growth in the corn for fuel use category seems limited due to uncertainty around the Renewable Fuel Standard and gasoline demand projections.  With rising fuel-efficiency ratings and a growing number of vehicles on the road that do not use gasoline, the Energy Information Administration forecasts motor gasoline demand in the U.S. (the foundation of ethanol demand) to decline over the next several years in its Annual Energy Outlook (https://www.eia.gov/outlooks/aeo/). 

    Impacting the corn for feed category is a decline in grain consuming animal units (GCAU) over the last two years and a decline in energy feed per GCAU over the last five years (https://www.ers.usda.gov/data-products/feed-grains-database/). 

    Food, seed, and industrial use (other than ethanol) have held steady in a range from 1.415 to 1.453 billion bushels since 2016.

    Exports have been the use category with the most variability over the last several years and have therefore had the most impact on ending stocks. U.S. corn exports hit an all-time record high in 2020/21 at 2.753 billion bushels. Corn production from the top four competitors for U.S. corn exports: Brazil, Argentina, Ukraine, and Russia, is forecasted to be at record high levels in 2021/22, while U.S. exports are projected to be back down to 2.425 billion bushels. High corn prices provide incentives for producers all around the world to increase acres.  At the time of this writing, the conflict between Russia and Ukraine has the potential to upset grain flows from the Black Sea region, an important component of the global grain trade.  

    SUPPLY:  One of the greatest areas of uncertainty for 2022 is the impact of record-high fertilizer prices and crop input availability. How will this impact farm productivity, profitability, and planting decisions? Will farmers opt for crops that are less fertilizer intensive given these high input costs? Will herbicide cost and availability shift planting decisions to crops with a wider range of alternative crop production systems that are less reliant on over-the-top herbicides? The current ratio of soybean to corn prices suggests net farm returns are about equal between these two crops in Midwest crop budgets (farmdoc dailyhttps://farmdocdaily.illinois.edu/2021/12/2022-updated-crop-budgets.html).  Late-spring input pricing and input product dealer inventories may keep the acreage question unanswered longer than normal this spring.  

    ENDING STOCKS AND PRICE:  If farmers plant about the same number of corn acres in 2022 as 2021 (about 93 million), we once again achieve a trendline yield (about 179 bushels per acre), and projected use holds steady in 2022 as currently projected for 2021, total production would exceed the 14.8 billion bushels of projected use. That would increase ending stocks in 2022 and fundamentally put downward pressure on prices.  

    RISK MANAGEMENT:  A primary area of financial risk in 2022 is that producers will have locked in high input costs early in the season only to see prices fall significantly by harvest. This highlights the importance of a two-prong approach to risk management. First, focus on cost management and input use efficiency while maintaining productivity. This is to get the break-even cost as low as possible. Second, have an accurate estimate of break-even cost and a plan and the tools in place to not let profitable price opportunities get away.  

    Welch, J. Mark. “2022 Corn Outlook“. Southern Ag Today 2(10.1). February 28, 2022. Permalink

  • The COVID Effect and Search Behavior for Plants Online

    The COVID Effect and Search Behavior for Plants Online

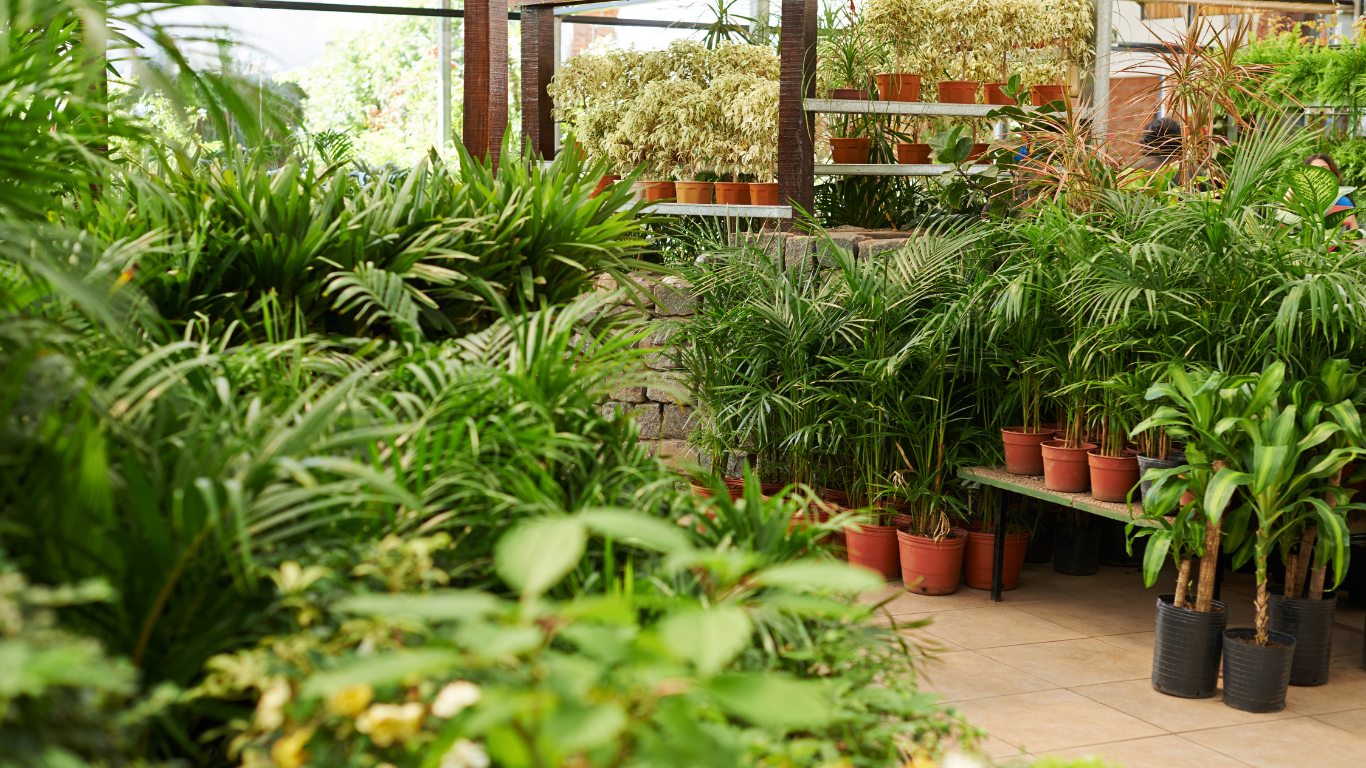
    The COVID-19 pandemic affected how consumers buy ornamental plants. Consumer demand for ornamental plants increased during the pandemic as they were spending more time at home and sought safe outdoor activities (e.g., gardening). Their use of online information sources increased as well. Google Trends (2021) demonstrates U.S. consumers’ garden and landscape search behavior over the past 5 years. The waves indicate the seasonality of gardening and landscaping purchases where peak interest occurs during spring and early summer and interest wains during fall and winter. In 2020, there is a “COVID bump” where U.S. consumer online inquiries drastically increased over the previous three years. In 2021, there was an echo of this bump indicating increased interest (when compared to 2019 and earlier) but not to the extent observed in 2020. Two key implications of these trends are 1) Relevant, up-to-date information should be available online for consumers prior to the growing season; and, 2) Consumers are actively seeking gardening and landscaping information online, meaning online tools present an opportunity to effectively reach audiences with pertinent information.

    Source: Developed from Google Trends on 8/27/2021

    Rihn, Alicia L. . “The COVID Effect and Search Behavior for Plants Online“. Southern Ag Today 2(9.5). February 25, 2022. Permalink

  • United Arab Emirates shows promise for U.S. Agricultural Exports according to USDA

    United Arab Emirates shows promise for U.S. Agricultural Exports according to USDA

    The Foreign Agricultural Service (FAS) of USDA sponsors international trade missions (to as many as six countries per year), opening doors for U.S. exporters and giving them the opportunity to forge relationships with potential customers, gather market intelligence, and generate sales in foreign markets. Since the pandemic, all trade missions have been canceled or postponed. Last week (February 15, 2022), FAS launched its first trade mission since November 2019 to the United Arab Emirates (U.A.E.). The delegation to the U.A.E. included nearly 40 representatives from agribusinesses, farm organizations, and state departments of agriculture interested in exploring export opportunities across the Middle East. Both the FAS Administrator, Daniel Whitley, and Secretary of Agriculture, Tom Vilsack were a part of the delegation kicking off the first USDA trade mission in over two years.

    With annual agricultural exports averaging more than $1.2 billion during the last five years, the U.S. is the UAE’s fourth-largest supplier of food and farm products and is poised for further export growth according to USDA. How important is the U.A.E. to U.S. exports, particularly exports from the South? In 2021, agricultural exports from the Southern region to the U.A.E. were $357 million, which was an increase of nearly 50% when compared to the previous year (Table 1). Although this is relatively low when compared to countries like China (China purchased $15 billion in agricultural exports from the U.S. South in 2021), the U.A.E. was the South’s 41st largest market out of more than 200 countries (USDA-FAS, 2022). Interestingly, the South’s leading agricultural export to the U.A.E. in 2021 was distilled spirits ($74 million), mostly due to exports of spirits from distilled grapes (e.g., brandy) from Texas and whiskey from Tennessee. Other leading exports in 2021 included poultry products ($47 million), soups and other prepared foods ($26 million), corn ($24 million), and dairy products ($ 24 million). See Figure 1 for the top-15 exports from the U.S. South to the U.A.E. 

    U.S. Department of Agriculture, Foreign Agricultural Service (USDA-FAS) (2022). Global Agricultural Trade System. https://apps.fas.usda.gov/gats/default.aspx

    Table 1. U.S. and Regional Agricultural Exports to the United Arab Emirates (U.A.E): 2019-2021

    201920202021% Growth(2021-20)
     Export Value ($ million)
    United States$1,309$970$1,20123.8%
    Regions    
    Western$707$513$5649.9%
    Southern33224135748.1%
    Northeast16813116324.4%
    Midwest1018411638.1%
    Note: The values in the table include related products like forestry and seafood, which are less than 5% of total exports.
    Source: USDA Foreign Agricultural Service, Global Agricultural Trade System (2021) 

    Figure 1. Top-15 Exports from the Southern U.S. to the United Arab Emirates (U.A.E): 2021 

    Note: The top-15 exports were valued at $312 million in 2021, accounting for 87% of total agricultural exports from the U.S. South to U.A.E. The Southern U.S. includes the following: Alabama, Arkansas, Delaware, District of Columbia, Florida, Georgia, Kentucky, Louisiana, Maryland, Mississippi, North Carolina, Oklahoma, South Carolina, Tennessee, Texas, Virginia, and West Virginia.
    Source: USDA Foreign Agricultural Service, Global Agricultural Trade System (2021)

    Muhammad, Andrew. “United Arab Emirates Shows Promise for U.S. Agricultural Exports According to USDA“. Southern Ag Today 2(9.4). February 24, 2022. Permalink