In a recent Southern Ag Today article, the topic of beef x dairy (BxD) placements was discussed (Wyatt and Martinez, 2025). In that article, the authors highlight that the number of BxD calves has been increasing since 2016. If the number of BxD calves has been increasing over that time frame, then the breeding decision to use beef semen versus dairy semen, should have an impact on cattle semen sales.
Annually, the National Association of Animal Breeders (NAAB) releases a report that includes domestic, export, and import sales for beef and dairy semen. Figure 1 displays the breed makeup of domestic US dairy semen sales from 2010-2024.
Figure 1. Domestic US Dairy Semen Sales.
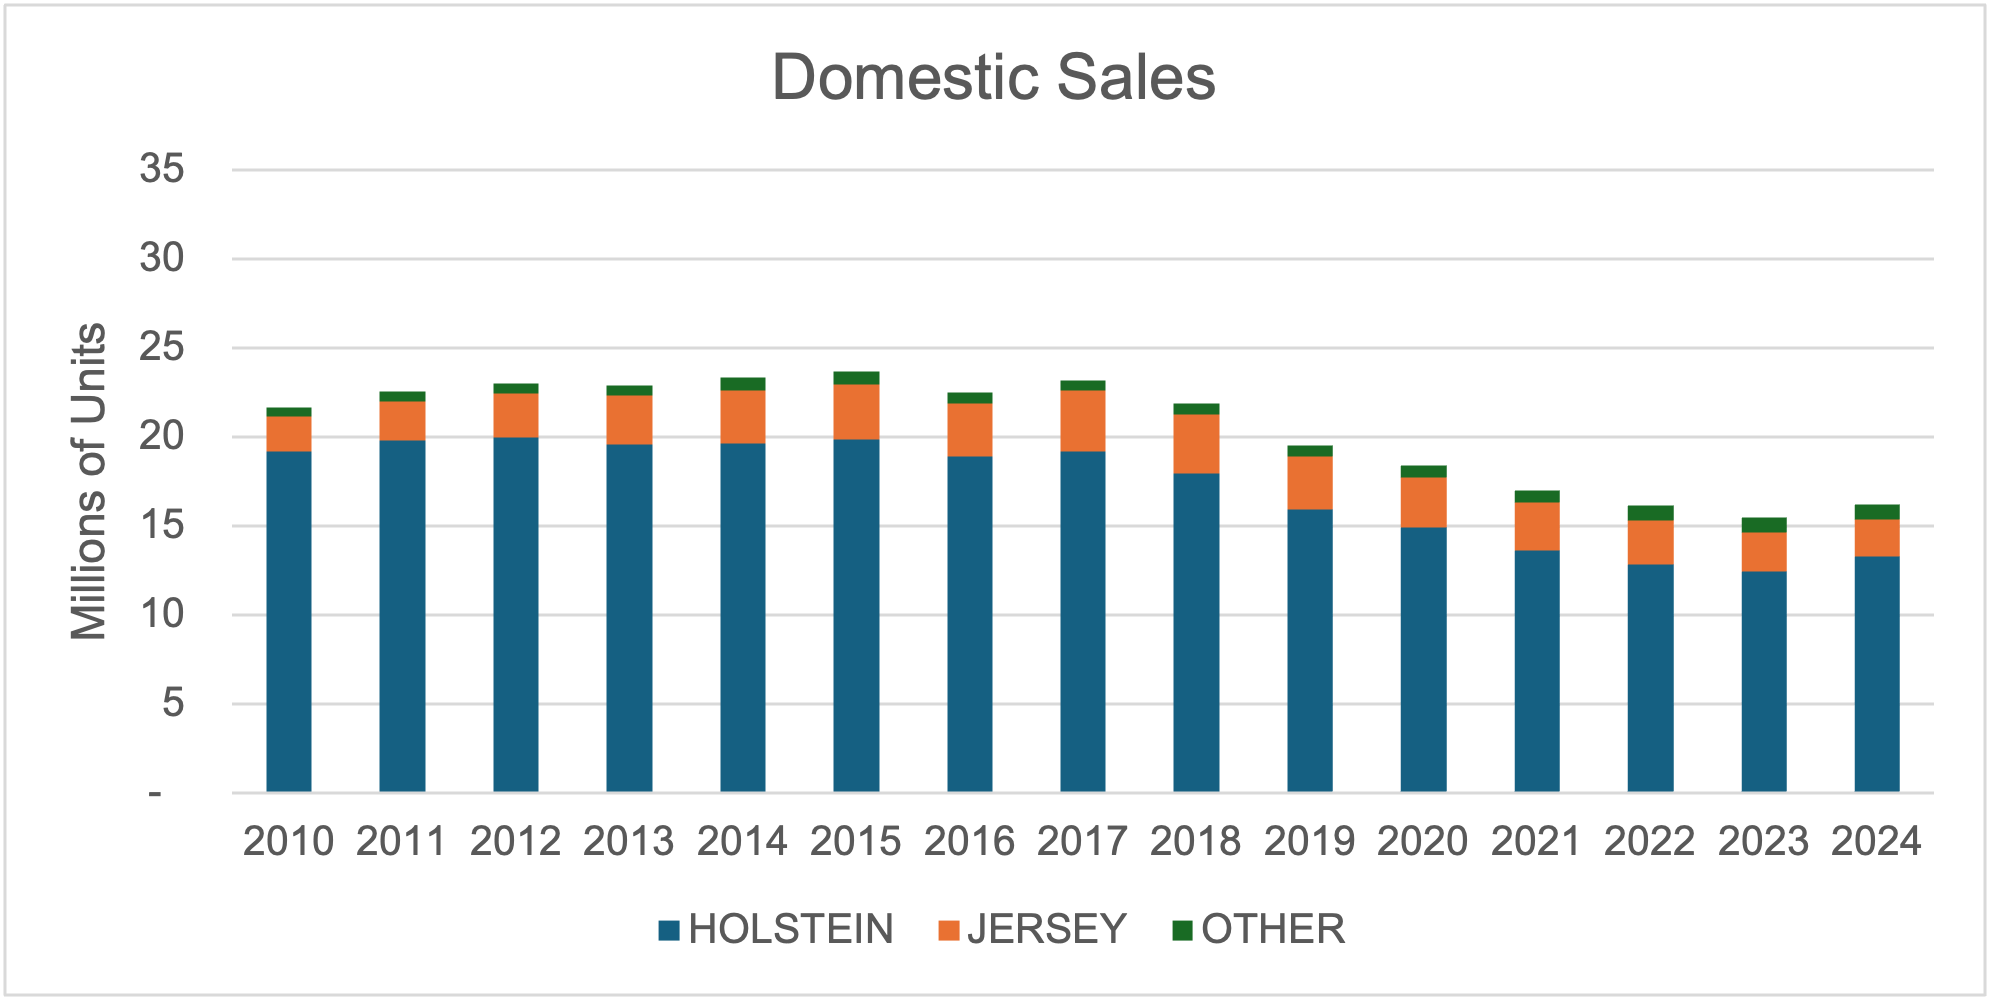
In 2010, total domestic dairy semen sales were 21.6 million units and increased to 23.6 million (9.25% increase) in 2015. Since 2016, there has been a negative trend in overall units of domestic dairy semen sold. In 2024, there were approximately 16.1 million units sold, which is a 31.77% decrease since 2015. Holstien genetics make up the largest share of domestic dairy semen sales, followed by Jersey genetics. In 2010, Holstein sales made up 89% of domestic sales, while Jersey sales were 9%. In 2024, Holstein sales made up 82% of domestic sales, whereas Jersey sales were 13%.
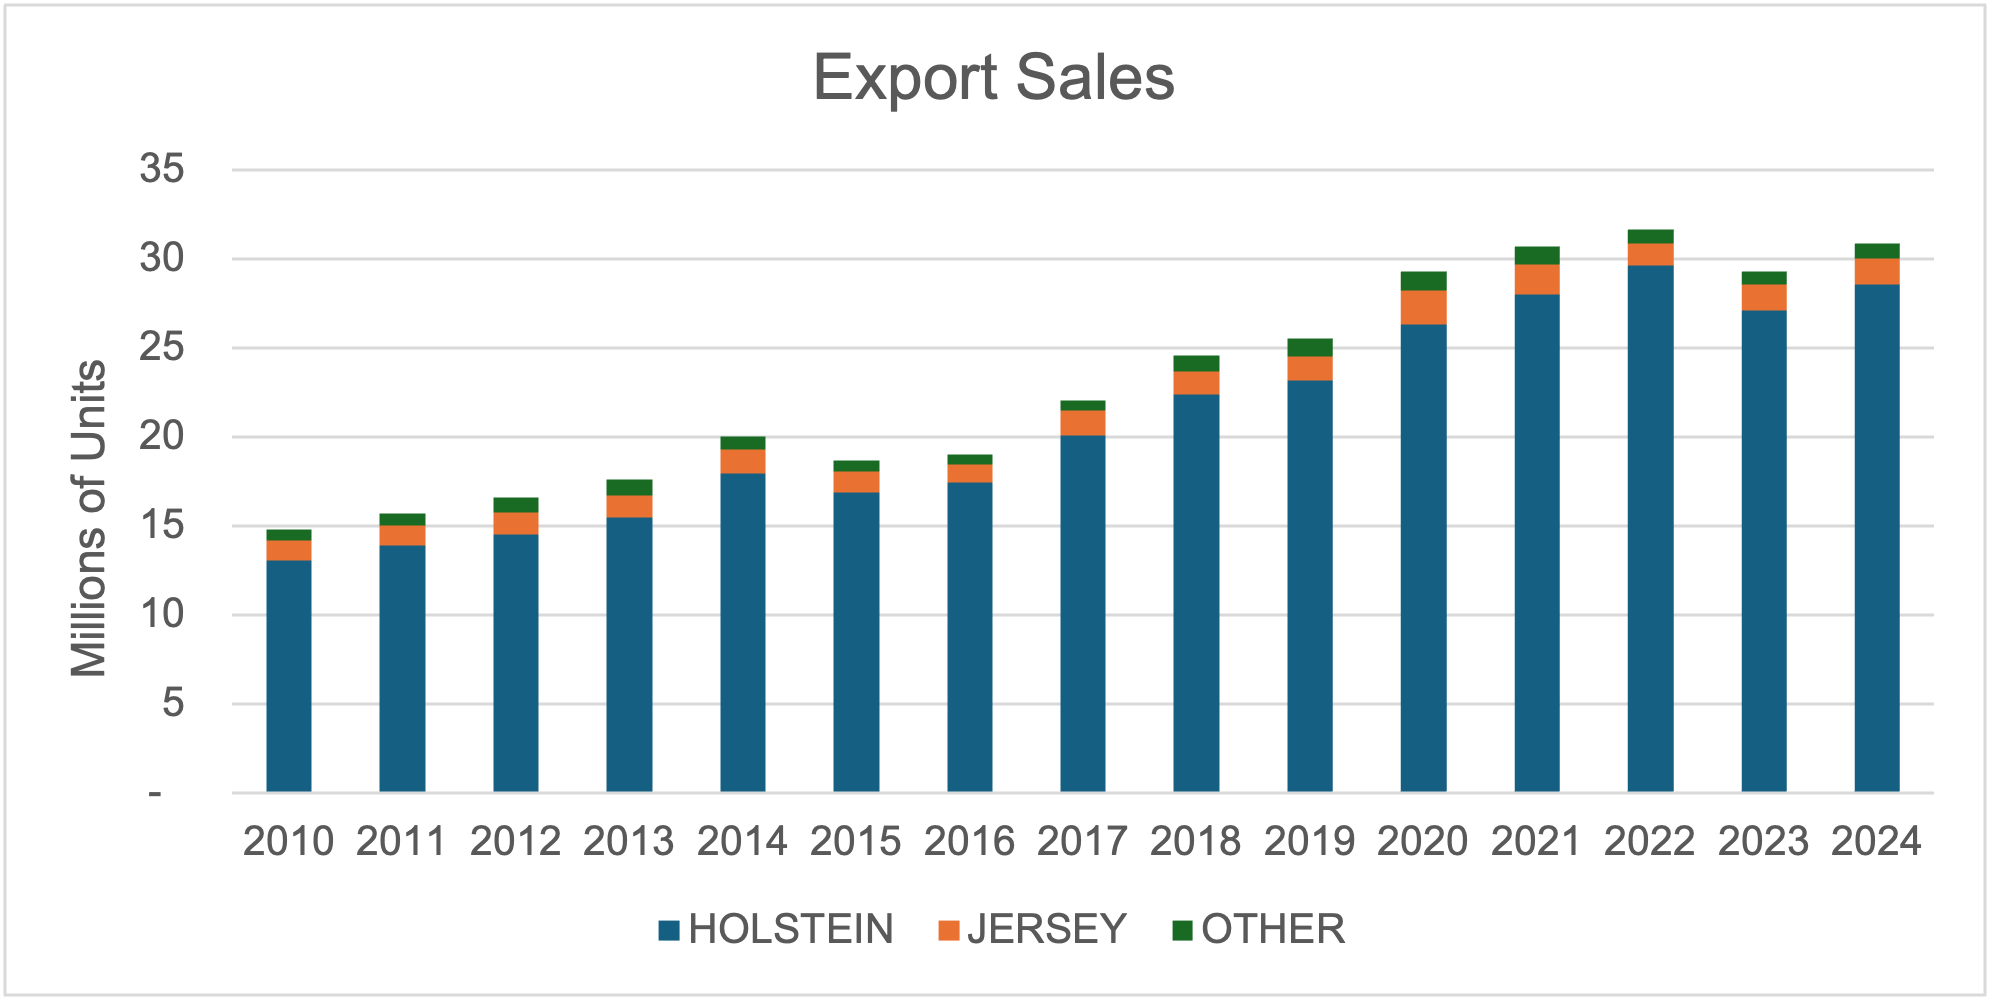
In contrast to domestic sales, there has been an increase in units of dairy semen exported. In 2010, there were approximately 14.8 million units of semen exported (Figure 2). In 2024, 30.8 million units of semen were exported, which is a 108% increase during that time frame. Holstein genetics constitute majority of these sales, and Jersey genetics are the second most. Top destinations for these sales are China, Brazil, Mexico, Argentina and the United Kingdom (United States Department of Agriculture-Foreign Agricultural Service, 2025).
Figure 2. US Dairy Semen Export Sales.
Since 2010, the market trend for imported dairy semen varies (figure 3). In 2010, there were about 220 thousand units of semen imported, 19 thousand consisting of Norwegian Red. In 2024, imports were at the lowest volume in the previous 14 years, with 101 thousand units, and over half of the imports being Norwegian Red genetics.
Figure 3. US Dairy Semen Import Sales.
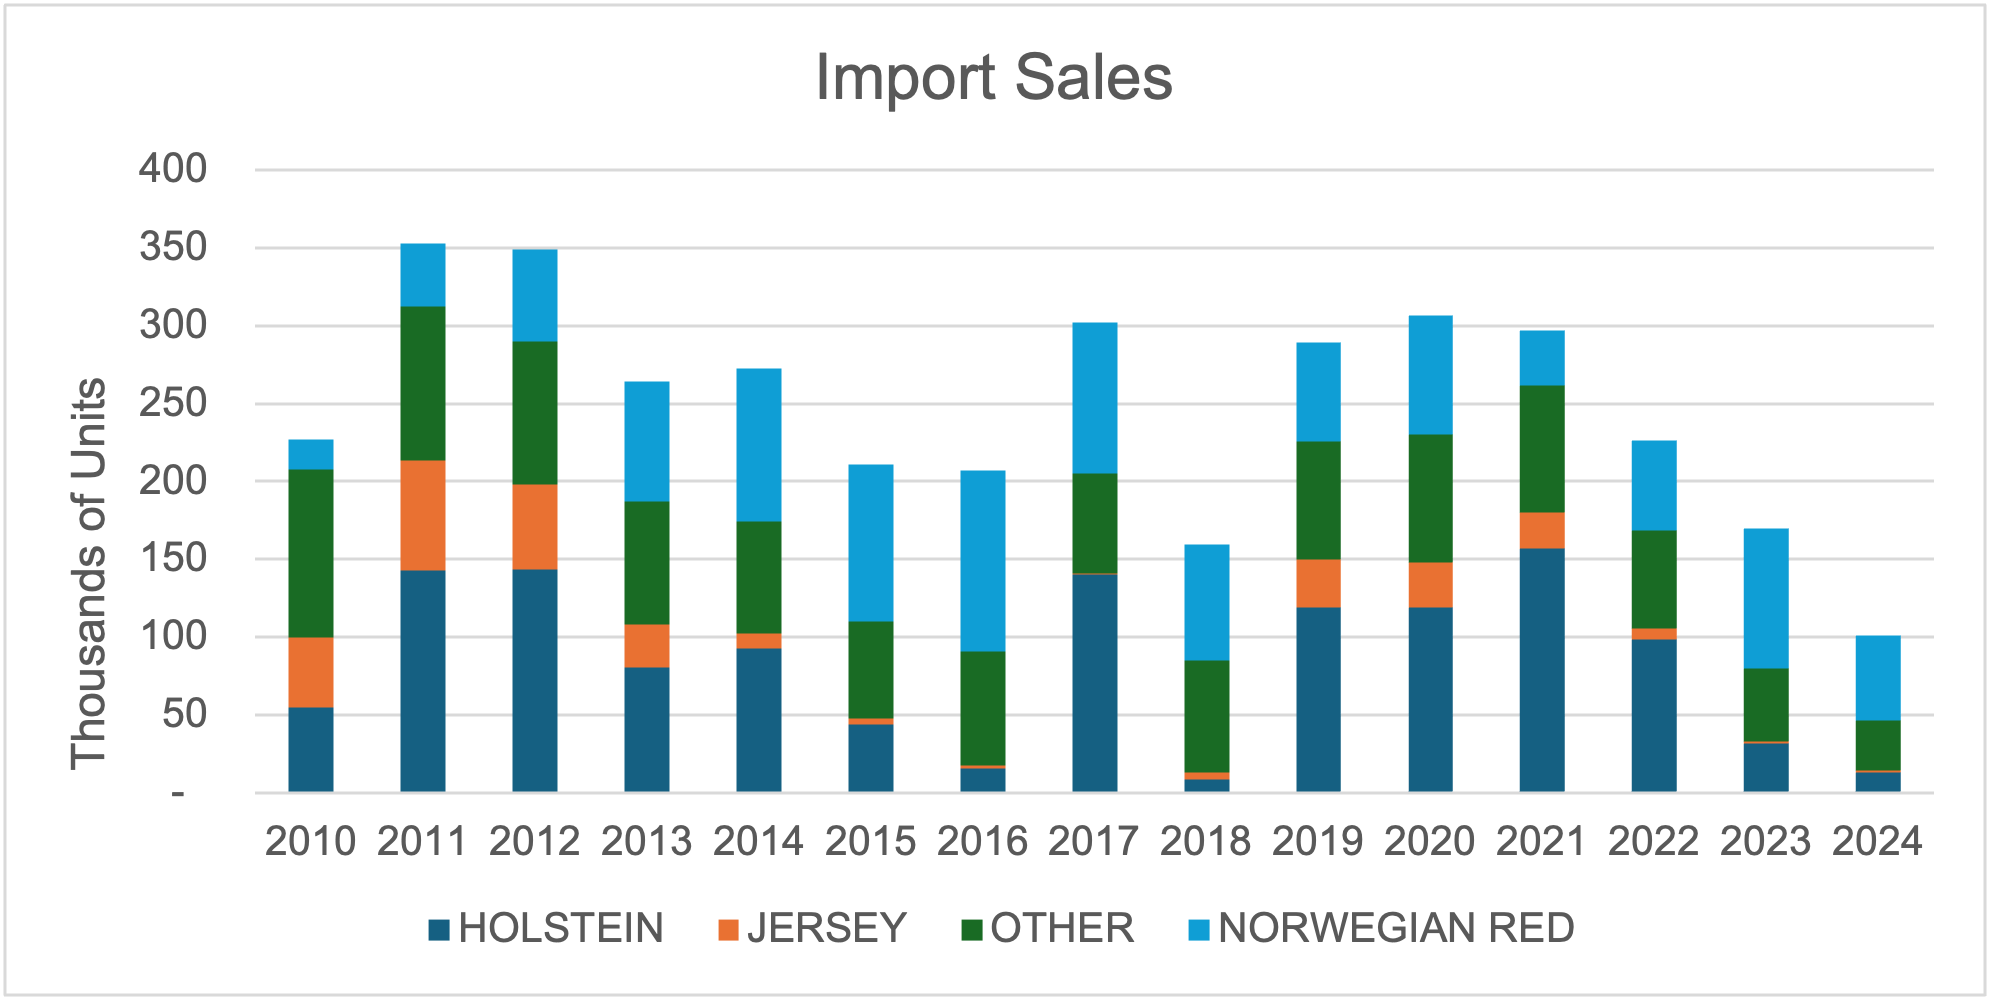
The figures above highlight various trends for dairy semen sales. Domestic sales have trended lower since 2016, which is likely due to BxD production. Exports have increased over time, highlighting the value of US dairy genetics. Imports are low in volume but have increased in Norwegian Red genetics.
References
Wyatt, Parker, and Charley Martinez. “Beef x Dairy Placements.” Southern Ag Today 5(29.2). July 15, 2025. Permalink
National Association of Animal Breeders. 2025. “Semen Sales Report 2010-2024.”
United States Department of Agriculture-Foreign Agricultural Service. 2025. “Global Agricultural Trade System Database.” Internet site: https://apps.fas.usda.gov/gats/default.aspx (Accessed July 2025).
Mundy, D. Eli, and Charley Martinez. “Dairy Semen Market Trends.” Southern Ag Today 5(32.2). August 5, 2025. Permalink