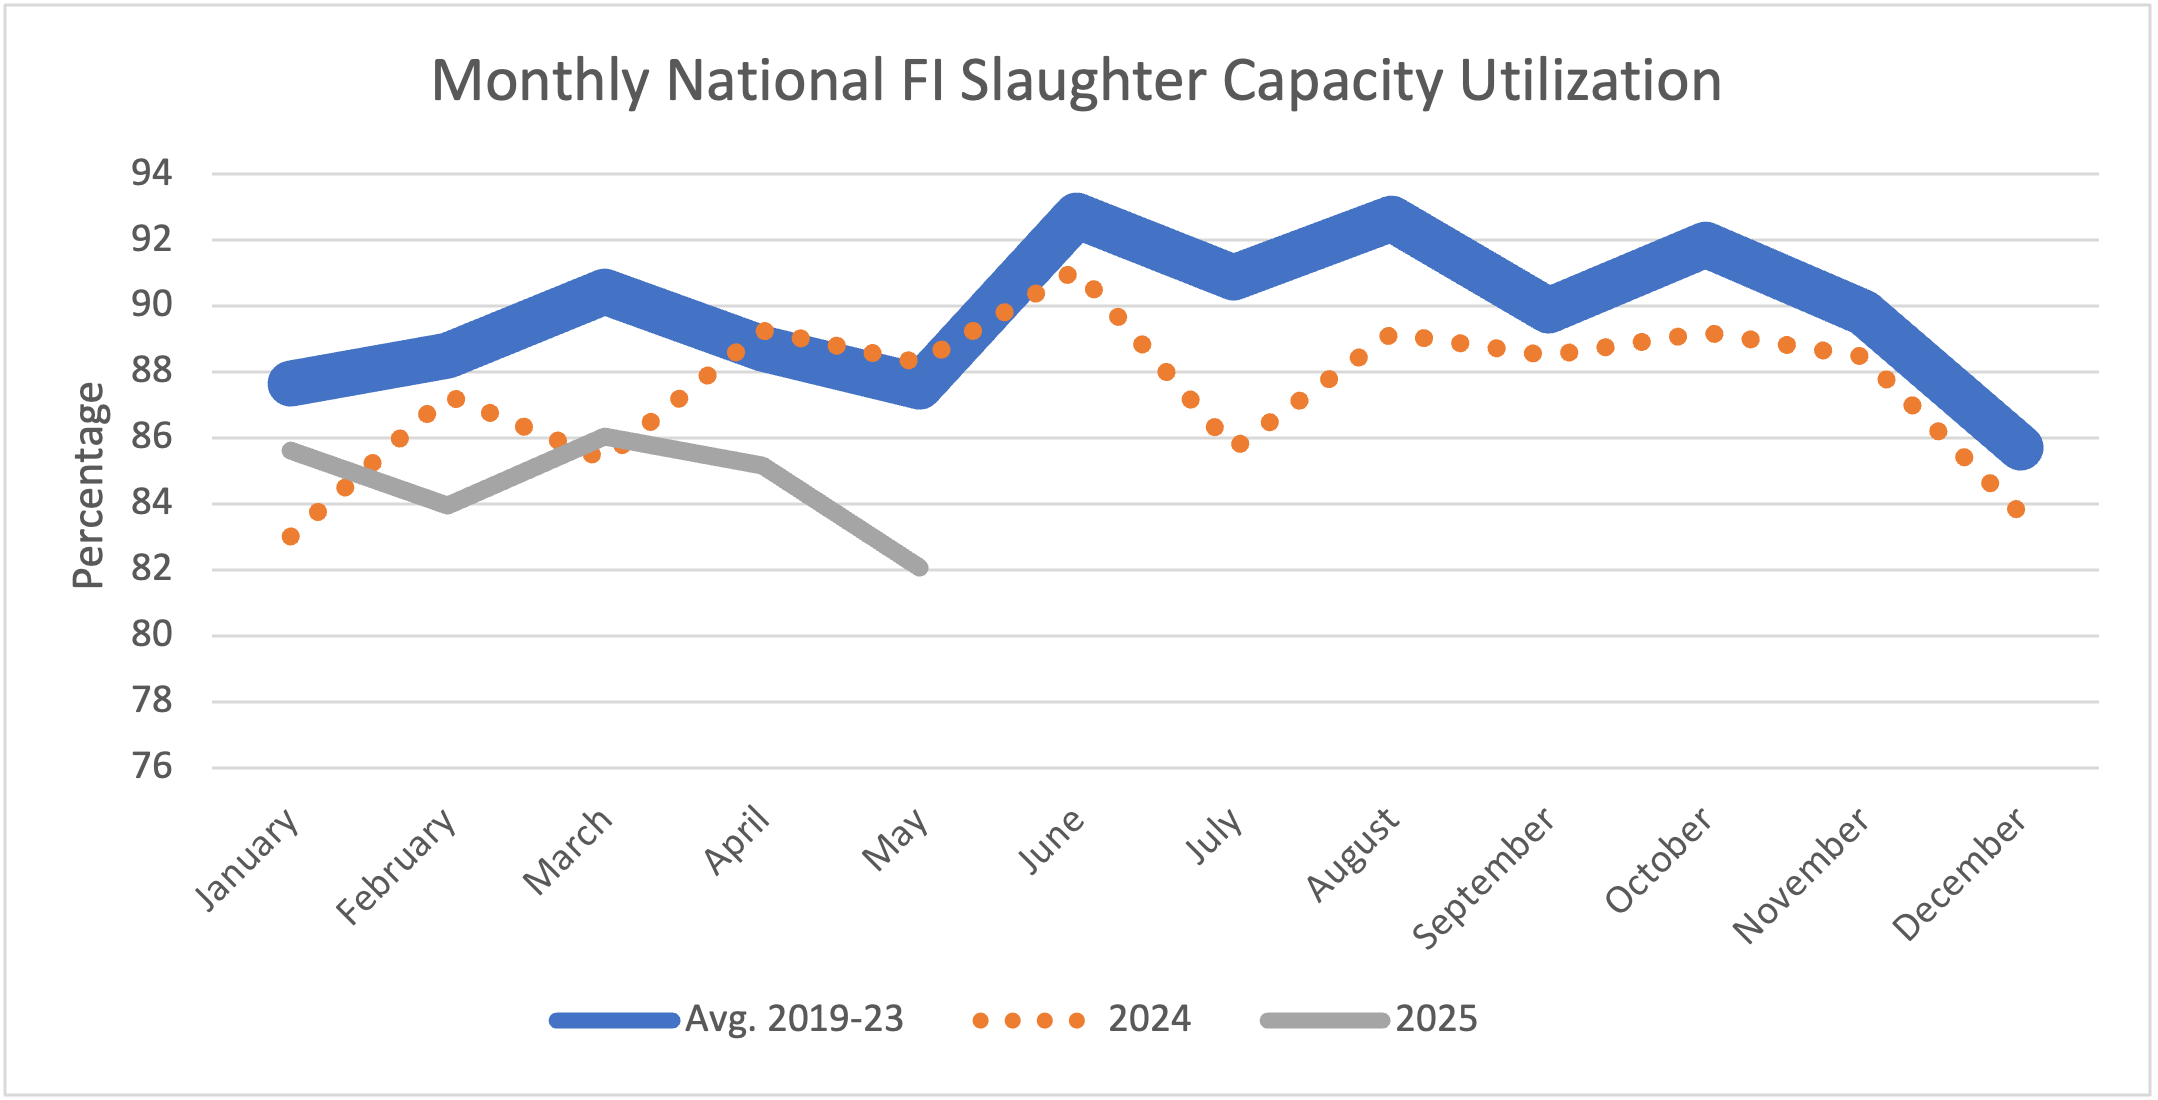
In recent months, there have been Southern Ag Today articles discussing the impacts of tight fed cattle supplies on prices, cattle on feed, slaughter weights, and total beef production (Anderson 2025a, Anderson 2025b, Maples 2025). Each of the articles mentioned has highlighted the unique and historical differences between the current market and years past. One aspect that has not been covered, but is important, is slaughter capacity utilization (CU). In Martinez et al. (2023), we show how we measure slaughter capacity utilization, which measures the ratio of operational cattle slaughter capacity over physical capacity. Figure 1 displays the monthly national federally inspected (FI) slaughter capacity utilization.
Figure 1. Monthly National Federally Inspected Slaughter Capacity Utilization
In May, slaughter capacity utilization averaged 82%, which was lower than May 2024 (88.29%), and the previous 5-year average (87.56%). Additionally, through the first five months of 2025, capacity utilization averaged 84.57%, which is lower than the same time frame last year (86.64%), and the previous 5-year average (88.57%). Historically, in March and April, the ramp up of slaughter for grilling season occurs, followed by a decrease for 1 to 2 months. Thus, the decrease this year from March (86.06%) to May was expected.
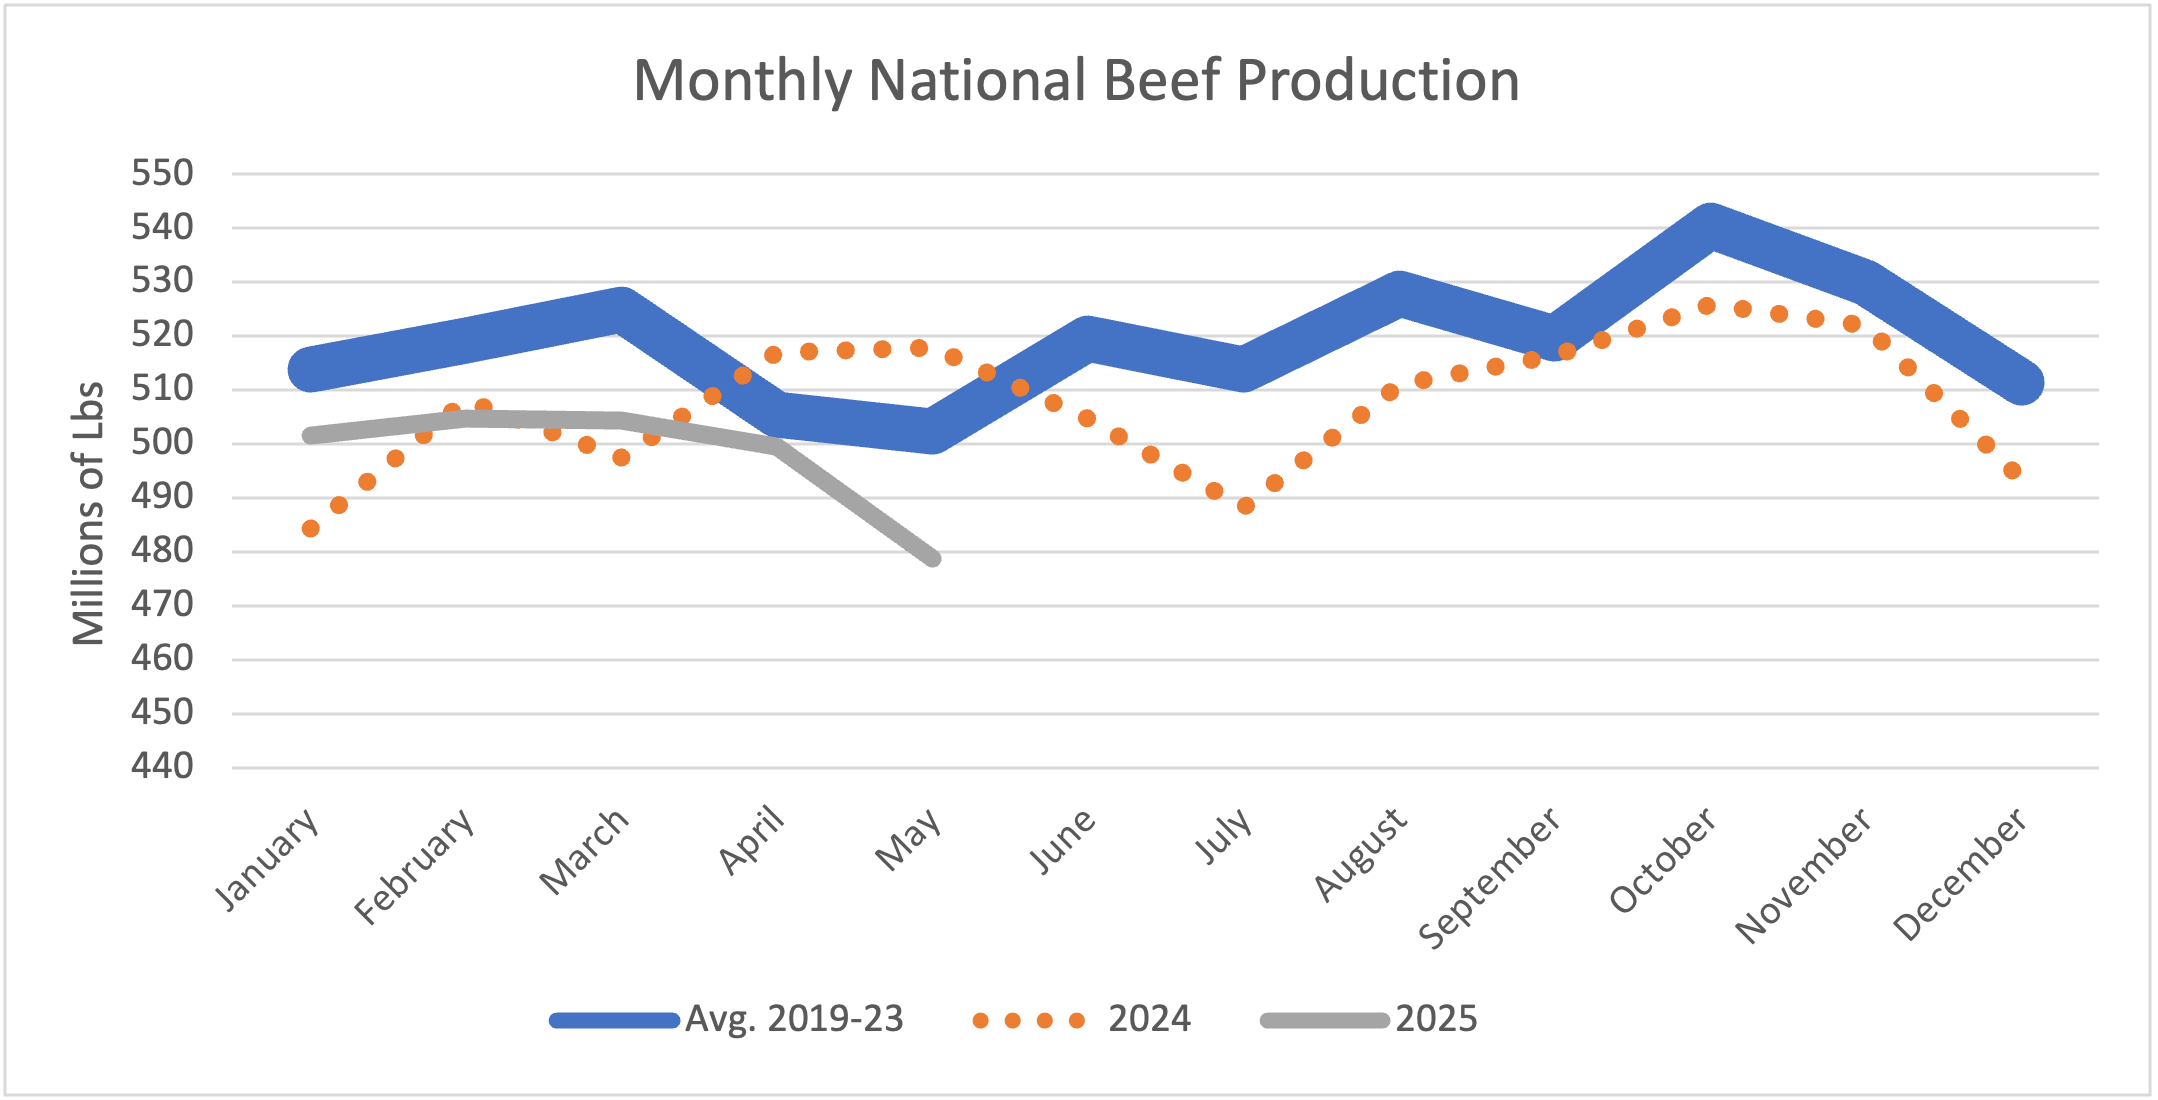
While May’s utilization is down 8.29% compared to May 2024, commercial beef production (figure 2) in May was down 7.53% compared to May 2024 and down 4.67% compared to the previous 5-year average. Through May, total commercial production is averaging 497.8 million pounds per month, which is also lower when compared to 2024 (504.95 million pounds per month) and the previous 5-year average (513.12 million pounds per month). When comparing total production, 2025 production is 1.33% lower than last year and 2.98% lower than the previous 5-year average.
Figure 2. Monthly National Commercial Beef Production
Overall, the decline in 2025 capacity utilization compared to last year (down 2.07%) and the previous 5-year average (down 4%) is larger than the decline in total production compared to last year (down 1.33%) and the previous 5-year average (down 2.98%). Therefore, the increasing utilization difference between 2024 and 2025 signals the impact and realization of the tight supplies on capacity utilization. However, the supply chain is offsetting the tight supplies with larger carcasses and has led to market signals to have lower discounts for heavier cattle while operating at lower capacity utilization. As we get into the second half of the year, it will be interesting to see where capacity utilization and slaughter weights measure given even tighter supplies based on the latest Cattle on Feed reports.
References
Anderson, David. “Fewer Marketings, Tighter Beef Supplies.” Southern Ag Today 5(26.2). June 24, 2025.
Martinez, C., Li, P., Boyer, C. N., Yu, T. E., & Maples, J. G. (2023). Beef price spread relationship with processing capacity utilization. Journal of the Agricultural and Applied Economics Association.https://onlinelibrary.wiley.com/doi/full/10.1002/jaa2.48
The average south-wide stumpage prices for most major timber products remained relatively unchanged in Q1 2025, staying flat or trending slightly downward. Pine sawtimber averaged around $25/ton, slightly below the price a year ago and about 10% lower than its recent high in Q1 2022 (TimberMart-South, 2025). Pine chip-n-saw prices continued to decline, averaging around $17-18/ton, down about 10% year-over-year and 18% below their 2022 peak. Over the past two years, the average pine and hardwood pulpwood prices have stabilized around $7–8/ton, falling from early 2022 highs. One exception is hardwood sawtimber. Its price held better than other timber products, reaching a record high ($35/ton) in Q4 2024 before a modest retreat in Q1 2025.
While overall changes in south-wide averages are minimal, stumpage prices across the region vary greatly by state and subregion, largely depending on local weather conditions, local mill demand, and post-disaster salvage activities. Compared to a year ago, pine sawtimber prices fell sharply in Florida (-25%), declined moderately in South Georgia (-11%) and Louisiana (-8%), but remained stable in Alabama, Arkansas, North Georgia, and Mississippi.
A Closer Look at the Southern Timber Markets
Generally, weak pine sawtimber prices are mainly due to the sluggish housing market. Over 70% of the U.S. softwood lumber and structural panels are used in residential construction, especially in single-family homes, and home improvement activities (Alderman, 2022). Although newly built single-family houses now make up a significantly larger share of for-sale inventory than before the pandemic, their overall supply remains limited. Contributing factors include rising construction material costs, labor shortages, higher financing costs, restrictive zoning regulation, an increase in existing homes for sale (the highest in five years), and declining housing affordability. Uncertainty around tariffs and immigration policy further discourages expansion for homebuilders. In April, single-family housing starts fell to a seasonally adjusted annual rate of 927,000, down 12% from the previous year and the lowest level since July 2024. A slowdown in remodeling and repair activity has also contributed to softer demand for lumber and timber products (JCHS, 2025).
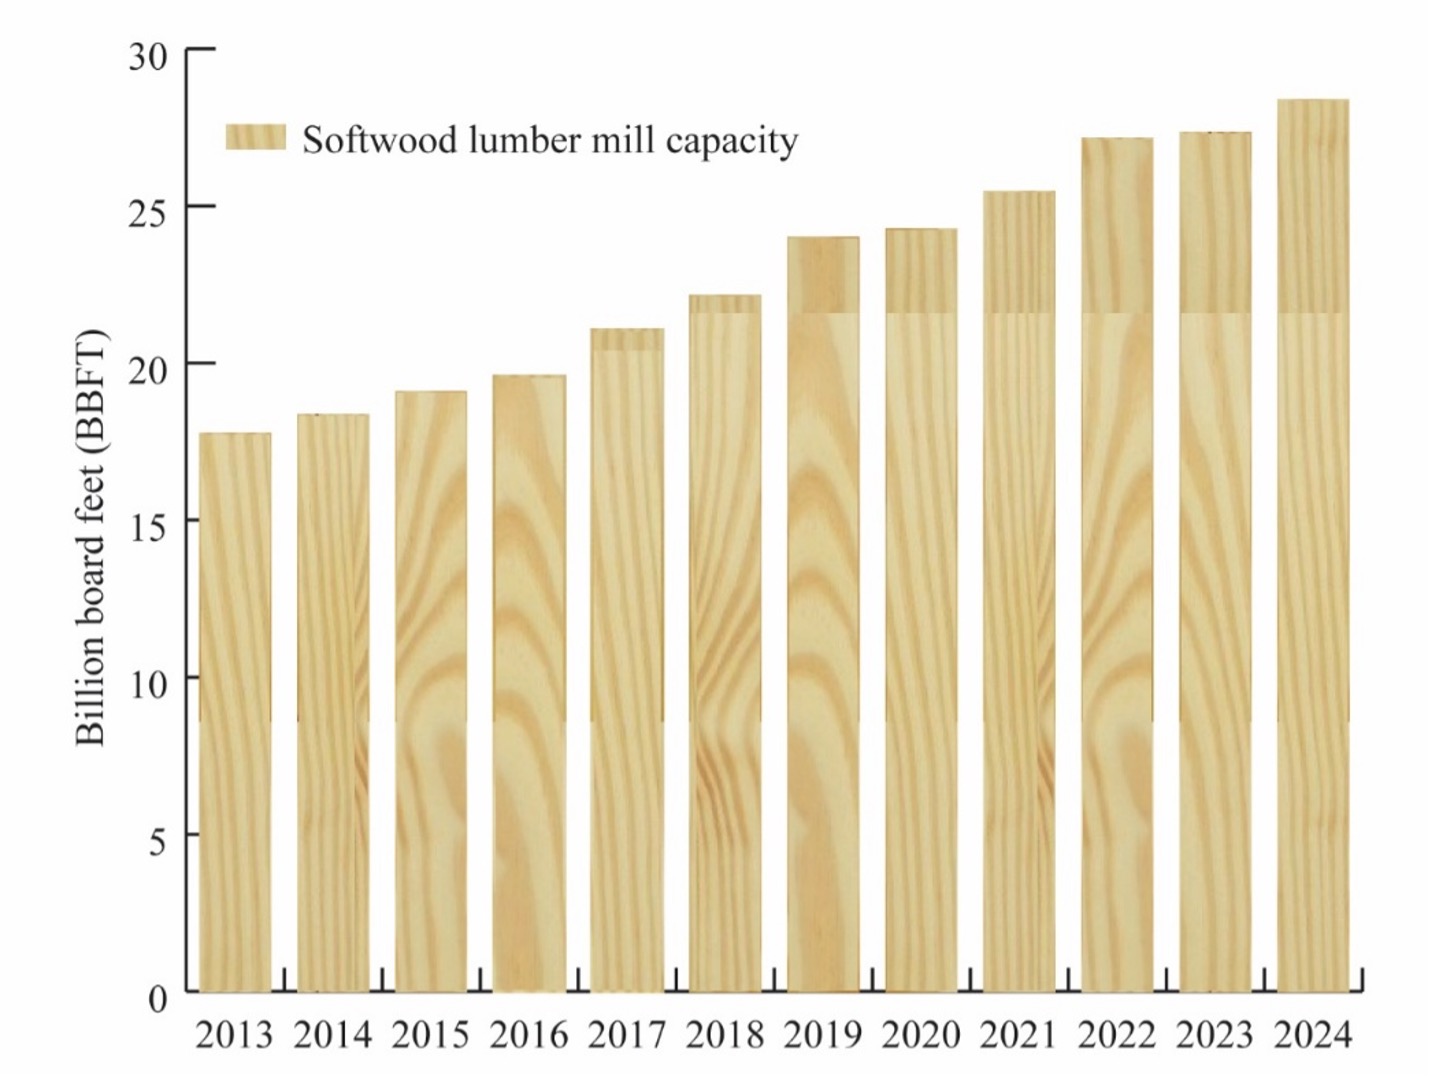
Despite weak demand, southern softwood lumber mill capacity continues to grow, exceeding 28.4 billion board feet in 2024— a 35% increase from 2017 (Figure 1)—with an additional 753 million board feet by 2026 (Forisk, 2025). Much of this expansion is driven by Canadian lumber companies facing reduced log availability in Western Canada and ongoing U.S. tariffs. The combination of this increased capacity, while current production aligns with weak demand, means lower capacity utilization. Utilization rates of southern softwood lumber mills have declined from 85% in 2021 (Forisk, 2023) to 75% in 2024 due to softer lumber demand (Forisk, 2025; SFPA, 2025).
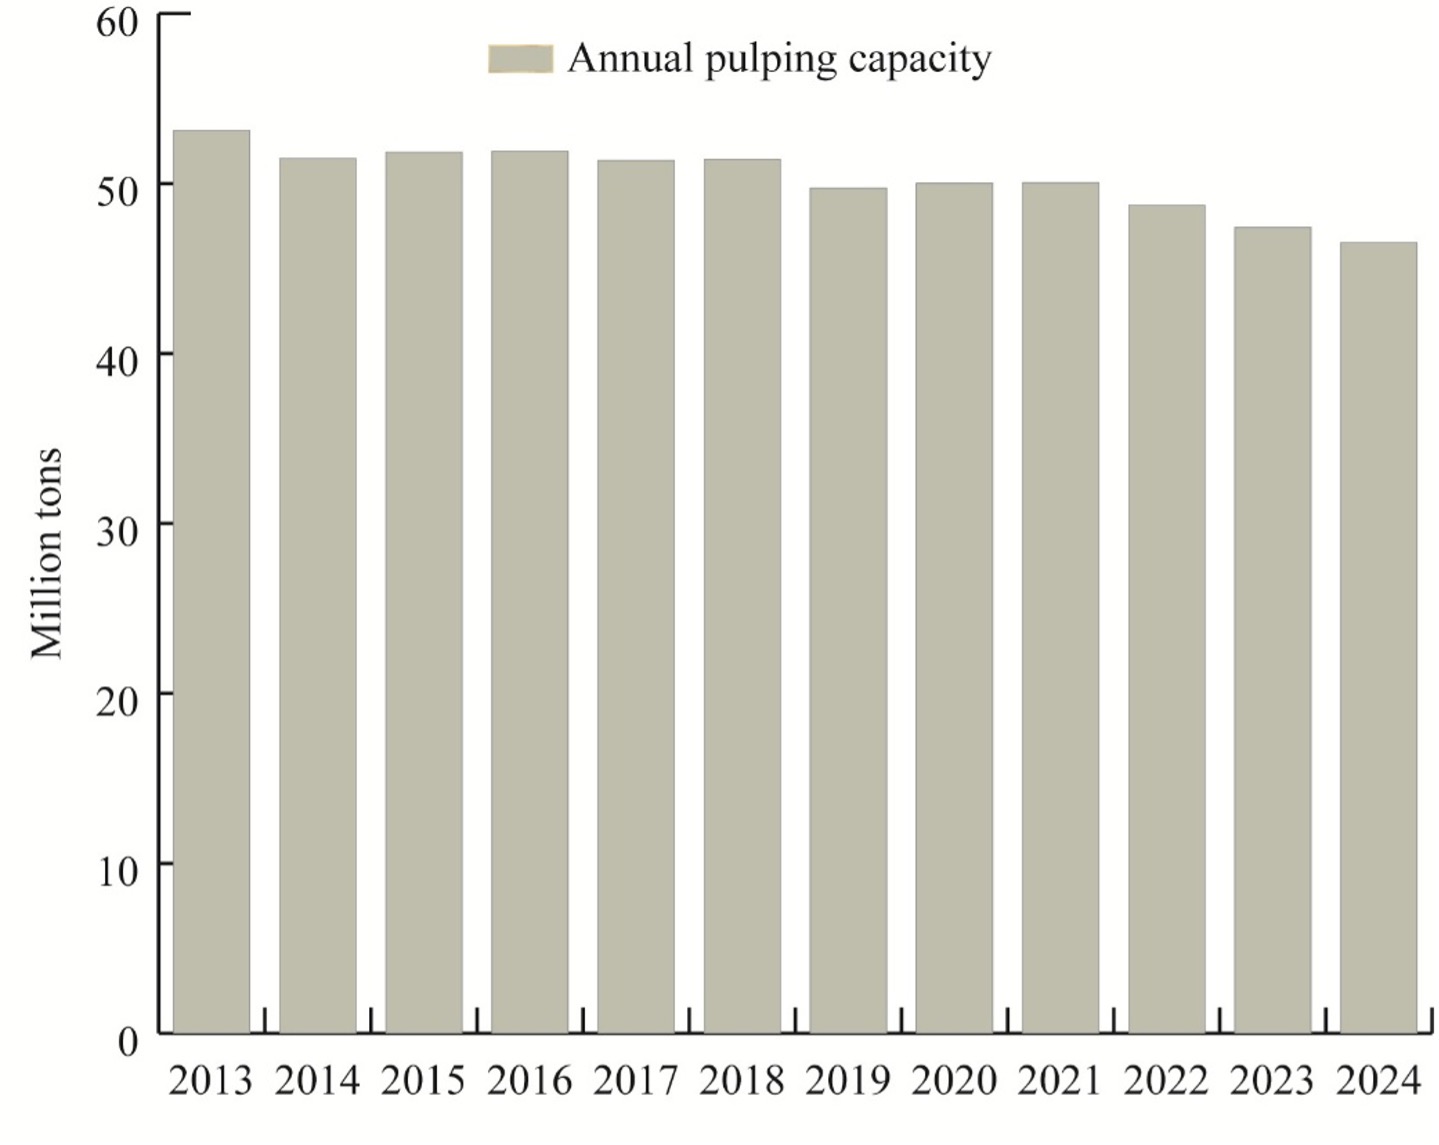
The decline in softwood and hardwood pulpwood prices reflects the continued closure and conversion of wood pulping mills in the South. In 2024, wood-using pulping capacity in the South continued to shrink, driven by product shifts in the paper and paperboard industries and the increased use of recycled fiber in pulp production (Figure 2). These structural changes are expected to keep pulpwood prices suppressed, especially in areas impacted by Hurricane Helene and recent paper mill closures.
Figure 1. U.S. South Softwood Lumber Mill Capacity, 2013-2024
Data source: Forisk (2025).
Figure 2. U.S. South Wood-using Pulping Capacity, 2013-2024
Data source: Forisk (2025).
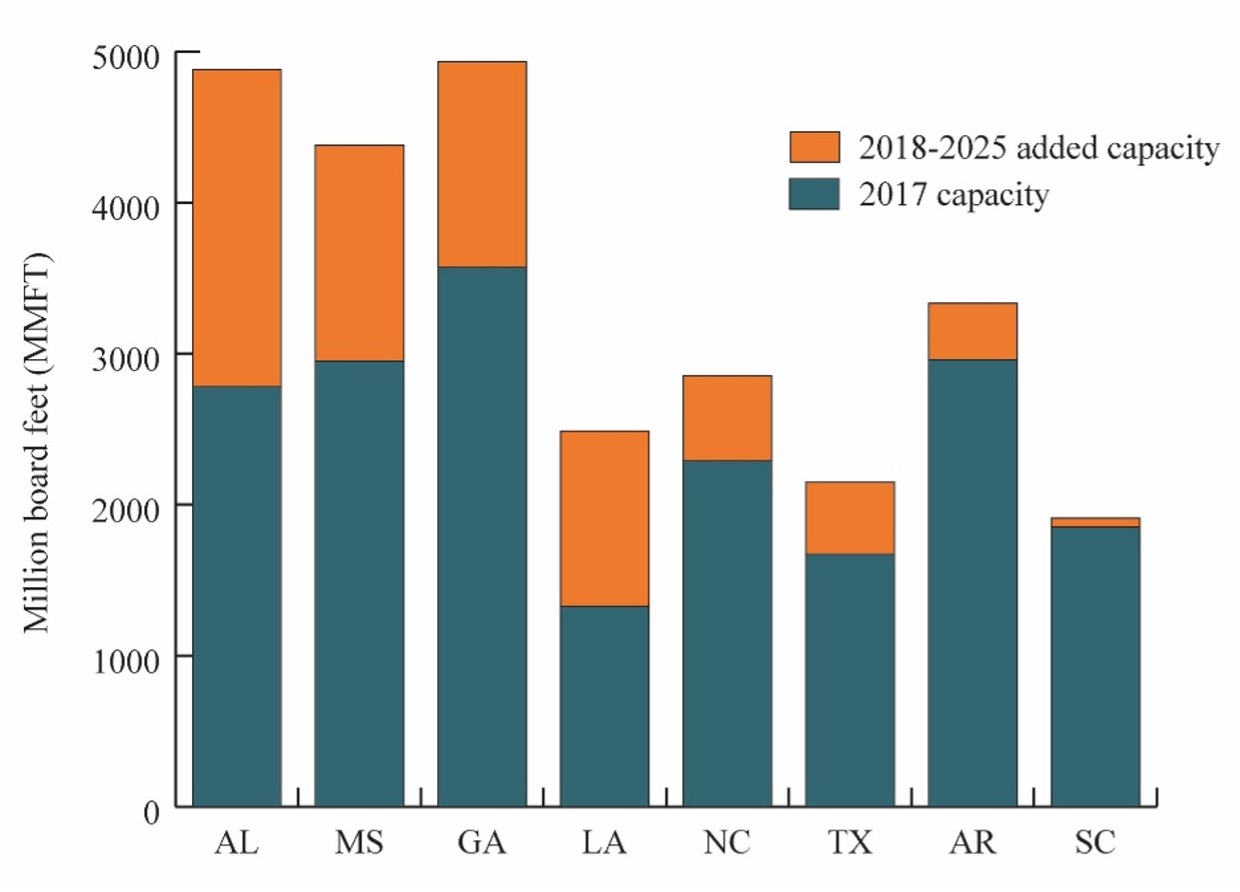
Figure 3. Added Softwood Lumber Mill Capacity by State, 2017-2025
Data source: Forisk (2025).
Looking Ahead
As a leading indicator, single-family housing permits declined by 5.1% in April to an annualized rate of 922,000 units, 6.2% lower than the same time last year. Housing starts are expected to remain weak through the remainder of 2025. This downward pressure, combined with a lingering oversupply of sawtimber from a decade of underbuilding, is expected to weigh on southern timber markets.
The tariff on softwood lumber imports from Canada currently remains at 14.5% but is expected to increase in fall 2025 (NAHB, 2025). Higher tariffs may reduce Canadian lumber imports and promote U.S. domestic production over the long term. However, they could drive up construction costs in the short term, exacerbating already low housing affordability.
Areas that have a recent expansion in mill capacity may see localized increases in sawtimber prices (Figure 3). Counties devastated by Hurricane Helene (e.g., South Georgia) may face tighter timber supply and rising sawtimber prices due to local inventory shortages, particularly in areas with low growth-to-drain ratios (USDA Forest Service, 2024).
References
Alderman, D. 2022. U.S. forest products annual market review and prospects, 2015-2021. General Technical Report FPL-GTR-289. Madison, WI: USDA Forest Service, Forest Products Laboratory.
Forisk. 2025. Forisk North American forest industry capacity database. Athens, GA: Forisk.
Joint Center for Housing Studies of Harvard University (JCHS). 2025. Leading Indicator of Remodeling Activity (LIRA). Cambridge, MA: Joint Center for Housing Studies of Harvard University.
National Association of Home builders (NAHB). 2025. In win for NAHB, Canadian lumber exempt from Trump’s global reciprocal tariffs.
The Southern Forest Products Association (SFPA). 2025. Lumber shorts. Metairie, LA: SFPA.
As of mid-June 2025, agricultural stakeholders are increasingly aware of claims by clean water advocates and regulatory concerns that land-applying municipal sewage waste (biosolids) may contaminate soil and groundwater with per- and polyfluoroalkyl substances (PFAS). In 2023, approximately 60% of U.S. biosolids were land-applied, according to the U.S. Environmental Protection Agency (EPA). Also, according to the EPA, PFAS exposure may pose health risks, though ongoing research continues to assess the impacts of low-level, long-term exposure, especially in children.
Federal and state regulators are working to eliminate PFAS compounds considered the most dangerous to our environment and our health, perfluorooctanoic acid (PFOA) or perfluorooctane sulfonic acid (PFOS), from consumer products. However, reducing environmental PFAS loads will also require alterations to current practices which may simply be recycling existing environmental loads, including agricultural uses of biosolids. Legal changes are expected. Farmers, who own or rent most of the land involved in applications of biosolids, will be a central focus.
What we have seen over the last few years has been a smattering of individual state government actions restricting and limiting the practice of land application of biosolids in various ways. In some extreme instances, these have included quarantine orders of entire tracts of farmland preventing or limiting further agricultural production.
A compilation of those individual state actions has been assembled by a national environmental consulting firm, ALL4 , and it is publicly available at this link: State-by-State Regulatory Update (March 2025 Revision)(see Table 2 – State Water Regulation Highlights). This documents the patchwork in regulatory landscape faced across the country.
Complicating enforcement, biosolids are increasingly transported across state lines, undermining the consistency of state-level regulation and calling for a more unified approach. This regulatory inconsistency challenges both land-applicators and regulators tracking PFAS from production to final disposal.
While the Clean Water Act (CWA), via the National Pollutant Discharge Elimination System (NPDES), governs the permitting of biosolid land applications, PFAS-specific regulation under this system remains limited. EPA has issued only non-binding guidance to states for performing their CWA duties.
Adding a new pollutant to those already identified and regulated in biosolids is ultimately controlled by the text of 33 U.S.C. §1345(d) of the CWA (“Disposal or Use of Sewage Sludge”), and regulations at 40 CFR Part 503. These require EPA to establish numeric limits and mandatory management practices to protect public health and the environment from the reasonably anticipated adverse effects of designated pollutants during the use or disposal of biosolids. EPA is also required to review these regulations at least every two years and develop standards where evidence warrants. To date, EPA has not established numeric PFAS limits for biosolids, but a draft risk assessment released on January 15, 2025, marks a first step in that direction.
Historically, EPA’s “PFAS Strategic Roadmap”progress reports have stated it would complete by winter 2024 a risk assessment for PFAS in biosolids for use in determining whether to regulate these particular substances in biosolids.
The upshot of EPA’s draft risk assessment states the following:
The draft risk assessment indicates that there are potential risks to human health to those living on or near impacted properties or primarily relying on their products from land application. . .
* * *
After the public comment period has closed, the EPA will. . . prepare a final risk assessment. . . If the final risk assessment indicates that there are risks above acceptable thresholds when using or disposing of sewage sludge, the EPA expects to propose a regulation under CWA section 405 to manage PFOA and/or PFOS in sewage sludge to protect public health and the environment.
Last year, on June 6, 2024, a federal lawsuit was commenced seeking to compel EPA to establish regulatory standards for PFAS in land-applied biosolids. Farmer, et al. v. EPA, No. 24-cv-1654. The plaintiffs in that case allege the EPA’s inaction has allowed PFAS-laden biosolids to contaminate millions of acres, harming farmers and the public. This lawsuit is currently moving slowly with preliminary matters and no resolution is expected for at least another year.
One thing is certain in the coming months and years. Those farmers and agricultural stakeholders across the country involved in the common practice of land-applying biosolids will see significant change mandated in their practices and operations by the emergence of PFAS regulation in biosolids.
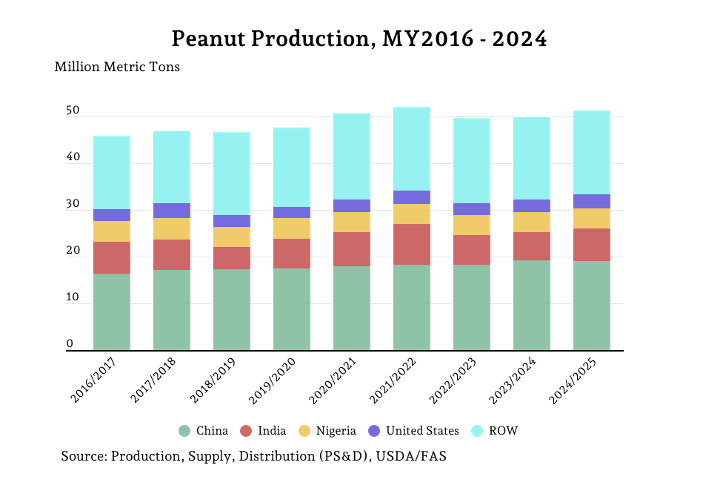
Five countries produce 70 percent of the world’s peanuts annually. In the 2024/2025 marketing year, 51.4 million metric tons (MMT) of peanuts were grown, and these five leading countries contributed 35.1 MMT to that total. The United States ranks fourth in global peanut production (2.9 MMT) behind China (19 MMT), India (7.1 MMT), and Nigeria (4.3 MMT).
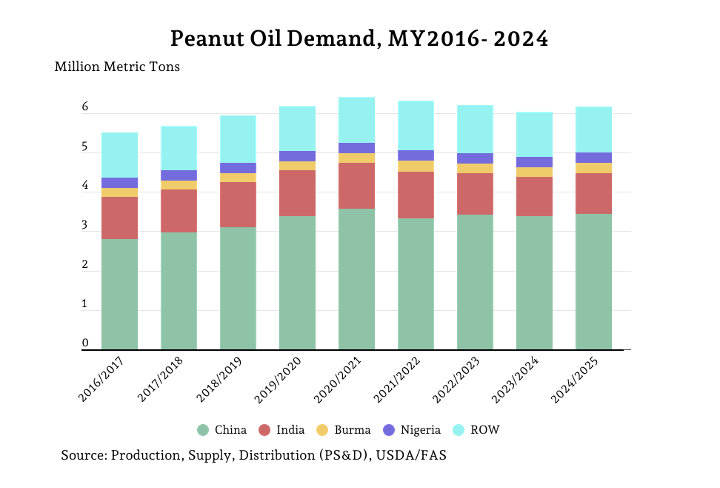
Production of peanut oil for the five largest markets together accounted for 81 percent of the 6.24 MMT of global production in the 2024 marketing year. Leading global producers, Chinese production has remained relatively stable between 3.1-3.23 MMT since the 2019/2020 marketing year. Indian production has been similar with production between 1.2-1.28 MMT since the 2019 marketing year. The three that follow together accounted for only 694 thousand metric tons (TMT).
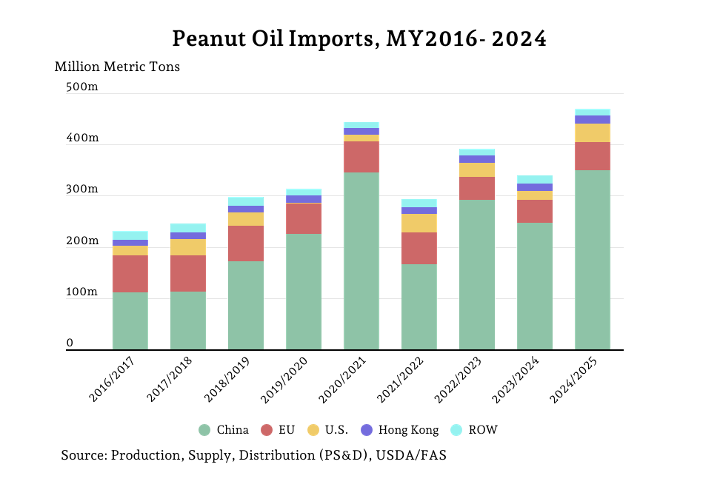
Only 470 TMT of peanut oil production was traded in the 2024 marketing year, or 7.5 percent of peanut oil production. The five largest exporters accounted for 91.8 percent of exports in the most recent marketing year. On the other side of that trade, the three largest importers totaled 93.8 percent of peanut oil imports. China accounted for most of that, with 350 TMT in the most recent marketing year, or 74.4 percent of peanut oil imports. The European Union (55 TMT) and, United States (36 TMT) are the two other largest markets.
In the 2024 marketing year, global demand for peanut oil totaled 6.16 MMT, with 83.7 percent going to the five largest markets. More than half of global demand for peanut oil can be attributed to China. India ranks second, despite being a recurring leader for global exports, with just over one million metric tons. Demand in the United States has remained stable around 123-148 TMT, with the exception of the 2019/2020 marketing year, which was around 111 TMT. Excluding the 2019 marketing year, where only 2 TMT of peanut oil was imported, 10-26 percent of demand for the United States is supplied from imports.
References
USDA Foreign Agricultural Service (FAS). Peanut Oil Custom Query. Production, Supply, Distribution (PSD). Online public database. Accessed June 2025.
Like many other agricultural sectors, there has been consolidation in United States (US) farm-level sugar production. Sugar is a unique commodity because about 56 percent of the domestic production of sugar originates from sugarbeets and 44 percent originates from sugarcane. The US domestic production of sugar has increased from 8.02 million short tons raw value (STRV) in 1997 to 9.31 million STRV in 2024, an increase of 16% (USDA ERS, 2025a). However, there are now 50 percent fewer sugarbeet and sugarcane farms in the country.
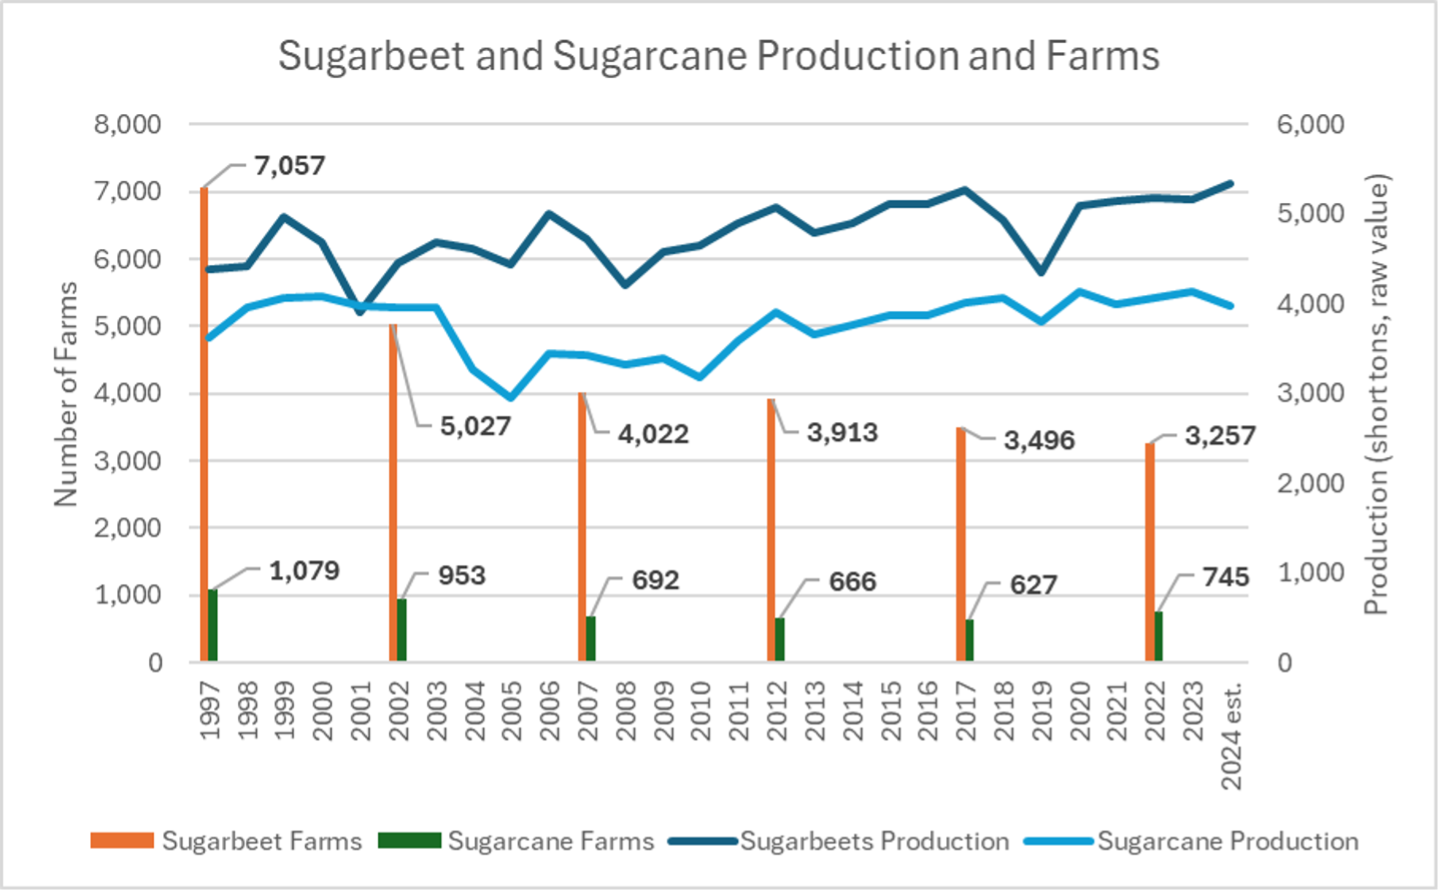
In 1997, the USDA Census of Agriculture recorded a total of 8,136 sugarbeet and sugarcane producing farms (USDA NASS, 2025). However, by 2022 that number had declined to 4,002, a decrease of over 50 percent. Figure 1 shows sugarbeet and sugarcane production from 1997 through 2024 and the number of sugarbeet and sugarcane farms recorded by the US Census of Agriculture every five years, beginning in 1997.
Figure 1. Sugarbeet and Sugarcane Production and Farms.
Source: USDA ERS (2025a) and USDA NASS (2025).
Sugarbeets
From 1997 through 2022, while there was a decrease in sugarbeet farms and sugarbeet harvested acres, there was an increase in the amount of sugar produced from sugarbeets. The number of sugarbeet farms fell by 54 percent, from 7,057 farms in 1997 to only 3,257 in 2022 (Figure 1). Sugarbeet acres also fell by 20 percent from 1.43 million acres in 1997 to 1.14 million acres in 2022 (USDA ERS, 2025a). However, there was an 18% increase in sugar produced from sugarbeets during this time, with 4.39 million STRV of sugar produced from sugarbeets in 1997 and 5.19 million STRV of sugar produced from sugarbeets in 2022 (Figure 1).
These trends indicate that in 1997, the average sugarbeet farm size was 203 acres contributing to final sugar production of 622 STRV (3.06 STRV of sugar per acre). Meanwhile in 2022, the average sugarbeet farm size was 350 acres contributing to final sugar production of 1,593 STRV (4.55 STRV of sugar per acre). Thus, sugarbeet farms have become not only larger (350 acres per farm versus 203 acres per farm), but they have also become 49 percent more efficient! One reason for this increased efficiency is that all sugarbeets grown in the US have been genetically modified since 2009 (Kennedy, Schmitz and Lewis, 2020).
Sugarbeets are currently grown in four regions and 11 states: the Great Lakes (Michigan), the Upper Midwest (Minnesota, South Dakota, and North Dakota), the Great Plains (Colorado, Montana, Nebraska, Wyoming), and the Far West (Idaho, Oregon, Washington).[1] Sugarbeets are grown in rotation with other crops. Historically, sugarbeet yields in the Far West have been highest. Western sugarbeet production typically utilizes irrigation, which is in contrast to the eastern regions of sugarbeet production that do not use irrigation (USDA ERS, 2025a, b). The largest region for sugarbeet production is the Upper Midwest (Minnesota and North Dakota) (USDA ERS, 2025a). The Upper Midwest represented 42 percent of sugarbeet total production in 1997 and represented 53 percent of sugarbeet total production in 2022 (USDA ERS, 2025a).
Each sugarbeet producing region has experienced both consolidation and increased efficiency over the years. For example, the number of sugarbeet farms in Michigan was 1,164 in 1997 (USDA NASS, 2025). That number decreased 43 percent by 2022 to only 663. However, the number of tons of sugarbeets harvested in 1997 was only 3.0 million, and by 2022 the state harvested 4.1 million tons of sugarbeets.
Sugarcane
Sugarcane has also experienced consolidation over the period of 1997 through 2022, where the number of sugarcane farms fell by approximately 31 percent from 1,079 in 1997 to 745 in 2022 without experiencing declines in sugar production or acres engaged in sugarcane production. Sugarcane acres actually increased by 3 percent in 2022 (913,738 acres) relative to 1997 (890,193 acres) (USDA NASS, 2025). Production of sugarcane (for sugar) also increased by approximately 11 percent to 4.06 million STRV in 2022 relative to 1997 (3.63 million STRV) (Figure 1).
These trends indicate that in 1997, the average size of a sugarcane farm was 825 acres and contributed to final sugar production of 3,365 STRV (4.08 STRV of sugar per acre). By 2022, the average sugarcane farm size was 1,226 acres and contributed to final sugar production of 5,454 STRV (4.45 STRV of sugar per acre). Thus, the sugarcane sector has seen improvements in production efficiency of approximately 9 percent over the observed period (1997-2022).
As recently as 2016, sugarcane was produced in four states (Florida, Louisiana, Hawaii, and Texas). Sugarcane production in Hawaii and Texas ceased in 2016 and 2023, respectively. In Hawaii, rising labor and land cost were contributing factors in the closure of Hawaiian Commercial & Sugar Company (HC&S) in Maui. Production in Texas ceased due to water shortages exacerbated by Mexico’s consistent failure to fulfill its treaty obligations to share irrigation water from the Rio Grande. The lack of sugarcane production due to uncertain water availability resulted in the closure of the only sugar mill in the state, Rio Grande Valley Sugar Growers, Inc. Since 2017, overall sugarcane production has increased in the remaining sugarcane producing states of Louisiana and Florida, despite closure of the sugarcane industries in Hawaii and Texas. In Florida, the number of farms has actually increased from 152 to 240, with the average farm size contracting from 2,772 to 1,656 acres. However, in Louisiana, farms have decreased from 705 to 420 farms. The average size of a Louisiana farm has increased from 561 to 1,158 acres.
In Florida, sugarcane is mainly produced in organic soils along the southern and southeastern shore of Lake Okeechobee in southern Florida. The decrease in Florida’s sugarcane acreage leading to 2007 reflected conversion of cropland to public water storage in response to the Comprehensive Everglades Restoration Plan and reallocation of cropland for sod production in the early 2000’s (VanWeelden et. al., 2023). Sugarcane cultivation on sandy soil is expanding as the expense of citrus cultivation has increased due to citrus greening disease (Sandhu et. al., 2024).
Sugarcane acreage across Louisiana has been expanding for the past decade, primarily because of the reduced volatility in sugar prices relative to other crops such as corn, rice, and soybeans. (Gautreaux, 2025). Louisiana sugarcane production has also expanded with the development and adoption of high-yielding sugarcane varieties and with the evolution of custom harvesting groups that induce nontraditional producers into sugarcane cultivation by alleviating concerns for those producers regarding increased capitalization costs of purchasing and maintaining specialized sugarcane harvest equipment.
[1] California is producing sugarbeets in 2025, but the processing facility will close following this crop season (https://www.smbsc.com/ourstory-2/SMBSCMediaReleaseReSpreckelsSugarCompany2025.04.22.pdf).
Kennedy, P. L., A. Schmitz, and K.L. DeLong. (2020). Biotechnology and demand concerns: the case of genetically modified US sugar beets. AgBioForum, 22(1), 49-60.
Sandhu, H., M. VanWeelden, A. Sharma, and W. Davidson. (2024). CP 03-1912: A Sugarcane Cultivar Expanding on Sand Soil in Florida, University of Florida, IFAS Extension. https://edis.ifas.ufl.edu/publication/SC111 .
United States Department of Agriculture (USDA), National Agricultural Statistics Service (NASS). (2025). U.S. Census of Agriculture, Volume 1, Chapter 1: U.S. National Level Data. Retrieved from: https://www.nass.usda.gov/Publications/AgCensus/2022/index.php .
VanWeelden, M., C. Kammerer, W. Davidson, M. Baltazar, and R. Rice. (2023). Sugarcane Variety Census: Florida 2022, Sugar Journal 86 (2), July 2023.
Delberto, Michael, Brian Hilbun, and Karen L. DeLong. “Sugarbeet and Sugarcane Production and Farm Trends.” Southern Ag Today 5(26.3). June 25, 2025. Permalink