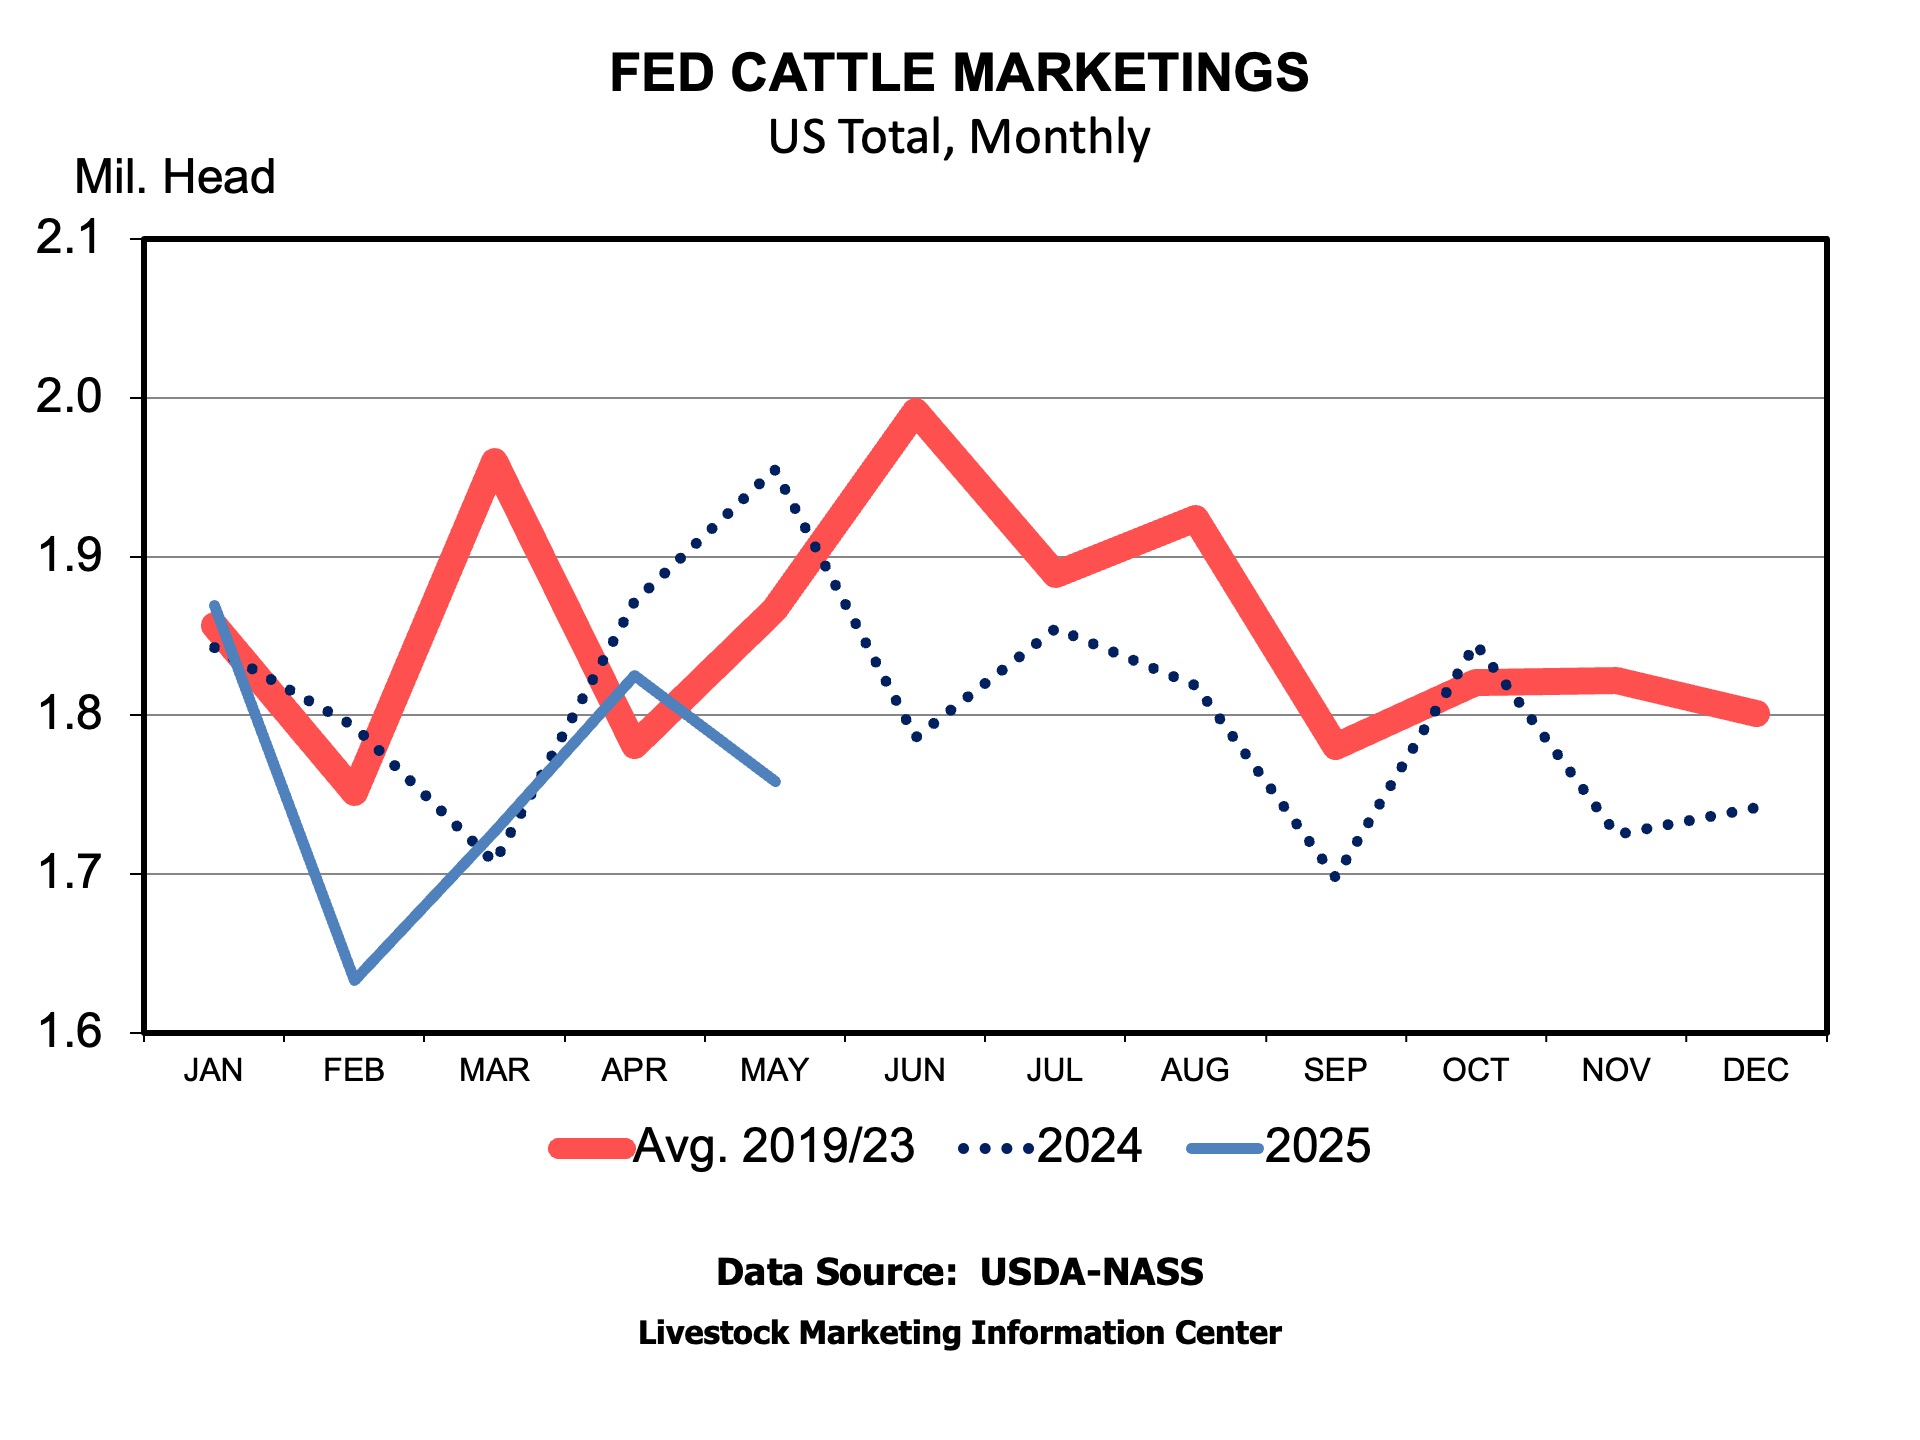
USDA released the latest Cattle on Feed report amid record high cattle and beef prices. While the report did not have any big surprises compared to analyst’s pre-report estimates there were some noteworthy data points. Marketings were 10.1 percent fewer in May 2025 than last May. Some of that was attributable to one less working day in the month, but the rest was due to fewer fed cattle slaughtered. An earlier SAT discussed fewer fed cattle being processed on Fridays over the last couple of months.
Fewer cattle were placed into feedyards in May, with placements 7.8 percent below last year. But, placements in Texas and Oklahoma feedyards were down 16.8 and 21.6 percent compared to last year, likely reflecting the continued border closing restricting the supply of Mexican feeder cattle. Fewer placements and marketing left the total number of cattle on feed down 1.2 percent compared to last year.
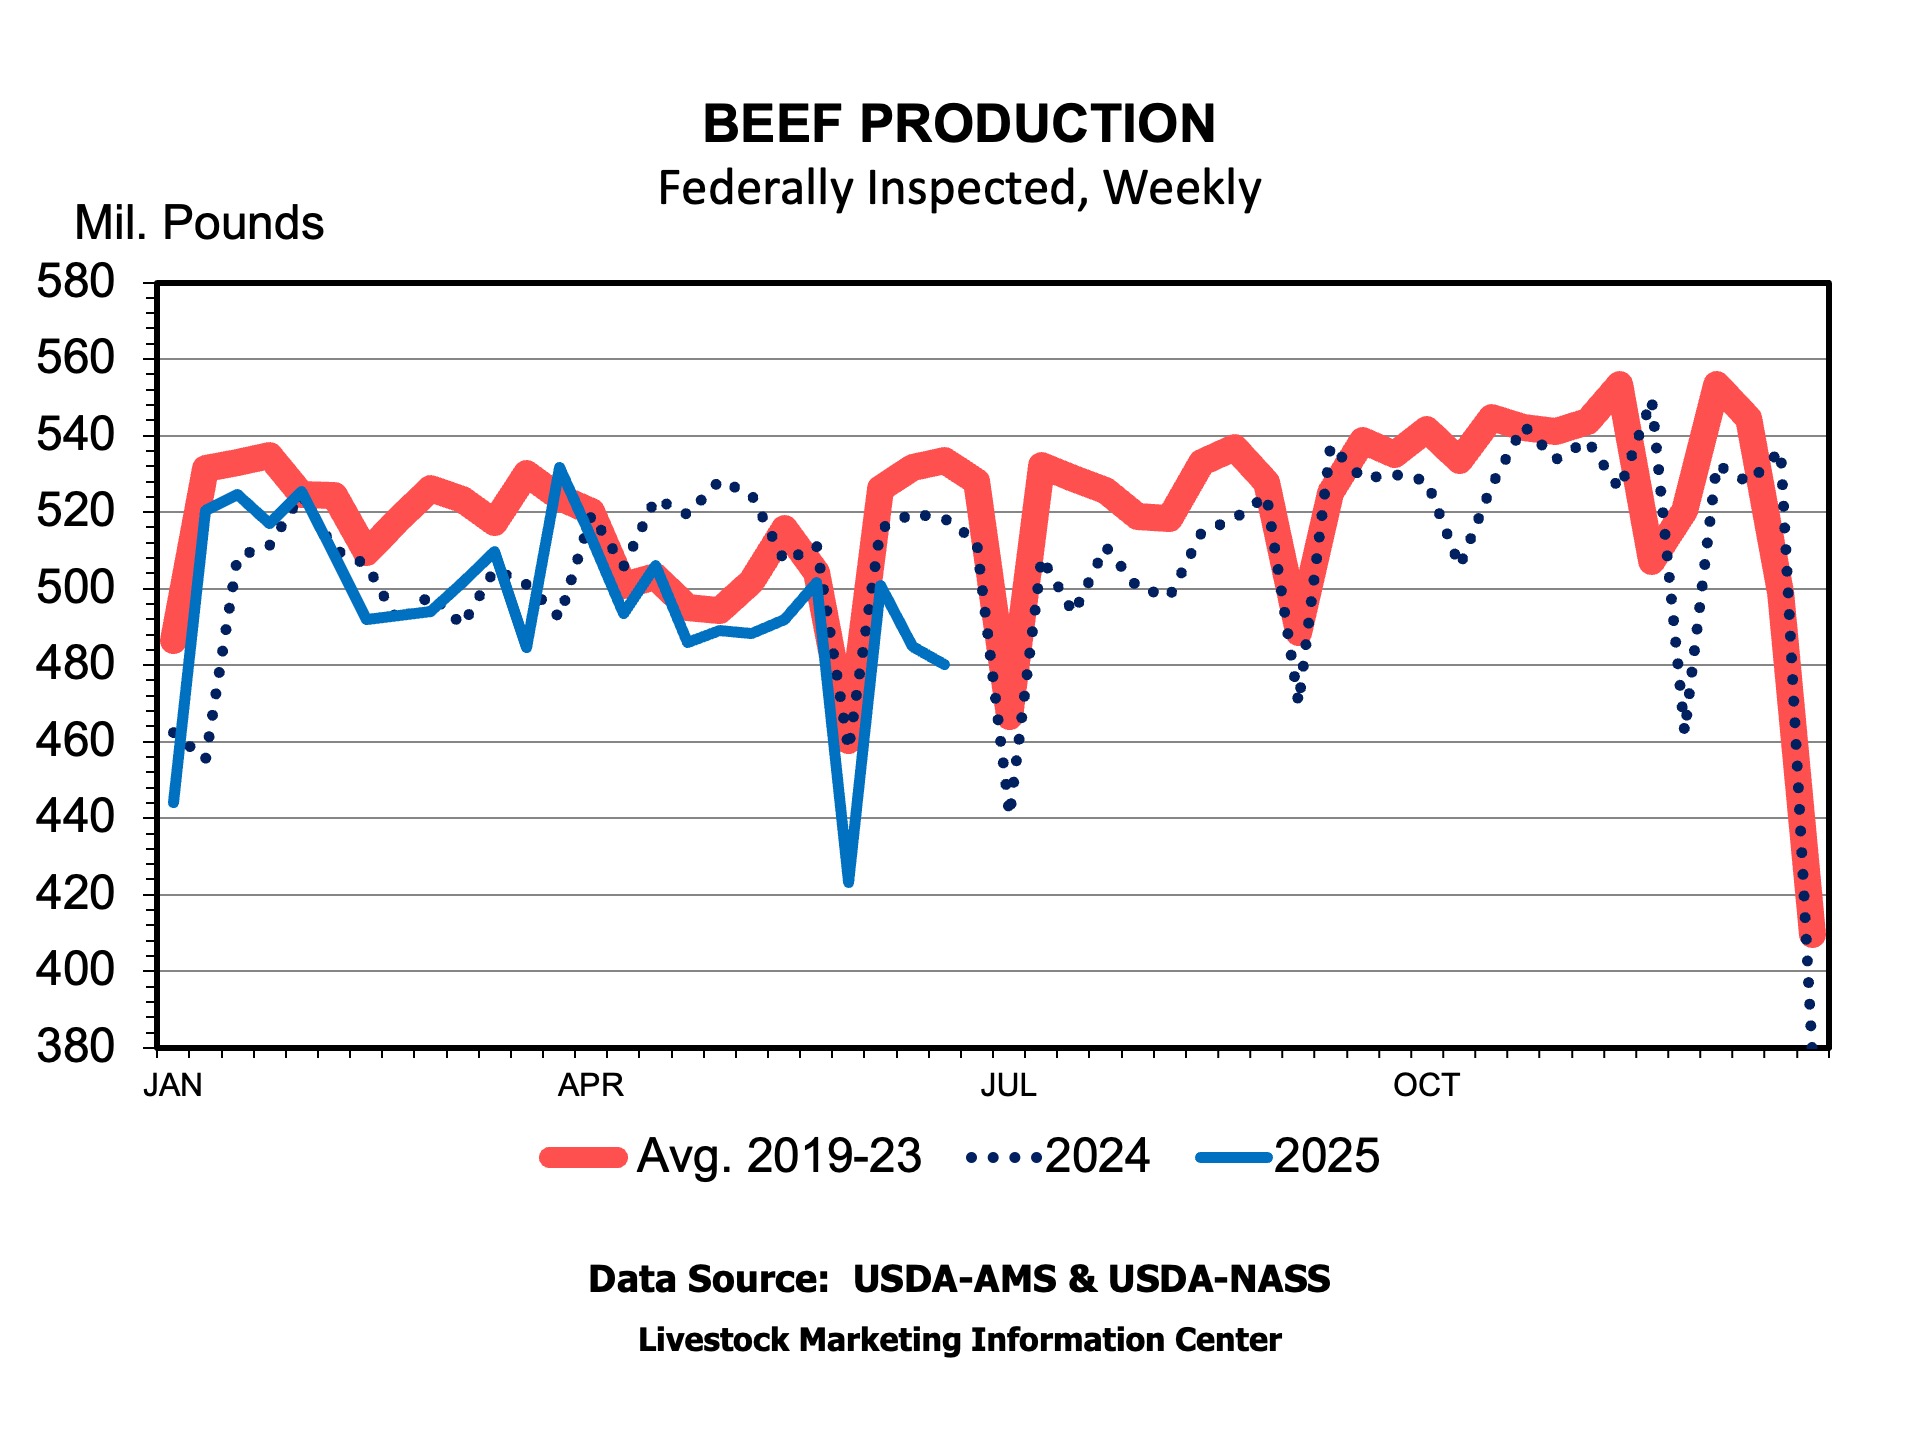
Fewer cattle marketed from feedlots means reduced fed cattle slaughter and beef production. Beef production over the last 8 weeks has been 5.5 percent below the same period last year. A smaller percentage of the beef graded has been grading Choice indicating tighter supplies of Choice beef in addition to lower overall supplies. While a lot has been made of continued good demand for beef pushing prices higher, certainly reduced supplies are helping higher prices too.
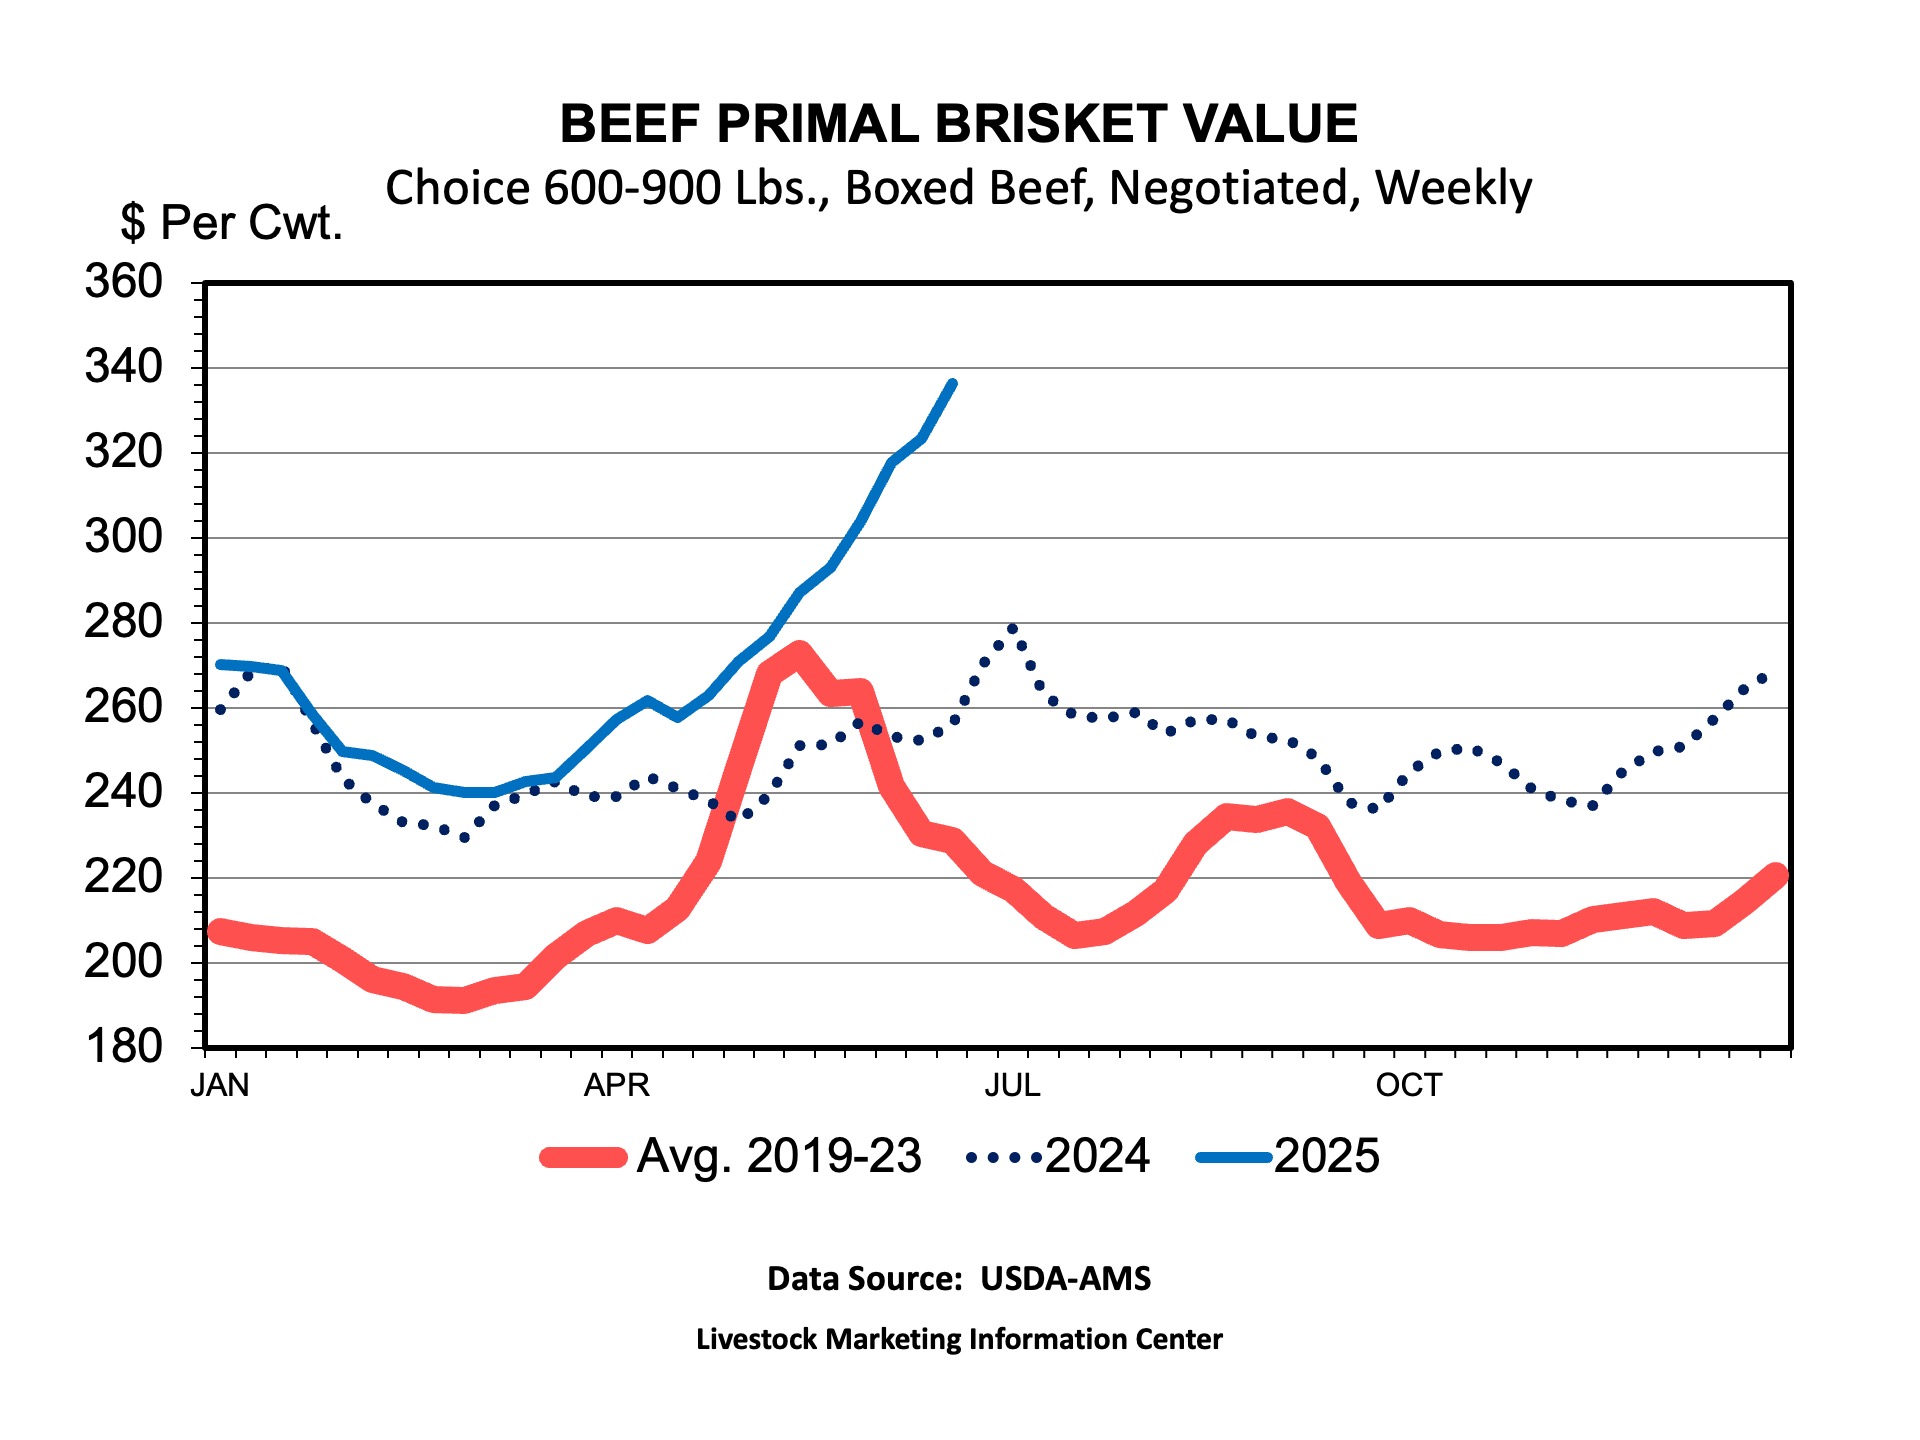
On the price side, the Choice cutout surged to $390 per cwt on Friday June 20th. That was a record except for May 2020. All of the Choice primal cuts have been racing higher except for the rib which has been declining, as it often does this time of the year. Of note, just as Texas Monthly’s Top 50 BBQ joints edition hit the mailbox primal Choice briskets kept climbing to almost $3.40 per pound. This would be a record brisket price except for May 2020 when the pandemic closed packing plants and a surge of buying depleted supplies.
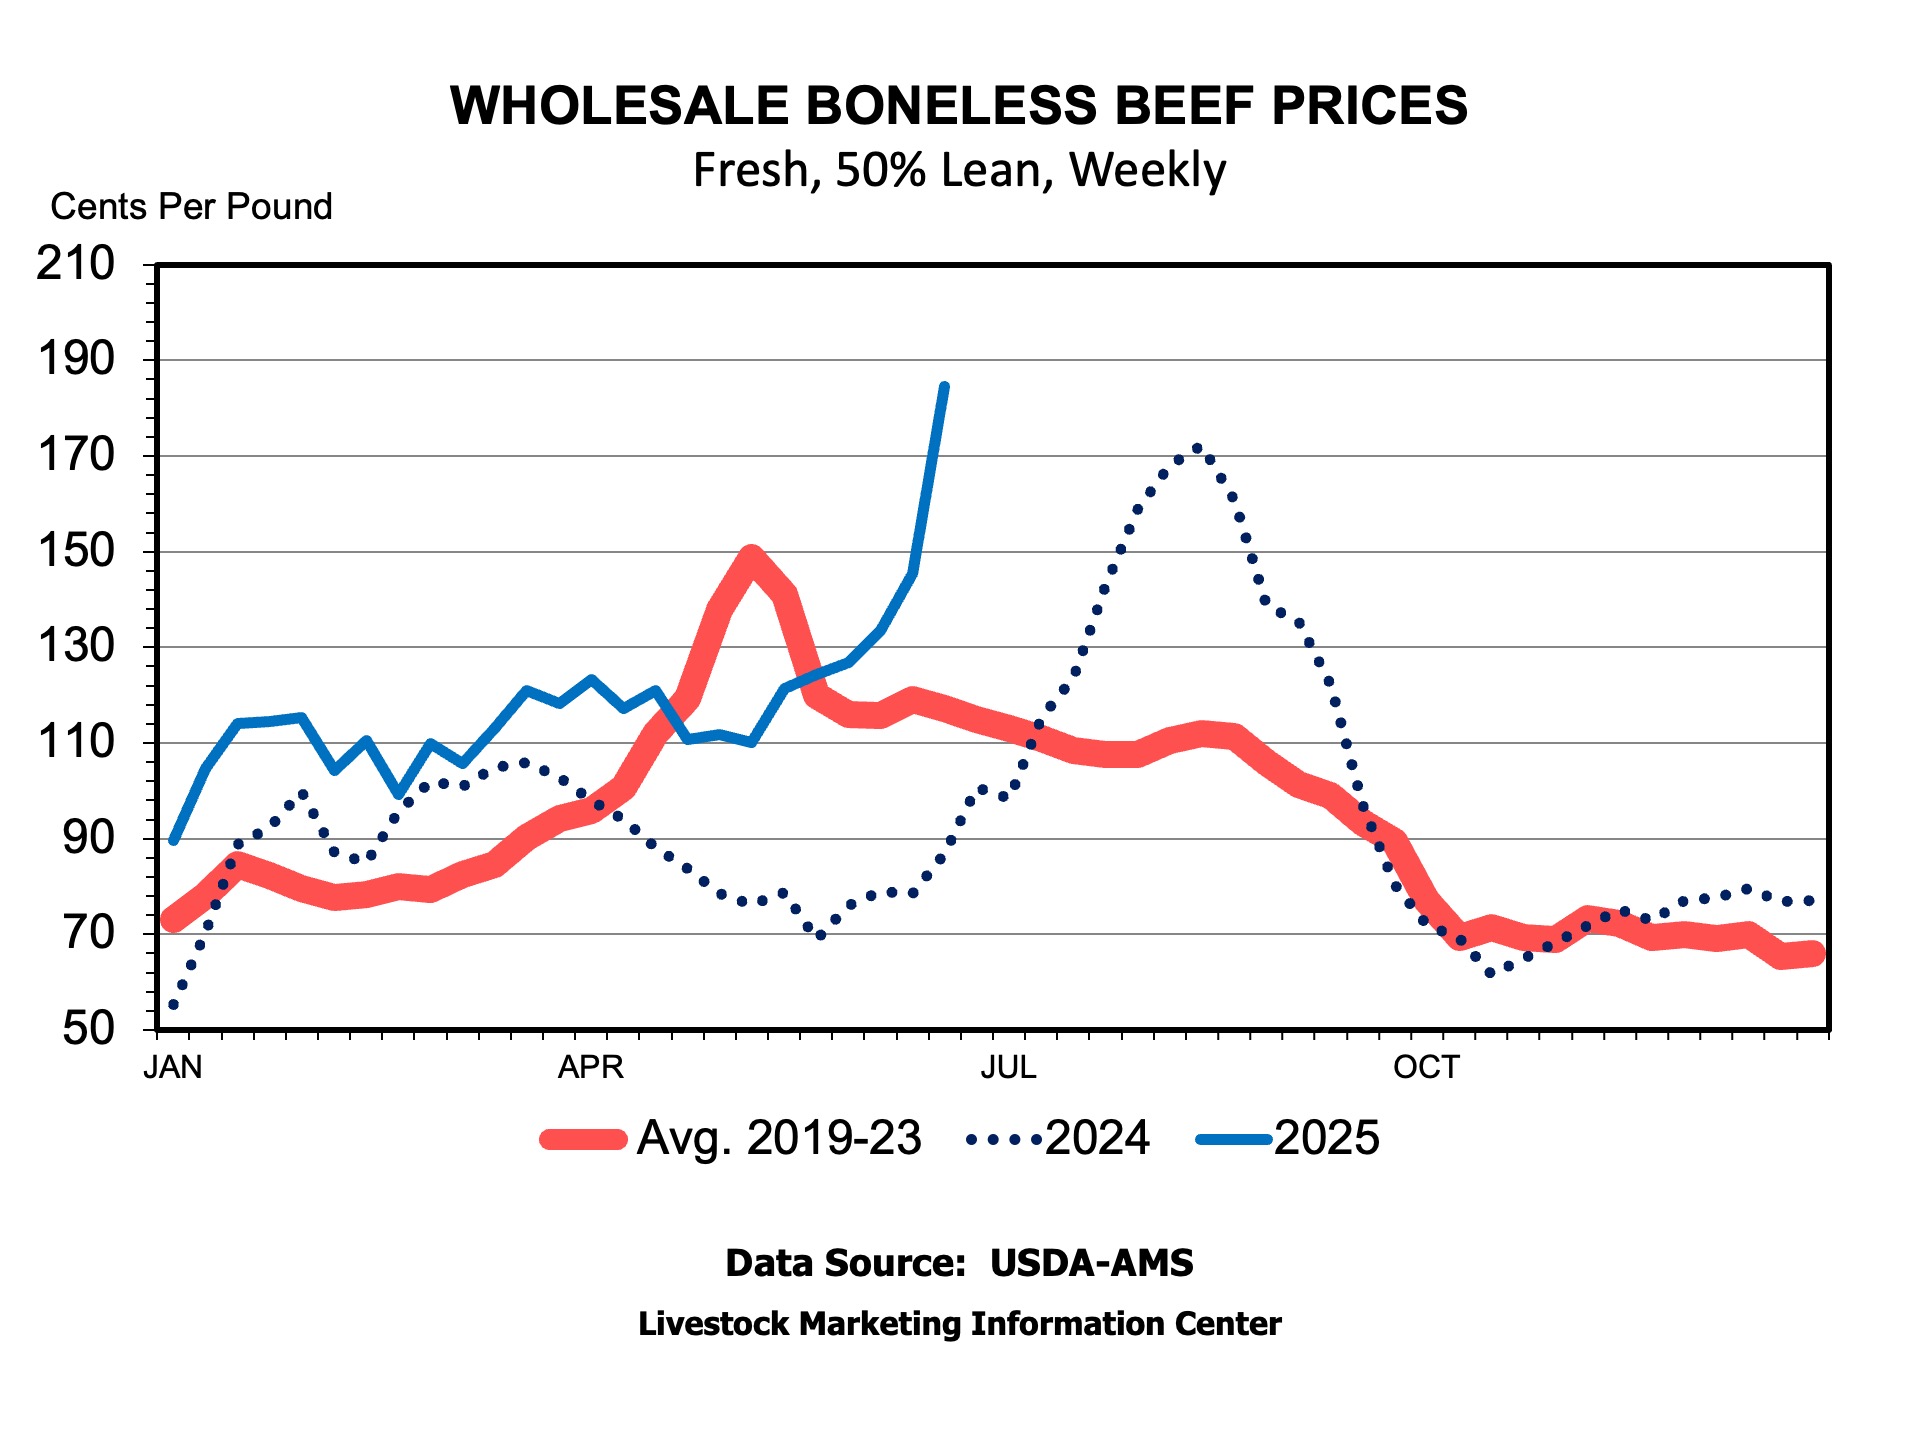
While not one of the primals that make up the boxed beef cutout value, 50 percent lean beef has skyrocketed in value to almost $190 per cwt, compared to about $1.00 per pound last year. This beef is largely the product of fed cattle and makes up part of the supplies of ground beef. Fewer fed cattle marketed and slaughtered in recent weeks has likely cut into supplies while the demand for ground beef remains good.
The marketings side of the cattle on feed report highlights today’s tight supplies of cattle and beef. Reduced production is part of the story of record beef prices.
Anderson, David. “Fewer Marketings, Tighter Beef Supplies.” Southern Ag Today 5(26.2). June 24, 2025. Permalink