It’s often said that everything is sold from cattle and hogs except the moo and oink. These products include all the variety meats, hides, tendons, and anything else. One category of these products that has been increasing in value is tallow, grease, and lard. These can be edible or inedible. Several factors have been important in increasing their values. One is the renewable fuel market. The increased demand for used cooking oil and animal fats to meet renewable standards has boosted prices. On the edible side, recent trends in deep-frying foods and French fries in beef tallow have further boosted demand. And it’s hard to make good biscuits or tamales without lard.
USDA reports weekly prices for several types of these fats. As you might expect for these types of products, prices are often not reported every week. But what is reported can give us some insight into added values to cattle and hogs.
Edible tallow, delivered to Chicago, was $58 per cwt for the week ending May 2nd compared to $49 per cwt the same week in 2024. For the year-to-date, edible tallow has averaged $54.65 per cwt versus $51.82 per cwt last year. While prices are generally higher than last year, tallow prices hit $92 per cwt in September of 2022. A decade ago, edible tallow was about $30 per cwt.
Choice, inedible white grease hit its high price for the year, $51 per cwt, in April. It was $39 per cwt in April 2024. Bleachable, inedible tallows have seen similar price increases compared to last year. A decade ago, these products were about $26 per cwt.
While growing demand has certainly been a factor in rising prices, the supply side is also important. Fed cattle weights have been increasing to record highs. Increasing weights are mitigating tallow supply declines due to fewer head produced. Heavier fed cattle weights have led to more yield grade 4s and 5s, resulting in more fat on the market. While cattle are discounted in price if they fall into yield grade 4 and 5, the rising value of tallow helps to offset the lost value. Tallow, grease, and lard are a small portion of the total value of a carcass, but every little bit adds value to cattle and hogs.
Anderson, David. “Tallow and Lard.” Southern Ag Today 5(23.2). June 3, 2025. Permalink
A decade ago, our friends & colleagues, Extension Economists across the Southern region, developed a comprehensive collection of articles in Surviving the Farm Economy Downturn. Well… what is old is new again. The issues addressed in that publication are all too relevant today. With stagnant crop prices and elevated costs of production, the resulting thin margins in crop production make for a challenging economic environment, to say the least. Side note: it was this early collaboration that also marked the beginning of Southern Ag Today.
Back in February, we highlighted 5 key farm management strategies from the collection (see Managing Through Tough Times). Today, we’re focusing on one particular article discussing the borrower/lender relationship. While most annual operating loan renewals are in place for the crop year, it’s a good time to emphasize the idea that the borrower/lender relationship should be ongoing throughout the year. Key takeaways from Working With Your Ag Lender in Good Times and Bad:
Partnership
The dynamics of the borrower/lender relationship are unique. Much more than a simple customer transaction, both parties are dependent and literally invested in the business of the other. As such, both should consider it a partnership and expect to work together.
Full Disclosure/Trust
A good partnership needs to be built on trust. Both parties should be open about their business as it affects the other. Borrowers should disclose any changes to original plans and/or other transactions that affect repayment capacity. Lenders should fully disclose their processes, standards, credit decisions, and timing, which could affect the borrower’s access to capital and business operations.
Communication
Communication should be continual. Don’t leave your credit discussion to that once a year loan renewal process. Both sides should be willing to have ongoing discussions about progress, ideas, successes, and challenges. Importantly, don’t just engage in communication because you have something to say. Start a conversation for the sake of what you need to hear.
Know your business
One of the things that makes a borrower a good partner is that they know and can explain their own business very well. A manager who is on top of their game builds confidence in the lender. The same is true for making a lender a good partner. Borrowers want lenders who are well-versed in the operations of their credit institution.
Know your partner’s business.
We all remember a Grandmother telling us, “Mind your own business.” At some point, she probably also told you to “put yourself in the other person’s shoes.” In this case, it is the business of both partners to put themselves in the other’s shoes. Each should take the time to understand how the other operates, their incentives, their profit structure, and how they make decisions. Listen and learn from each other, and… always listen to your Grandmother.
Understanding the Gaps Between Innovation, Labor, and What Really Works on the Farm
The COVID-19 pandemic exposed weaknesses in food supply chains, prompting renewed interest in innovation. Technologies like artificial intelligence (AI), precision farming, and robotics offer potential solutions, but their success depends on how well they are integrated into real-world farming systems. Mechanization is not a one-size-fits-all solution. However, most research has focused on creating new tools, not on how these tools fit into existing production systems and supply chains.
Heavy Dependence on Manual Labor
Specialty crops like fruits, vegetables, and nuts require careful handling and most are harvested by hand. Labor shortages and rising labor costs are major concerns for these industries, but replacing human labor with machines is not straightforward. The complexity and diversity of specialty crops in size, shape, and growing conditions, makes it hard to design machines that can work across different crops and farm types. Many farms don’t have workers who know how to use or fix new machines. This means schools and training programs need to do a better job of teaching these skills. To quote an 8 May 2025 article “The Silent Risk in Supply Chain Technology? Poor Training,” “Gartner Vice President Analyst Tom Enright delivered a clear message to supply chain leaders: the success of digital transformation initiatives will depend less on the technology itself and more on the people expected to use it.” In our competitive world, learning is a two-way street between the business and its technological tools and the people who contribute the skills and time as employees of that business.
Slow Adoption of Technology
Even though mechanization and automation technologies exist, they are not widely used in specialty crop farming. Farmers are cautious about adopting new tools due to high costs and uncertainty about their effectiveness. Developing and testing new technologies is expensive and represents high levels of financial and production risk especially to small farms and early adopters. Funders and developers must “de-risk” these innovations to make them more attractive to farmers, which involves identifying and eliminating non-viable options early.
Workforce Skills and Human Factors
New technologies often require skilled operators. Hamilton et al. (2021) investigated the slow adoption rate of mechanical harvesting in U.S. agriculture and concluded, “If farmers are less willing to invest in capital [equipment] that ultimately leads to higher wages, then long-term productivity growth is likely to be lower, and the problem will persist (p. 1456).” There is a need to consider where tech-savvy workers are most needed and how to train them.
Mechanization affects not just the tools used, but also the skills, attitudes, and regulatory systems within agriculture. For example, California farmers and tractor companies have unsuccessfully lobbied to change the state’s decades-old ban on the use of autonomous agricultural tractors and robots to replace hard-to-find workers. Implementing change requires more than just new machines—it requires a shift in how the entire system communicates along the food supply chain.
Mechanizing specialty crops is a complex challenge that involves more than just building better machines. It requires understanding the entire agricultural system—people, economics, and technology. Economists, engineers, regulators, and farmers must work together to create solutions that are practical, scalable, and sustainable. It’s not just about buying new machines—it’s about training people and creating machines to work smarter and make choices that keep paychecks and profits growing.
Investment and Incentives Serviss and Thornsbury examine how farmers and industries decide whether a new technology is worth the cost. They ask: What makes a tool truly cost-saving? How can we measure its impact across the whole system?
Knowledge and Awareness Loor and Roka explore how information about new technologies spreads. They ask: What do farmers already know? What more do they need to know? How can agricultural extension services help?
Right-Sizing Technology Neill looks at how well new tools fit into different types of farms. He asks: Can we design machines that work for both small and large farms? How do we address the challenges of scale?
Human Skills and Systems Morgan focuses on the people who use the technology. She asks: Where do we need skilled workers most? Are we asking the right questions about how people and machines can work together?
Hamilton, S.F., T.J. Richards, A.P. Shafran, and K.N. Vasilaky. 2021. “Farm Labor Productivity and the Impact of Mechanization.” American Journal of Agricultural Economics 104(4):1435–1459.
Holt, J. 1989. “Managing Change in Extension.” American Journal of Agricultural Economics 71(4):869–873.
Moragn, Kimberly L.. “High-Tech Tools, Real-World Problems: Farmers’ Views on Mechanization Challenges.” Southern Ag Today 5(22.5). May 30, 2025. Permalink
Distilled spirits fall into six main categories: whiskey (which includes bourbon), vodka, rum, gin, tequila, and brandy. Each is defined by its key ingredient, for example, rum is produced from sugarcane, brandy from grapes, and whiskey from corn and other grains. Production methods, geography, and legal requirements also help in defining these categories. Tennessee Whiskey and Kentucky Bourbon are iconic American spirits, elevating these states to leading exporter status.
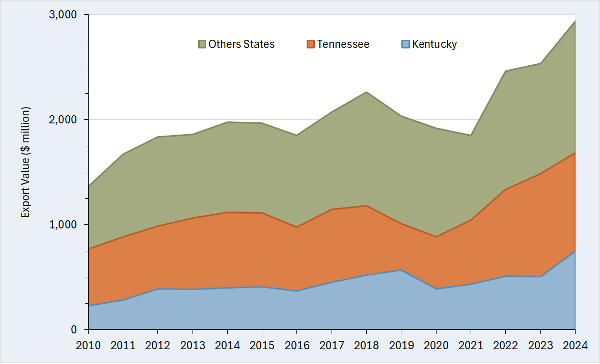
American distilled spirits enjoy global popularity and are among the nation’s top agricultural exports. Despite disruptions from the 2018 trade war and the COVID-19 pandemic, exports have shown a steady upward trend reaching almost $3.0 billion in 2024 (Figure 1). Tennessee and Kentucky lead the nation in distilled spirits exports, consistently ranking first and second among exporting states, respectively. While distilled spirits make up approximately 2% of total agricultural exports nationwide, they dominate sales in both states, accounting for 36% of Tennessee’s and 48% of Kentucky’s agricultural exports in 2024. That year, Tennessee exported over $900 million worth of distilled spirits, while Kentucky shipped around $750 million, together comprising more than half of the country’s total distilled spirits export revenue. For comparison, Texas, the third-largest exporting state, had around $350 million in distilled spirits exports in 2024.
Both Canada and the EU have been embroiled in the recent trade actions by the Trump Administration. In response, both countries have either implemented or proposed retaliatory tariffs on U.S. good including distilled spirits. What is at stake if Canada and the EU impose retaliatory tariffs on American distilled spirits?
Because retaliatory tariffs could seriously impact distilled spirits, disrupting export sales, economic activity, and job stability, it is essential to evaluate what is at risk. Our research shows that although export sales to the EU and Canada for the two states combined average around $760 million annually from 2022-2024, the totaled economic impact was over $1.2 billion and nearly 3,000 jobs. These findings highlight how distilled spirits exports create a ripple effect, influencing employment, tax revenue, and business activity across multiple sectors in Tennessee and Kentucky. If Canada or the EU were to impose tariffs on U.S. distilled spirits, it could lead to reduced exports, affecting the economic stability of distilleries and related industries. This could result in job losses, decreased income for workers, and lower tax revenues, ultimately harming the regional economy.
Figure 1. U.S. Distilled Spirits Exports (Tennessee, Kentucky, and Other States): 2010 – 2024
Source: Reprinted from forthcoming article in Choices. See the reference list.
For More Information
Muhammad, A., R.J. Menard, S.A. Smith (2025) “Tennessee and Kentucky distilled spirits: What’s at stake from a new trade war?” Choices (In Press).
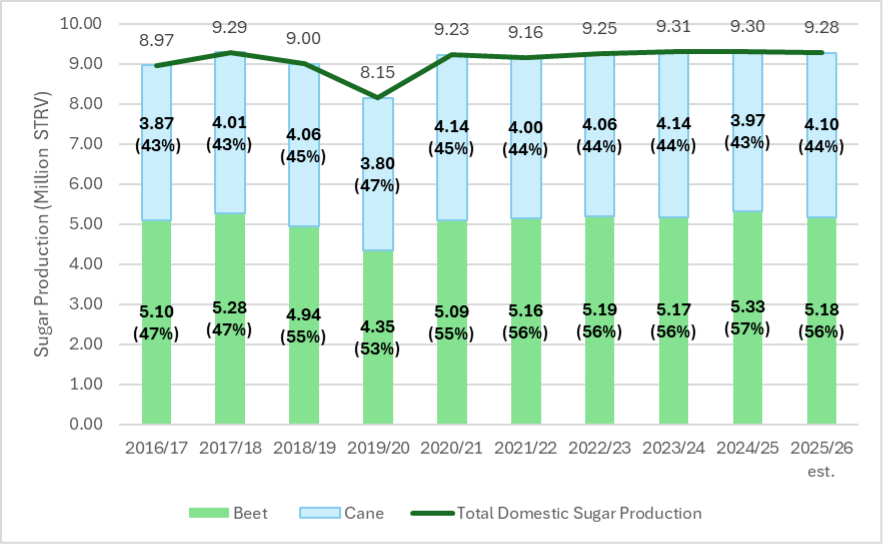
On May 12, 2025, the USDA released its World Agricultural Supply and Demand Estimates (2025) report which provides the first 2025/26 fiscal year (FY) estimate of United States sugar production. United States domestic sugar production, which consists of sugar extracted from both sugarbeets and sugarcane, is estimated at 9.285 million short tons raw value (STRV) for the 2025/26 FY (USDA WASDE, 2025). Domestic beet sugar production is estimated at 5.180 million STRV, or 56% of total domestic production, and domestic cane sugar production is estimated at 4.105 million STRV, or 44% of total domestic production (Figure 1).
Total domestic use of sugar is predicted to be 12.355 million STRV which includes estimated domestic sugar production of 9.285 million STRV, U.S. sugar imports of 2.475 million STRV, and net stocks usage (beginning stocks minus ending stocks) of 0.596 million STRV (USDA WASDE, 2025). Thus, net stocks usage plus domestic sugar production is estimated to account for about 80% of the domestic use of sugar.
The estimated FY 2025/26 domestic sugar production (9.285 million STRV) represents a 26,000 STRV reduction from last year’s total domestic production of 9.311 million STRV (Figure 1). The 2025/26 FY has an estimated slight increase in cane sugar production that is offset by a decrease in beet sugar production, ultimately resulting in the slight year-over-year decrease in overall domestic sugar production.
Beet sugar production is estimated at 5.180 million STRV, a 154,000 STRV decrease (2.9%) from the year prior. Sugarbeets are produced in the Upper Midwest, Great Lakes, Great Plains, and Far West regions of the country. United States estimated 2025/26 FY sugarbeet planted area (1.104 million acres) is based on the USDA National Agricultural Statistics Service (NASS) (2025) March Prospective Plantings report. The estimated harvested area (1.081 million acres) is derived using a 10-year average of harvested-to-planted ratio. The sugarbeet shrink (6.76%) and recovery rate (14.78%) are both projected based on the 10-year national average.
Sugarcane is now produced in only two states- Florida and Louisiana. Cane sugar output is forecast at 4.105 million STRV, up 128,000 STRV (3.2%) from the year prior. Louisiana’s output is projected at 2.088 million STRV, reflecting six consecutive years of increase, and four years of surpassing Florida sugar production. Sugarcane acres in Louisiana have been increasing due to the attractiveness of sugar compared to other alternative crops, availability of custom harvest groups, and acreage expansion northward in the central region of the state. Florida’s cane sugar production is projected at 2.017 million STRV (USDA WASDE, 2025).
Figure 1. United States sugar production by source, 2016/17 FY through estimated 2025/26 FY.
Source: USDA WASDE (2025). Notes: Parentheses show cane and beet sugar production as a percentage of total domestic sugar production.
Like many other agricultural sectors, the sugar sector has faced challenges. Namely, the tightening of operating margins due to rising costs of production (Deliberto and DeLong, 2024a) and flat or falling prices (Deliberto, DeLong, and Fischer, 2024b). This is most evident in the recent closures of sugar processing facilities in several states. Since 2000, roughly 40% of United States sugar mills, refineries, and sugarbeet factories have closed (i.e., 29 closures with 42 remaining open) (American Sugar Alliance, 2025; Louisiana Sugarcane Industry, 2025; Fischer, Outlaw, Raulston, and Herbst, 2022).
Most recently, there have been three notable closures. In 2023, the Sidney Sugar Company in Montana closed due to falling prices for sugarbeets (Western Ag Network, 2023). Next in 2024, the Rio Grande Valley Sugar Growers, Incorporated ceased operations (Food Business News, 2024). The facility terminated operations due to Mexico’s failure to comply with the provisions of the 1944 Water Treaty between the U.S. and Mexico that governs water sharing between the two nations on the Colorado River and the Lower Rio Grande. Most recently, it was announced that the last remaining sugarbeet processing facility in California will be decommissioned at the end of this season – the Spreckels Sugar Company, Incorporated in Brawley, California (Southern Minnesota Beet Sugar Cooperative, 2025).
In recent months, U.S. wholesale prices for beet and cane sugar have been falling (USDA Economic Research Service, 2025). Coupled with the rising costs of producing sugarbeets and sugarcane and processing them into sugar, this has created very tight operating margins for sugar producers (Deliberto and DeLong, 2024a). Looking ahead to the next growing season, farmers are optimistic that a new Farm Bill will strengthen the farm safety net and that growing conditions will be favorable for sugarbeets and sugarcane.


