Blog

  • Cow Culling Climbing Seasonally

    Cow Culling Climbing Seasonally

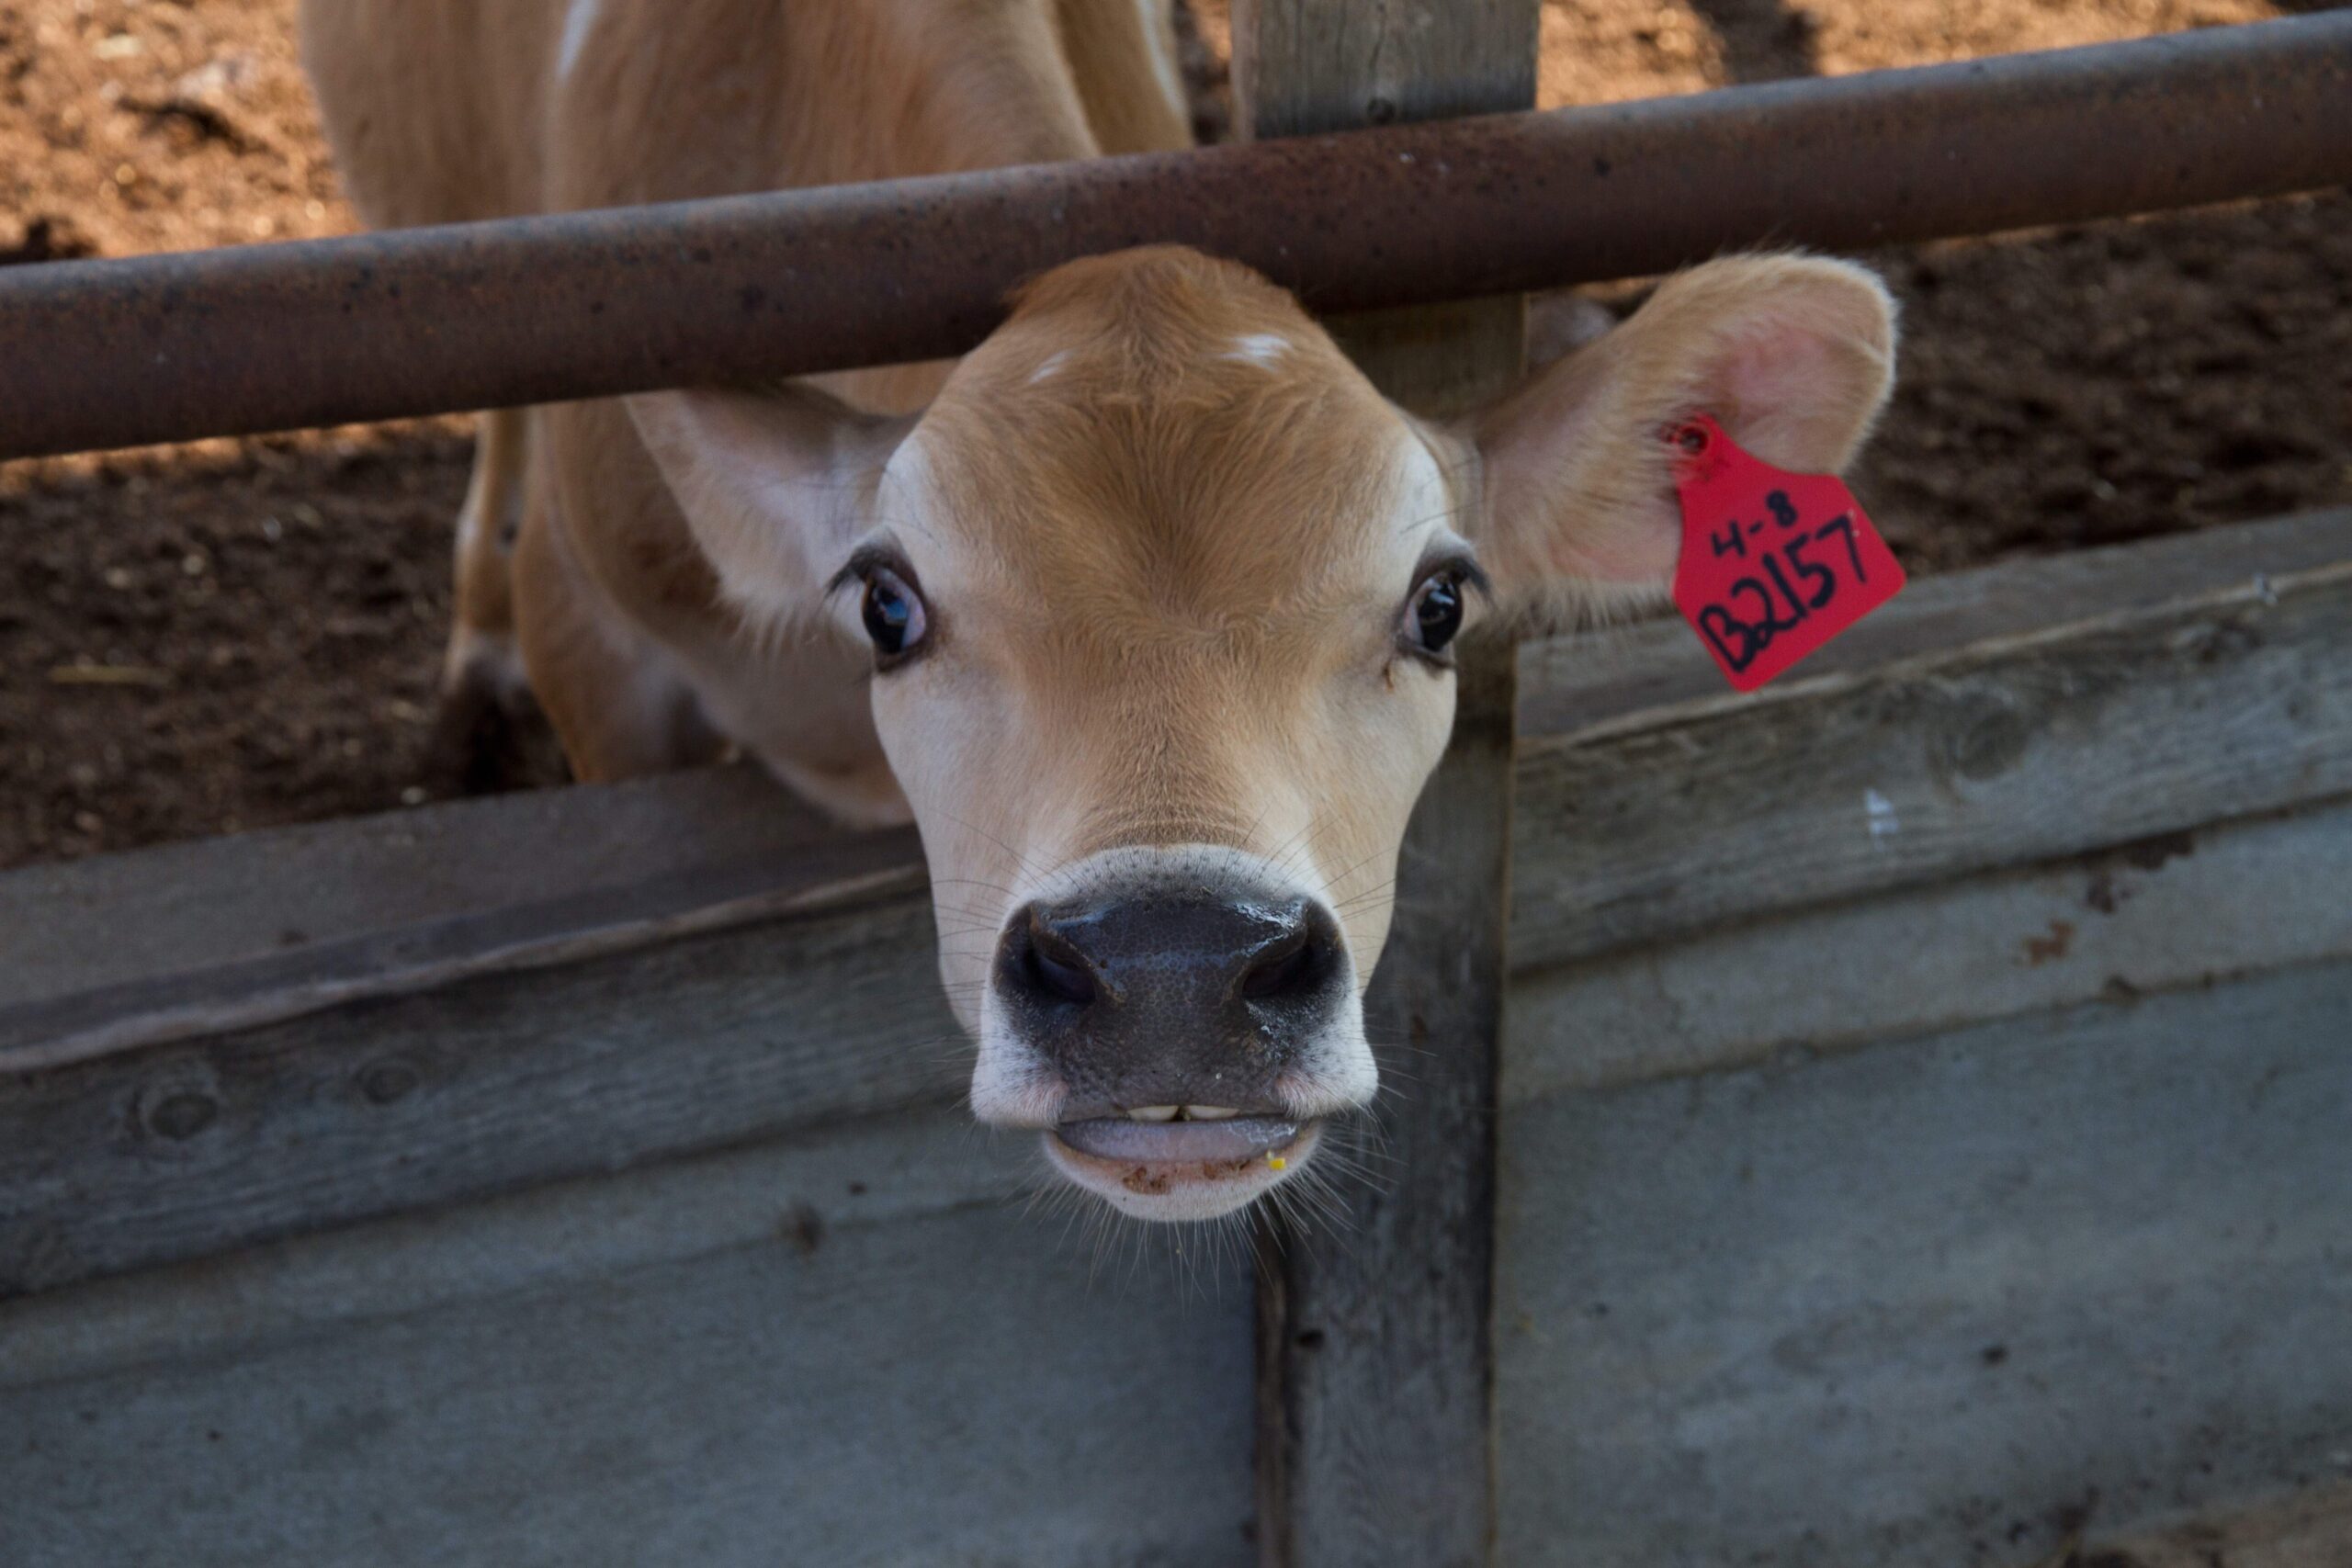
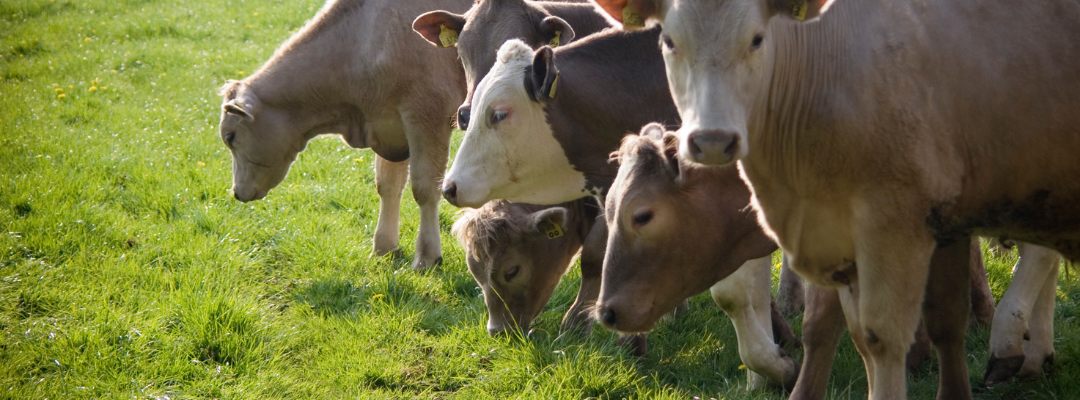
    Cow culling, as indicated by the weekly cow slaughter data, is starting to increase going into the last quarter of the year but cow slaughter normally peaks in the Fall because that’s when more beef cow culling decisions are made.  For the week ending September 23rd, the last data available, 127,600 cows went to federally inspected plants, the largest week since the last week of June.  For the year, cow slaughter has totaled 4.8 million head, 5.6 percent less than last year. 

    The total cow slaughter data masks the different seasonal patterns for beef cows and dairy cows.  Beef cow slaughter typically peaks in the Fall and is at its lowest around February-March.  Beef cow slaughter is down 13.4 percent compared to a year ago.  The data is reported by region with Region 6 including Texas, Oklahoma, Louisiana, and Arkansas.  The rest of the South (except Virginia) are reported in Region 4.  Beef cow slaughter in Regions 4 and 6 are 4.9 and 19.3 percent lower than last year, respectively.  Cow culling in the deep South has not fallen as much as the average across the country, while slaughter in the western part of the South has fallen faster than the average.  That may suggest some ability or willingness to try to expand herds in different parts of the region.

    Dairy cow slaughter typically peaks in the January-March period.  Low milk prices and margins have triggered more culling this year with dairy cow slaughter 4.6 percent higher than last year.  Higher prices and improving margins over the last 3 weeks have finally pulled down dairy slaughter below a year ago.

    Cull cow prices appear to have topped out seasonally and are starting to decline.  Southern Plains auction prices declined to $72 per cwt last week, their lowest since June.  While tight beef supplies are keeping prices high, the cull market loses the impact of grilling season demand once we are past Labor Day.  

    What to Watch For?

    Even though beef cow culling normally increases this time of the year, watch for weekly slaughter relative to last year and the 5-year average.  The opportunity to begin herd expansion may begin with a smaller Fall run of cows this year, maybe even with a couple of weeks below the 5-year average.  We most likely saw the biggest weekly beef cow slaughter of the year back in January.  On the dairy side, watch for slaughter to remain below the 5-year average in the coming weeks.  Have enough dairy cows been culled to support a path to profitable production?  Can some cows be profitably held over the winter to take advantage of seasonal price increases next year with the added bonus of improved weight and quality along with, maybe, a calf to sell too?

    Anderson, David. “Cow Culling Climbing Seasonally.Southern Ag Today 3(41.2). October 10, 2023. Permalink
  • Who’s Holding Global Soybean Stocks? 

    Who’s Holding Global Soybean Stocks? 

    The size of global soybean stocks is an important factor in determining global soybean prices, but the quantity held by different countries and annual use are also relevant to the market. In the 2018/19 marketing year (during the U.S.-China trade war), the U.S held 22% of global stocks compared to China (16%), Brazil (29%), Argentina (25%), and the rest of the world (8%). Since then, China has more than doubled its share of global stocks, while the U.S. ending stock has dropped to the lowest level in eight years. At the end of the 2023/24 marketing year, the U.S. is projected to hold 5% of global soybean stocks compared to China (33%), Brazil (32%), Argentina (21%), and the rest of the world (9%).  Even though U.S. ending stocks are projected to be tight for the current marketing year, global stocks are projected to be an all-time record (Figure 1). 

    Figure 1. Projected Global Soybean Ending Stocks, by Country, at the End of the United States Marketing Year, 2012/2013 to 2023/2024

    This analysis can be taken one step further by incorporating usage.  Days-on-hand can be used to estimate a country’s stocks relative to annual use (domestic consumption + exports). China is projected to have 120 days of soybeans on hand for the past and current marketing year (Table 1).  World days-on-hand are projected at 114 days, the second highest in the past 12 years. Argentina’s soybean days-on-hand are projected to increase from a 10-year low of 159 days to a high of 197 days, by the end of the current marketing year. Due to the abundance of global stocks and the projected days-on-hand, it may be challenging for U.S. soybean exports to achieve the current USDA projection of 48.7 million metric tons (MT). This would result in increased U.S. ending stock. Additional factors such as exchange rates, discussed in a prior Southern Ag Today article, will also play an important role in U.S. exports and ending stocks.

    Based on current USDA projections, further weakness in soybean futures prices seems likely, unless a weather disruption in South America leads to reductions in projected production. A bounce back in Argentina’s drought reduced production (projected production was halved by last year’s drought) seems likely and Brazil is forecast to produce another record crop. January 2024 soybean futures have already decreased $1.49/bu since the July 24, 2023, high of $14.41/bu. A key level of support for the January contract is $12.60/bu-$12.80/bu. If prices fall below $12.60/bu, it is possible that prices test the contract low of $11.41/bu from May 31, 2023. For producers concerned with a decline in futures prices for unpriced soybeans that will be held in storage, an $11.70 put option could be purchased for 6 cents. This is cheap protection based on the large amount of uncertainty in the current South American soybean production year. 

    Table 1. Soybean Days-on-Hand by Country, 2012/2013 to 2023/2024

    References and Resources

    Barchart.com. https://www.barchart.com/futures/grains?viewName=main

    USDA September WASDE. https://www.usda.gov/oce/commodity/wasde/wasde0923.pdf


    Smith, Aaron. “Who’s Holding Global Soybean Stocks?Southern Ag Today 3(41.1). October 9, 2023. Permalink

  • How Much Can I Sell This For? Part III

    How Much Can I Sell This For? Part III

    As a continuation of the “How Much Can I Sell This For?” series, this article focused on evaluating market potential. Part IPart II

    Producers may have different opportunities with CSAs, restaurants, farmers markets, wholesale markets, on-farm, and retail outlets. So how can these avenues be evaluated? It will likely look different depending on the producer. For risk management purposes, it is recommended to set up multiple marketing channels. If one market is lost, there are still opportunities to make sales and find buyers for all of your products.

    Important questions to ask include:

    • How much product do I need to move?
    • What options are available to me?
    • What type of customers are in that market?
    • Am I charging a low, middle, or high price?
    • Are there additional costs to participating in that market?

    Typically, there will be an inverse relationship between quantity of product versus price. Meaning if you have few products, you will need a higher price per item to offset cost. Conversely, having greater quantity means lower cost per item but greater number of sales to make. A successful producer who builds relationships with multiple buyers will utilize several outlets and tiered pricing to hit their sales targets. Your marketing mix may also look different over time as you adapt to changing market needs and preferences.

    Here is an example of how to evaluate market potential. Assume there is $100.00 additional cost to participate in a farmers market each week. This may include a fee for the market, paying an employee to go to the market, and fuel for traveling to and from the location. That $100.00 would need to be covered by sales that week (or over the course of the season) for the market to be viable. Some weeks you may hit the target and other weeks you may not. If a market consistently failed to meet your goals, it may be time to look at other options. 

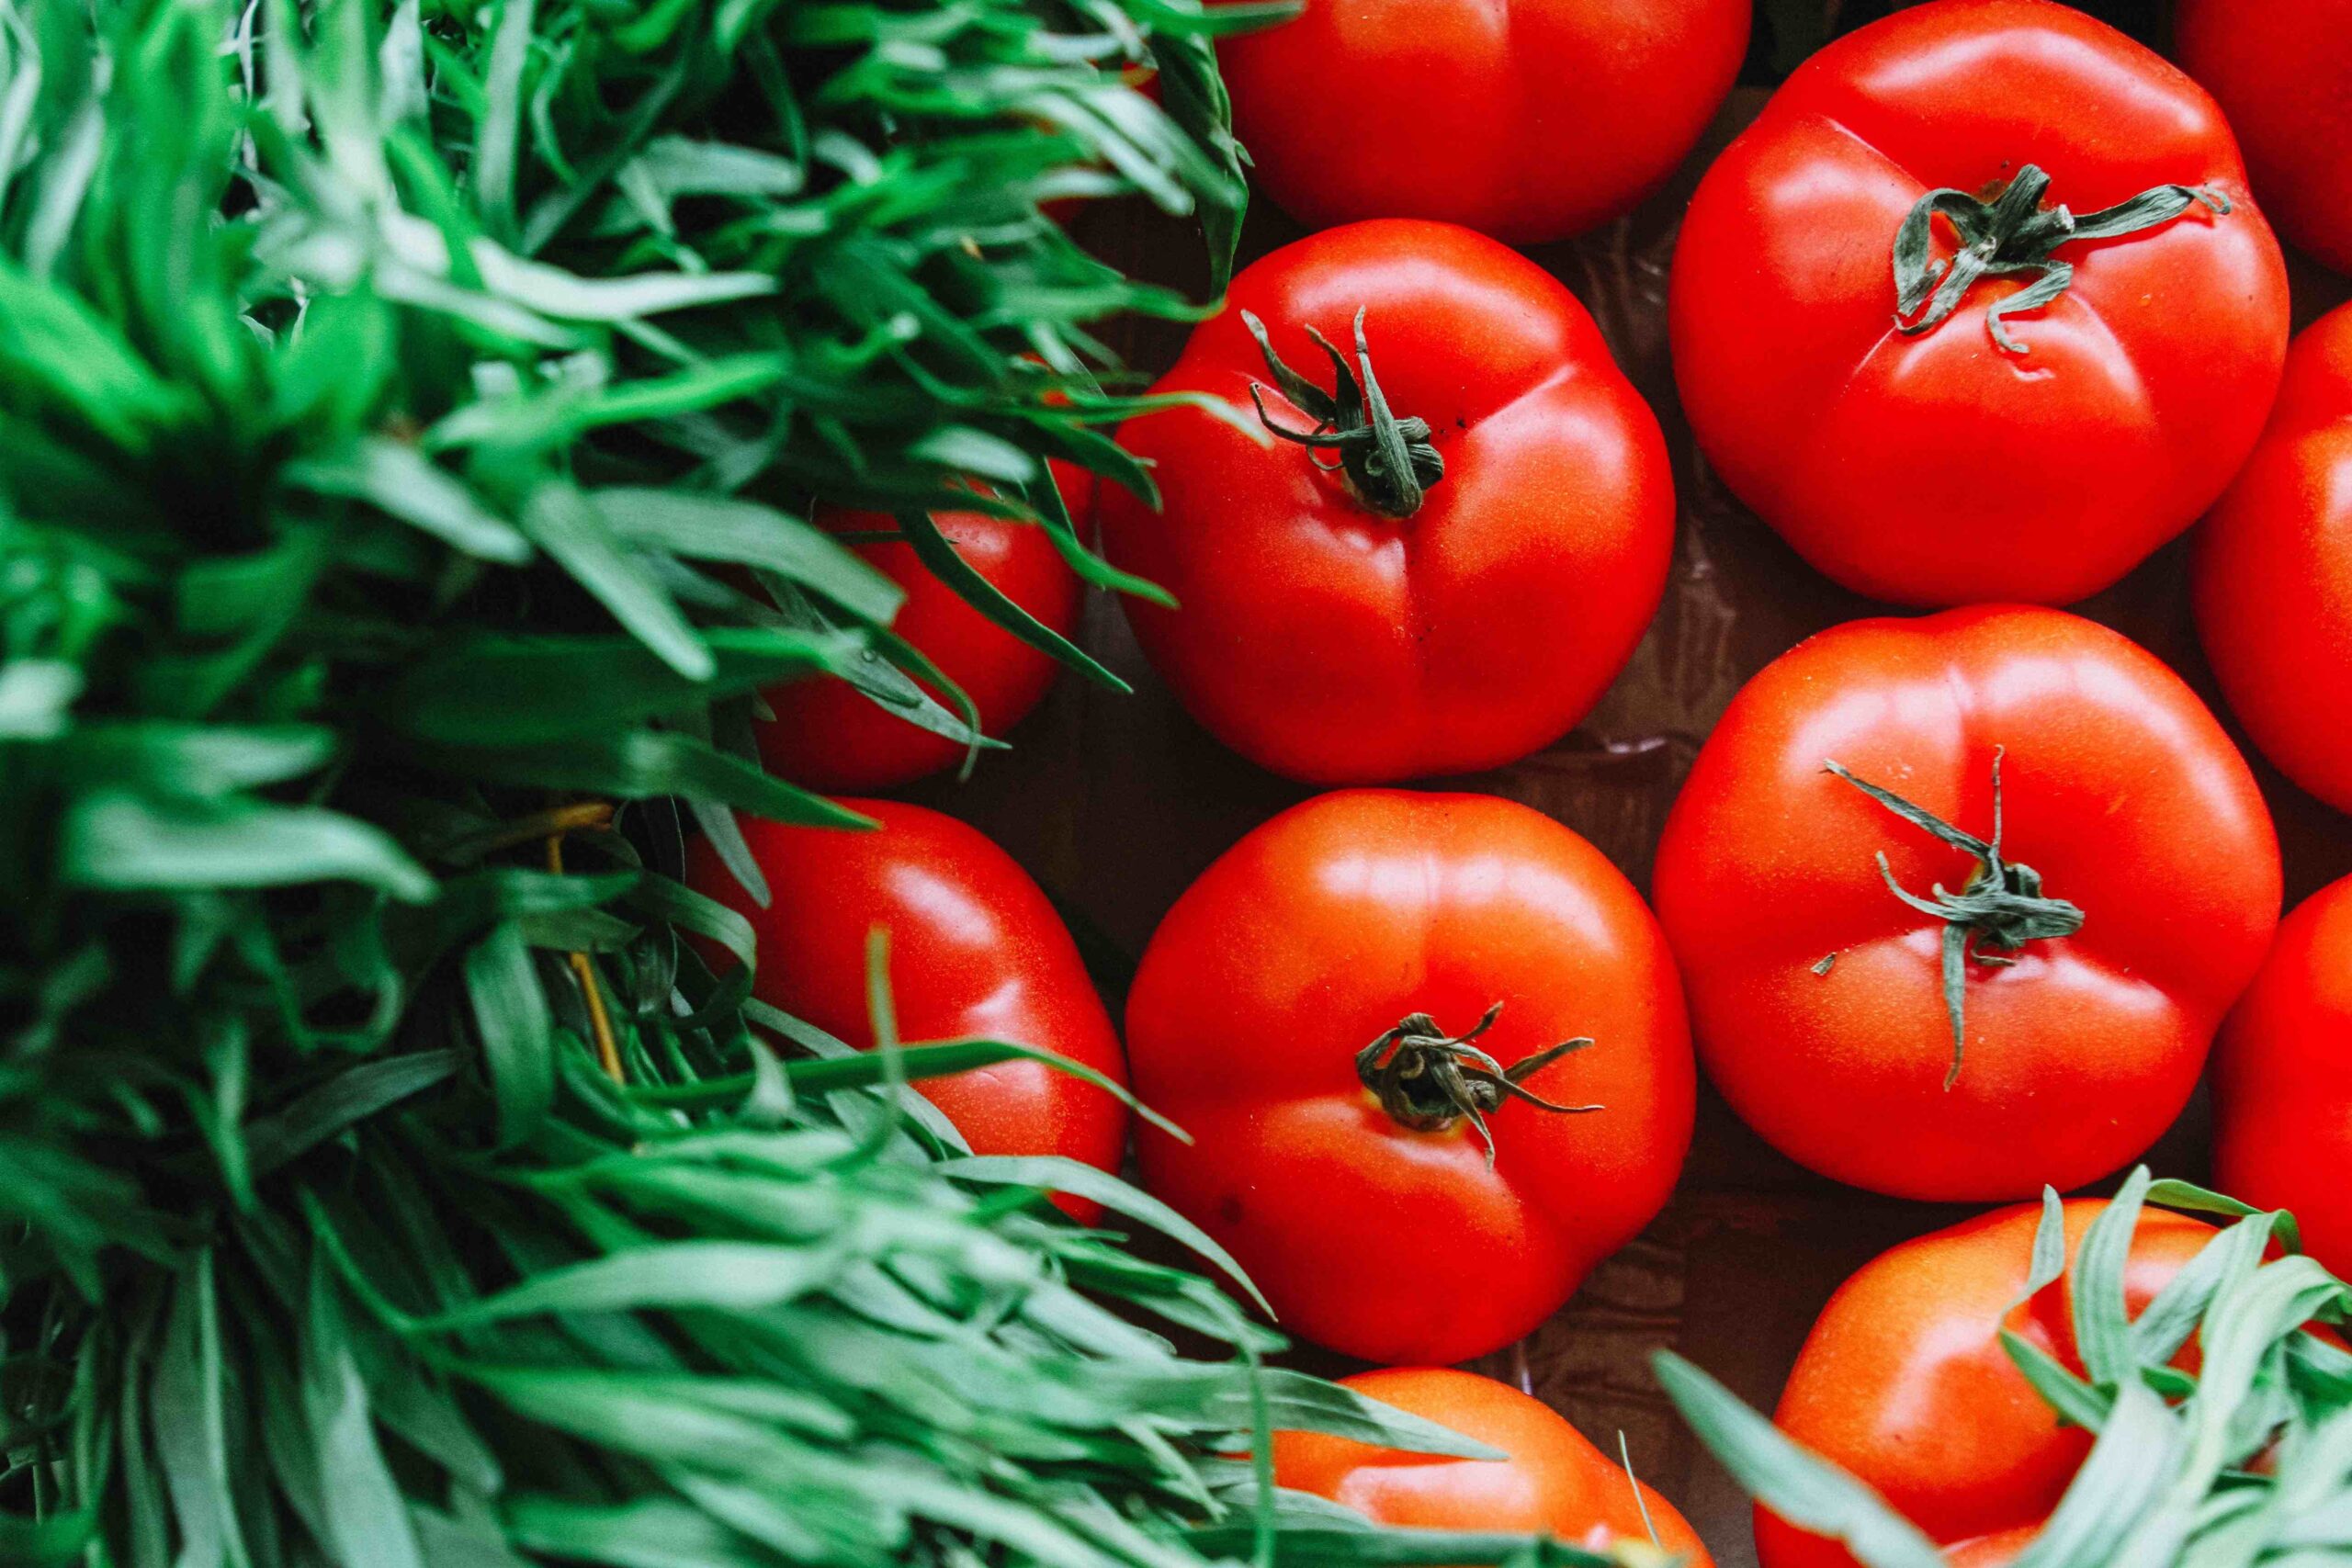
    If you were to charge average pricing for tomatoes ($1.25 per pound), what would be your breakeven for the market given this scenario? Recalling the examples shared in Tables 1 and 2 of our article titled “How Much Can I Sell This For? (Part II)”, the cost of production for tomatoes (at 38,000 lbs./acre) is $.31 cents per pound. Remember the $100.00 of marketing cost that needs to be covered. With the current scenario, $1.25 (sales price) – $.31 (cost of production) = $.94 per pound goes toward marketing (and hopefully ultimately profitability). Only when the $100.00 from marketing is covered does the business move into profitable sales. So, with the current cost of production and marketing expense you would need to sell roughly 106 lbs. of tomatoes for the market to be viable (see Table 1). 

    Table 1. Example: Evaluate Market Potential including Marketing Costs for Field-grown Tomatoes (one acre)

    Total Production Costs:$11,500 / 38,000 lbs. expected yield = $.31 per lb. 
    Sales Price: $1.25 per lb.
    Total Production Costs (subtract):$0.31 per lb.
    $0.94 per lb. 
    Marketing Cost: $100.00  
    / $.94per lb. 
    So, need to sell approximately 106 lbs.

    Perhaps that sounds like a lot to sell, so you decide to raise the sales price to $2.00/lb. Perhaps you determine the marketing cost is simply too high and it would be hard to recoup the cost. Perhaps you have three other vegetables you are selling and so the $100.00 is spread over additional items. This example looks at one product and one week at the market, but we know the season is longer and there are other markets and decisions you can make over that time period. If your price is high, you may have to adjust or find other markets. If your price is low, you may be hurting your bottom line and bringing down the overall prices others may charge in your market. Some markets have little to no marketing costs while others may charge a substantial amount. While it may be profitable, you may need to move higher volumes, so you decide to combine the farmers market and other market channels to move all your product. The analysis may be done with multiple variations, and the same principles apply but the process can become more complex with more variables present. The decision to market your own products presents additional challenges beyond agriculture production decisions, and these factors can change during the season. 

    To compete in the world of agribusiness often requires flexibility. Entering the market with a base level of knowledge provides information for you to be able to make informed decisions. Finding a particular crop or market is not viable can sometimes happen on paper before it becomes a reality. Additionally, being able to pivot and negotiate, because of your level of knowledge, is a business advantage. We hope this discussion has been useful as you think of your own goals and plans for profitability on your farm.

    Burkett, Kevin. “How Much Can I Sell This For? Part III.Southern Ag Today 3(40.5). October 6, 2023. Permalink

  • U.S. Agricultural Imports are Expected to Surpass Exports Post Covid and Beyond

    U.S. Agricultural Imports are Expected to Surpass Exports Post Covid and Beyond

    Since the beginning of the 21st century, the United States has experienced an agricultural trade surplus in 20 of the last 22 years, with 2019 and 2022 being the only years where imports surpassed exports.  U.S. agricultural imports have increased from $43.1 to $199.3 billion from 2001 to 2022, respectively. This increase of U.S. agricultural imports was accentuated during the Covid-19 pandemic years as total imports increased by 40 percent in value and 13.1 percent in volume between 2019 and 2022 (Tables 1 and 2).  The rather large difference between value and volume increases shows that there was a price increase in most of the commodities mainly due to supply chain issues and inflation during COVID-19. The largest increase in value of the top five US agricultural imports from 2019 to 2022 are oilseeds and products, grain and feeds, and livestock and meats with 105.5, 54.5, and 44.6 percent increases, respectively.  Moreover, in terms of volume, livestock and meats, other and horticultural products have the largest increase with 35.5, 21.9 and 14.1 percent respectively.

    Figure 1.  Value of U.S. Agricultural Imports, Billion Dollars

    Table 1. Value of U.S. Agricultural Imports, Thousand Dollars

    Table 2. Volume of U.S. Agricultural Imports, Metric Tons

    The latest USDA Outlook for U.S. Agricultural Trade report (August 2023) forecasted imports for 2023 at $196.5 billion, down $1.5 billion from the May forecast mainly due to easing import prices throughout FY 2023.  The year-over-year imports from January to July show an overall decrease of 1.4 percent in value, but a 4.4 percent increase in volume confirming that prices of importing commodities are easing (Tables 1 and 2).  The value of the top five U.S. agricultural imports year-over-year has gone down except for grains and feeds.  On the other hand, the volume of all U.S. agricultural imports has gone up except for sugar and tropical products. Moreover, forecasted imports for 2024 are expected to be $199.5 billion, $3 billion above 2023, and virtually the same as 2022 imports.

    ReferencesU.S. Department of Agriculture (USDA).  “Outlook for U.S. Agricultural Trade: August 2023.”  AES-125, August 31, 2023. https://www.ers.usda.gov/webdocs/outlooks/107311/aes-125.pdf?v=1152.5

    Ribera, Luis. “U.S. Agricultural Imports are Expected to Surpass Exports Post Covid and Beyond.Southern Ag Today 3(40.4). October 5, 2023. Permalink

  • Dairy Revenue Protection Historical Performance for Class Price

    Dairy Revenue Protection Historical Performance for Class Price

    Dairy Revenue Protection (Dairy-RP) is an insurance policy available to dairy producers to guarantee revenue every quarter. Dairy-RP was introduced in 2018 and is designed to help producers combat the volatile fluid milk market. Dairy-RP requires numerous choices by a producer when selecting a policy. When purchasing Dairy RP, the producer must first select which quarter (Jan-Mar, Apr-Jun, July-Sept, Oct-Dec) they would like to insure. Policies can be purchased five quarters in the future and are available up until the day before the quarter. Producers then select their pricing option of Class Pricing or Component Pricing[1] and declare a total fluid milk weight for the quarter to insure, with the minimum being 2,000 pounds. Additionally, the producer will select their coverage levels (80%, 85%, 90%, 95%) and a protection factor (1-1.5), which play a role in calculating the liability and expected revenue. Producers can receive an indemnity payment if the actual revenue is less than the expected revenue. Since the introduction of Dairy-RP, there have been over 75,000 policies purchased.  The number of Class Pricing policies has increased from 5,000 in 2019 to 18,500 in 2022. Alternatively, Component Pricing policies have decreased from 2,800 policies in 2019 down to 2,400 in 2022. This publication covers the class pricing option.

    The loss ratio is one method of measuring the performance of Dairy-RP. A Loss Ratio is the indemnity payment divided by the total premiums, thus representing a ratio of the total money paid back to the producers with respect to the total premiums paid (in total) for the policies. We often focus on a loss ratio of one, which means all money paid for the policy (insurance premiums) was distributed back to the producers in protection (indemnities).

    We analyze the performance of Dairy-RP(class price option), by state, under the class pricing option. Figure 1 shows the weighted average loss ratio for Dairy-RP (class pricing option) by state (Southern Ag Today States are colored Red). Of the 40 states enrolling in Dairy-RP, the loss ratio in 21 states was less than 1.0, three of which are in the Southeast. Alternatively, 19 states participating in Dairy-RP had a loss ratio of one or greater. States like Arizona and Colorado have loss ratios greater than two, equating to more than double the premiums received were paid back to producers with revenues lower than expected. Organizing the states by share of declared milk, Wisconsin is the second largest and accounts for 14.8% of the total milk insured under Class Pricing option but had a weighted loss ratio of only 0.80. The largest share is California, representing 18.3% of the total milk declared under the Class Pricing option with a weighted loss ratio of 1.37. The largest in the Southeast is Kentucky with a weighted loss ratio of 1.77.  

    Figure 1. Weighted Average Loss Ratio for Class Price 2019-2022

    (Data Source: USDA RMA Summary of Business Dairy Revenue Protection Participation)

    [1] Class pricing uses dollar values for class III and IV milk, where component pricing uses the dollar values for butterfat, protein, and other solids.


    Haley, Wyatt, Charley Martinez, and Chris Boyer. “Dairy Revenue Protection Historical Performance for Class Price.Southern Ag Today 3(40.3). October 4, 2023. Permalink