Blog

  • Marketing Locally Raised Meats? Lessons Learned in South Carolina        

    Marketing Locally Raised Meats? Lessons Learned in South Carolina        

    For the last three years, Clemson Cooperative Extension has been heavily involved in researching local meat supply and demand. Extension associates interviewed and surveyed livestock producers, processing facilities, and local meat consumers. As a result of this research, South Carolina is the most recent of the southern states[1] to invest in expanding local meat processing. 

    Assuming these investments solve local processing bottlenecks, the consumer demand study results are now the most important piece of the puzzle: will consumers purchase additional amounts of locally raised meat? The South Carolina consumer study seeks to provide direct-to-consumer livestock producers with additional marketing information for locally raised beef, chicken, pork, turkey, lamb, and goat. A summary of the results:

    Consumers of locally raised meats

    • Consumers tend to be younger (<45 years of age), reside in larger households, have higher educational attainment and household income, and are long-term residents of South Carolina.
    • Local meat consumers are generally willing to pay up to a 24% premium for locally raised meats to eat at home, and this holds true for all meats studied. 
    • Beef is the most popular local meat consumed, which is different from overall US meat consumption, where chicken is the most consumed meat.
    • The most desirable attributes of local meats are hormone-free, all-natural, no antibiotics, and grass-fed. Knowing the farmer was the lowest ranked, or least important, attribute.

    Marketing challenges and opportunities for locally raised meats

    • Stated barriers to purchasing (or purchasing more) locally raised meats are product unavailability, high prices, food safety concerns, convenience, and ease of preparation.
    • Consumer-preferred buying locations (ranked) were grocery stores, directly from farms, farmers markets, butcher shops, and online orders. 
    • Most consumers are unwilling to drive more than 20 miles to purchase locally raised meat.
    • Due to the first three bullets in this section, availability becomes a larger issue: locally raised meats are not typically offered in grocery stores, consumers are unwilling to drive to remote farms, farmers markets have limited days and times of operation, and there are relatively few specialty butcher shops.
    • Ease of preparation is important, and most locally raised meats are sold frozen.  
    • Consumers are accustomed to seeing meats on display before purchasing, while many direct-to-consumer livestock producers at farm markets keep their meats in closed coolers.

    The full study, with additional findings and research, is published in an open-access journal at this link https://doi.org/10.5304/jafscd.2023.122.009.  Also, please feel free to contact the author with any questions.


    [1] According to the Niche Meat Processing Assistance Network (www.nichemeatprocessing.org), Arkansas, Kansas, Kentucky, Missouri, North Carolina, and Oklahoma have also invested in local meat processing facilities.


    Richards, Steven Todd. “Marketing Locally Raised Meats? Lessons Learned in South Carolina. Southern Ag Today 3(17.2). April 25, 2023. Permalink

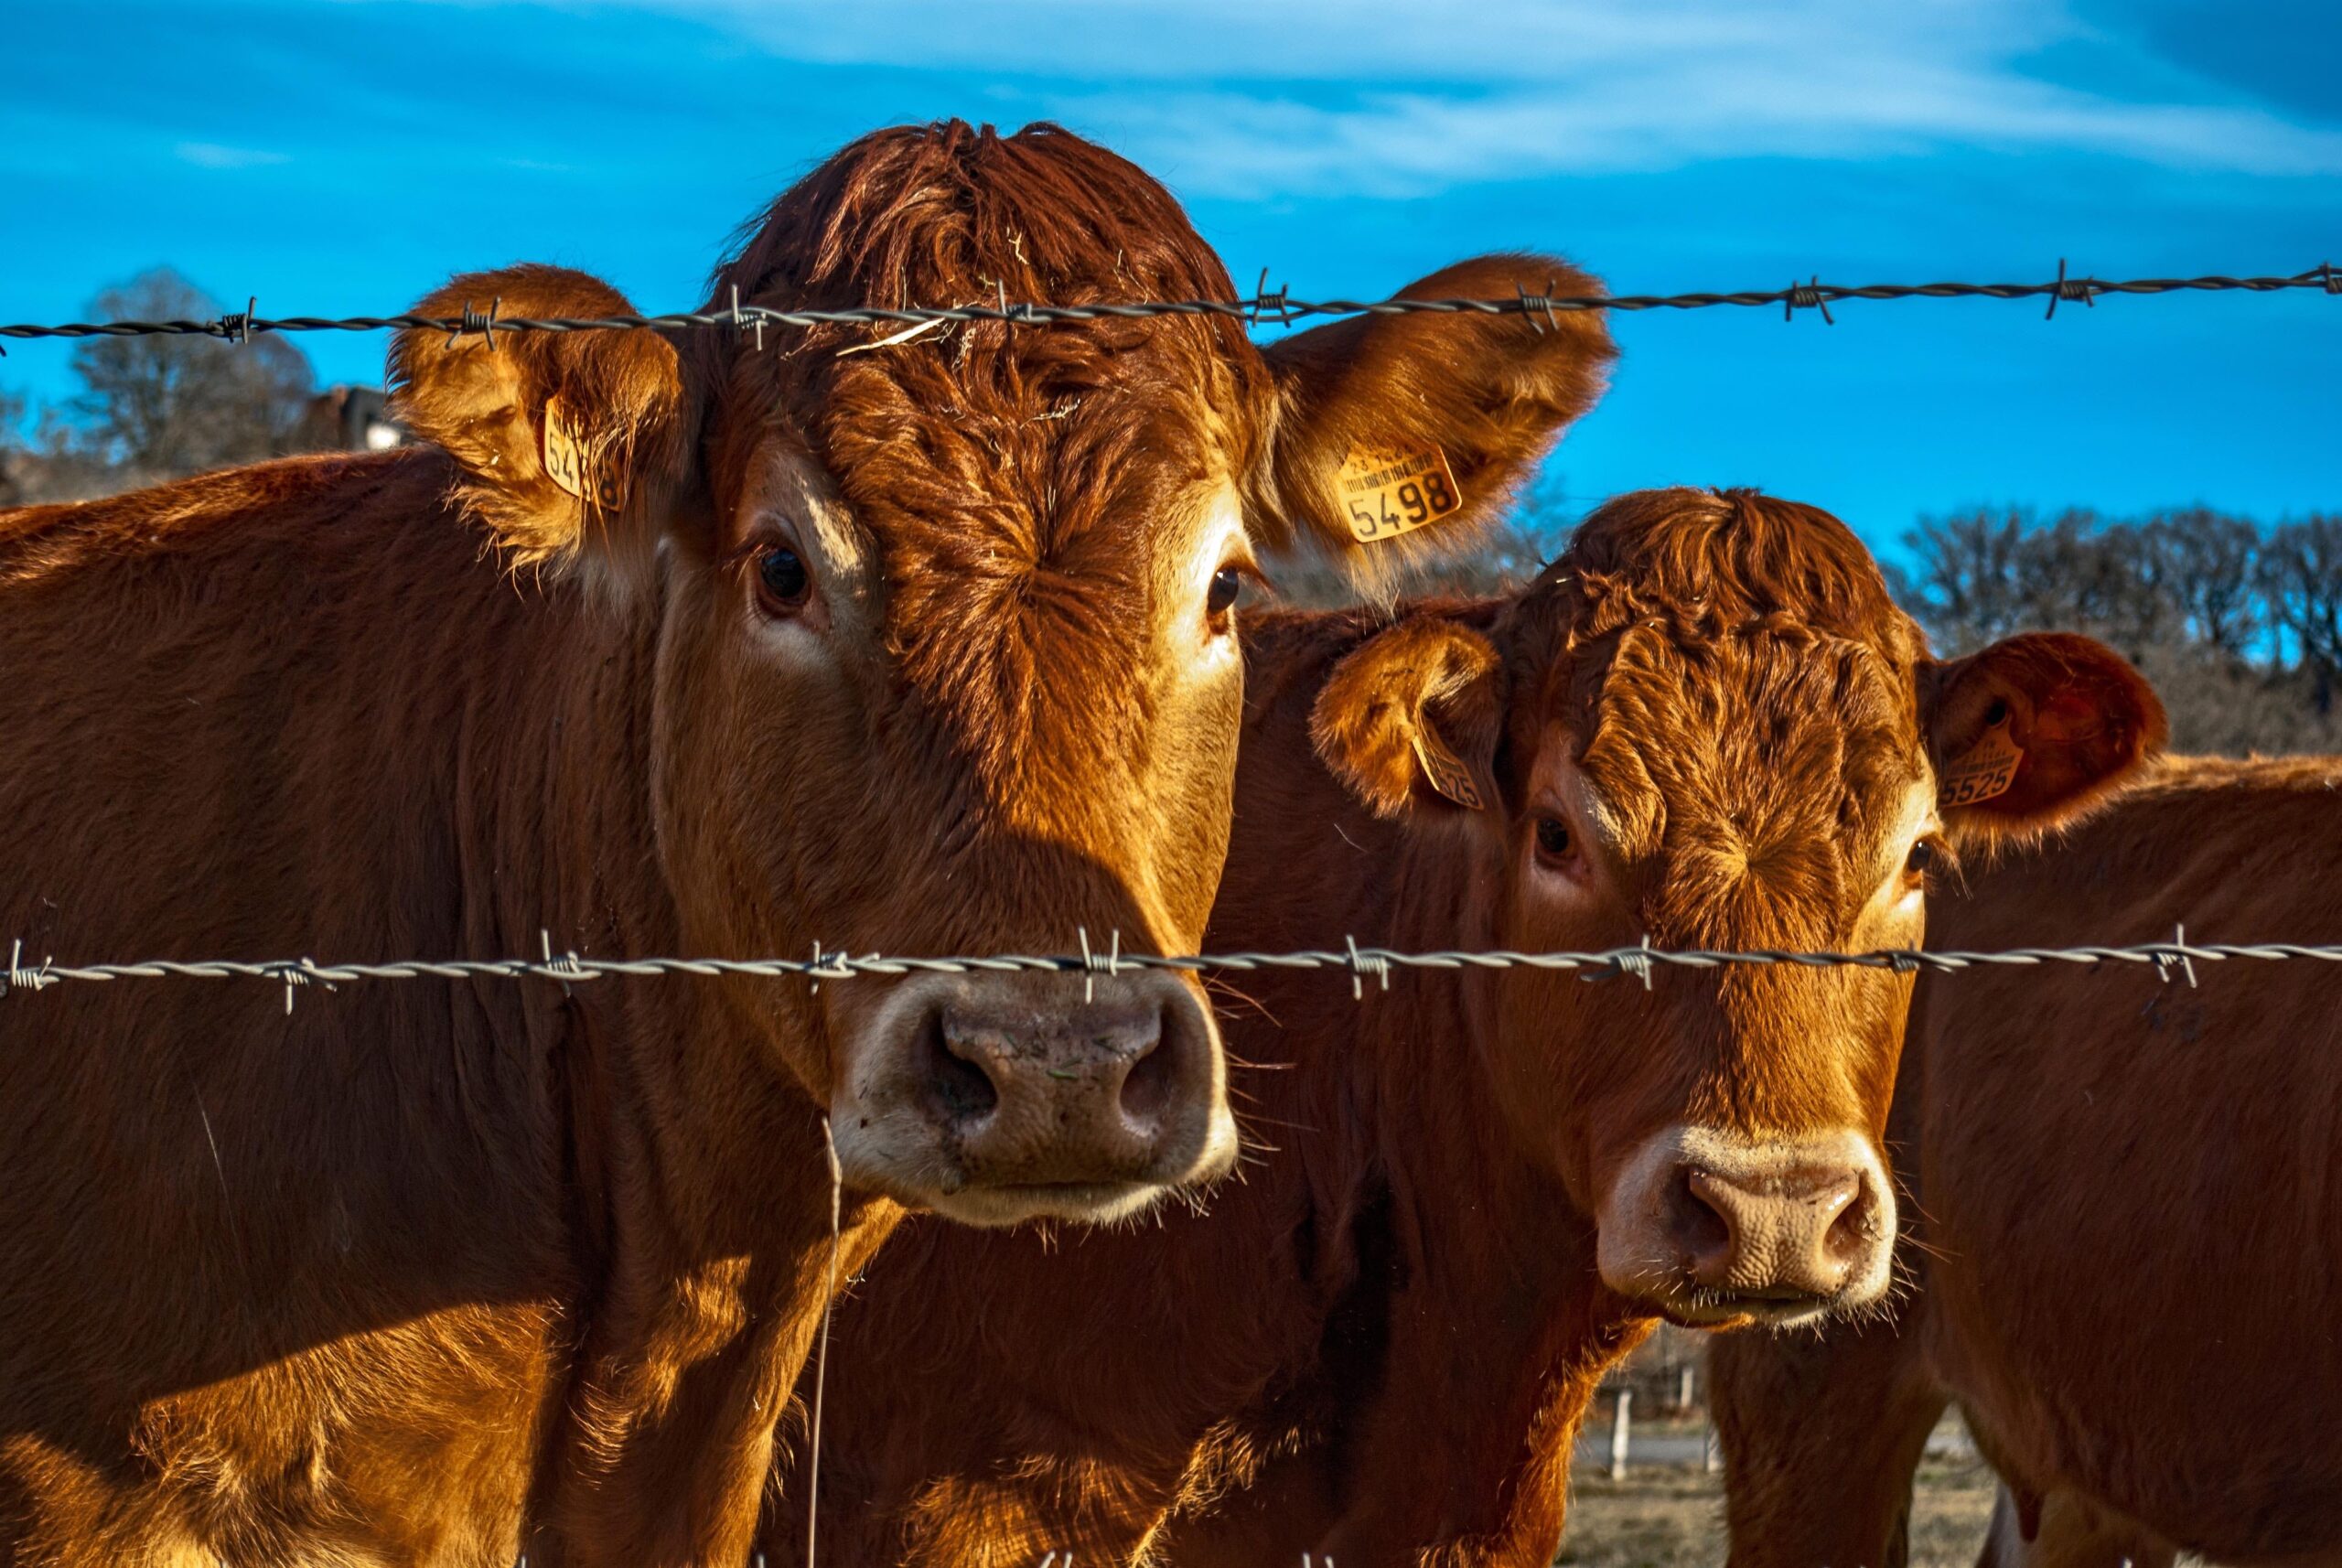
    Photo by Pixabay: https://www.pexels.com/photo/agriculture-animal-beef-bull-301600/

  • Peanut Acreage Projected to Increase in 2023

    Peanut Acreage Projected to Increase in 2023

    In 2022, the U.S. had a sizable decrease in peanut acreage, as farmers shifted cropland to more cotton acres across the region. This was likely due to price pressure from other crops around planting time in 2022, most notably cotton. However, with the average peanut price received by farmers projected to reach a ten-year high for the 2022/2023 marketing year – at an estimated $540 per ton – what is peanut acreage expected to look like in 2023?

    The USDA projects planted peanut acres to increase by 7%, reaching 1.547 million acres nationwide in 2023 (figure 1).[i] This increase in projected peanut acreage comes as prices for other crops have dropped. As of April 20th, December 2023 cotton futures closed at 80.58 cents per lb, which is 40.44 cents per lb less than what December 2022 cotton futures were traded at on the same date last year. The rise in peanut acreage is driven by forecasted increases in two of the three peanut-producing regions – the Southeast and Virginia-Carolina. None of the peanut producing states in these two regions are expected to see declines in planted acreage compared to last year. Georgia is projected to lead the way with 740 thousand planted peanut acres, which would mark an 8% increase from 2022. Conversely, the three peanut-producing states in the Southwest region are all expected to decrease acres planted to the crop in 2023, which has possibly come at the expense of their large increases in wheat acreage this year. 

    Figure 1. 2023 U.S. Intended Peanut Planted Acres Compared to Previous Year, by State

    Data Source: USDA-NASS. Prospective Plantings. March 31st, 2023. Note: Peanut acreage data not collected for Louisiana and Tennessee.

    Now, how accurate have peanut planted acreage forecasts been in recent years? Over the past decade, the error in peanut projections has been relatively small. The final peanut planted acreage estimate has exceeded the intended planted acres forecast in four out of the last nine years, by an average of 2.2%. For example, peanut planted acreage ended up being 7.7% lower than was predicted in 2022, as shown in figure 2. The accuracy of the intended peanut plantings is similar to those for rice and cotton – two other predominantly Southern crops – which are typically less accurately predicted than nationwide crops, such as corn and soybeans.[i]

    Figure 2. U.S. Peanut Intended Planted Acres vs. Final Estimates, 2019-2023

    Data Source: USDA-NASS Prospective Plantings. March 31st, 2023.

    With peanut prices elevated for last year’s crop, it remains uncertain how increased planted acreage would affect peanut markets moving forward. Last year’s decrease in peanut acreage led to an almost 400-thousand ton drop in peanut production.[i] While peanut acreage is expected to be above last year’s level, the forecasted mark would fall short of what was planted in 2020 and 2021. Coupled with the lower expected peanut consumption this current marketing year, a bumper crop could see peanut stocks soar and prices decline during the 2023/2024 marketing year, whereas a more moderate crop could see stocks remain at a similar level to where they are currently. In all, combining the projected higher peanut production with the lower competition from other crops, it is likely that peanut contract prices for this year’s crop will decrease.


    [i] Sawadgo, Wendiam. “2023 Peanut Market Outlook.” Southern Ag Today 3(8.1). February 20, 2023. Permalink

    [i] Biram, Hunter, and William E. Maples. “Key Takeaways and Reliability of the 2023 Prospective Plantings Report.” Southern Ag Today 3(14.1). April 1, 2023. Permalink

    [i] USDA-NASS. Prospective Plantings. March 31, 2023.  Available at: https://downloads.usda.library.cornell.edu/usda-esmis/files/x633f100h/rv044597v/gx41nz573/pspl0323.pdf


    Sawadgo, Wendiam. “Peanut Acreage Projected to Increase in 2023.Southern Ag Today 3(17.1). April 24, 2023. Permalink

    Photo by Marina Leonova: https://www.pexels.com/photo/close-up-shot-of-peanuts-7717463/

  • 4 Tips for Better Board Meetings

    4 Tips for Better Board Meetings

    When speaking to a newly elected director of a cooperative about the challenges they face, I often hear about the typical stresses of responsibility, understanding the cooperative’s financial statements, and, occasionally, comments about board meetings. Sometimes directors view board meetings as an unpleasant task that lasts longer than necessary, lacks focus, full of information without discussion, and generally, does not seem to accomplish anything meaningful. “Why,” they ask, “did I need to interrupt my busy schedule for something that could just as easily been handled with an email?” If this sounds like your experience, I suggest that you are missing out on perhaps the greatest tool your cooperative has for achieving competitive success. Here are four tips to get your cooperative’s board meetings back on track.

    1. Know your duty and stick to it.
    2. Build connections with other directors.
    3. Take the agenda seriously.
    4. Speak with one voice.

    Know your duty and stick to it.

    The responsibilities of a director are often summarized with the phrase, “fiduciary duties”. These duties refer to the trust cooperative members place in their directors to act in good faith on their behalf in an ethical, legal, and prudent manner to the benefit of the cooperative. Your duties as a director are to provide strategic direction, financial oversight, and to set organizational policy. The board is responsible for the hiring and compensation of only one employee, namely the general manager. Any board discussions that address specific managerial decisions, like hiring, raises, inventory, or pricing are in danger of taking the meeting off topic, distracting the board from their true responsibility, and needlessly spending time on decisions that should be left to management. 

    Build connections among directors.

    A good board meeting thrives on properly focused discussion. However, it is common for some directors to say nothing at all during meetings. This might be due to their personality, a lack of confidence, a lack of familiarity in the topic, or even the participation of another outspoken and highly opinionated director. In any case, silence is not in the best interest of the board. One key to promoting discussion is to create connections among the directors. The psychological or emotional risk from speaking in a group setting is lessened as personal relationships and trust are strengthened. Connected directors not only ask more questions and make more comments, but they are also better listeners. Perhaps the best suggestion for building connections among your board members is to participate in a board retreat or strategic planning session. 

    Take your agenda seriously.

    One thing that is a frustration to new directors is that meetings don’t start or end on time. To help directors be fully engaged during meetings, you must respect their time. If you find that friendly conversation (which builds connections!) is delaying the start of your meeting, try putting social time on the agenda prior to the start of the meeting. Then, start on time. Some other things to consider – are directors invited to add to the agenda? Do directors see the agenda in the days prior to the meeting? Are times listed on your agenda? If your meeting is going long, do you suggest tabling discussions for the next time, or with group consensus, extend the meeting? The agenda is the best tool for keeping the board on schedule and focused. A proper agenda is set by the board with the help of management. 

    Speak with one voice.

    Some boards that I work with proudly claim they have complete unity on all decisions. These same board members will also freely admit that they have plenty of disagreements during board meetings. When handled with respect and conscious conduct, disagreements and debates are a healthy part of the board decision process. Not all items require a unanimous vote, but they do require unity once a decision has been properly made. When board members leave the meeting and need to converse with members or the public, references should be about what “the board” decided. Confidentiality is required for board unity. Directors who share board conversations outside the board room or openly criticize board decisions undermine the trust of their fellow board members and destroy open conversation during board meetings. 

    What has been described here is a board culture that is conducive to conversation, respect, inclusion, trust, and overall better decision making. Meetings in such a culture will be more productive and leave directors feeling energized, not deflated. Your board chair plays a critical role in leading the board in these efforts. 


    Park, John. “4 Tips for Better Board Meetings.” Southern Ag Today 3(16.5). April 21, 2023. Permalink

    Photo by Pixabay: https://www.pexels.com/photo/white-wooden-table-with-chairs-set-416320/

  • Global Market Prospects for U.S. Long-Grain Rice for the Upcoming Marketing Year

    Global Market Prospects for U.S. Long-Grain Rice for the Upcoming Marketing Year

    According to USDA 2023 Prospective Plantings report, the long-grain rice planted area is projected at 1.96 million acres, a 9% increase relative to 2022, but still slightly below the 5-year average (2.0 million acres). At trend yields of 7,299 pounds per acre, we could expect a 14.6 million hundredweight (cwt) or 11.4% increase in production relative to 2022.

    With the expected increase in production, the pressure will be on exports to perform well and help keep market prices stable. While the share of long-grain exports to total use has been decreasing steadily since 2015, exports still accounted for between 41% and 48% of total long-grain rice use during this period[1]. The short 2022 U.S. long-grain crop (on top of an already short 2021 crop) puts extra pressure on farm prices, which have reached record levels in 2022/23 (USDA estimates an average farm price of $16.90/cwt).

    So far, 8 months into the 2022/23 marketing year, export performance has been lagging with only 34.9 million cwt (rough basis) of long-grain rice exported, compared to an average 52.4 million cwt during the same period in the last 5 years. Paddy rice exports are down almost half relative to last year, mostly due to a sharp 71% decrease in exports to Mexico and a 38% decrease in exports to Central America (Figure 1), where Mercosur (primarily Brazil) has displaced the U.S. as the top supplier. Exports of milled rice are showing a good performance despite the lack of price competitiveness, which indicates the importance of other factors aside from price. For example, the U.S. negotiated 250 thousand metric tons of milled rice exports to Iraq, a market in which U.S. rice is clearly not price competitive.

    The expectation is that a larger 2023 U.S. crop and the smaller 2022 Brazilian crop (7.9% smaller than in 2021) could provide the incentives for the U.S. to reclaim at least part of the Mexican and Central American markets. However, other aspects related to (1) milling and culinary quality differences vis-à-vis Mercosur rice, and (2) the prospects of policy changes in Central America aimed at extending trade preferences to competing countries similar to those given to the U.S. under CAFTA-DR, may hinder the prospects for U.S. rice in these Latin American markets.

    Figure 1. Exports of U.S. long-grain rice to Mexico and Central America in the first eight months of the last seven marketing years (rice marketing year: August-July).


    [1] USDA includes imports of fragrant (jasmine and basmati) rice in the rice supply and use estimations, but they are removed in this analysis as fragrant rice is a different market segment than long-grain rice.


    Durand-Morat, Alvaro. “Global Market Prospects for U.S. Long-Grain Rice for the Upcoming Marketing Year.” Southern Ag Today 3(16.4). April 20, 2023. Permalink

  • Benchmarking

    Benchmarking

    Agricultural producers constantly seek opportunities to improve their businesses by implementing new technologies and practices. In this quest for growth and improvement, benchmarking is a crucial tool that progressive and business-minded farmers and ranchers use to measure their performance against similar businesses in the industry.

    Benchmarking allows producers to identify their strengths, weaknesses, and areas where they have room to grow and improve. It should cover all management aspects, production costs, production systems, marketing, finance, and human resources. By benchmarking against other producers within the same group or the industry, one can see the production or economic results that can be achieved and understand the limitations that may prevent them from attaining them. Further, producers should also be able to analyze trends and see the results of their decisions.

    Producers should use a similar way to calculate results to ensure effective benchmarking. As a renowned agricultural economist, Danny Klinefelter, stated, “One of the most significant issues is to make sure the data is comparable and that you’re comparing apples to apples.”

    One effective benchmarking system for beef cattle producers is the Beef-Cattle Standard Performance Analysis (SPA) used in Texas and some southern states since 1992. SPA developers used the Farm Financial Standards Guidelines created by a national task force to prepare farm or ranch financial statements as a framework for analyzing and benchmarking cow-calf enterprises. Similar systems could effectively be implemented to compare all types of ag production.

    Ag Peer Advisory Groups have a long history of benchmarking, given their group culture of discussing and learning from each other.  One such example is a group of ranchers from North Texas and Oklahoma that meet monthly to critique each other’s operations, share ideas, and benchmark production and economic performance.  The group is facilitated by leadership from Texas A&M AgriLife Extension and supported with funding from the Southern Risk Management Education Center.       

    While informal peer advising is common, the advantage of formal groups or associations is the development of production and financial management standards to ensure they compare the same information.  Developing and implementing effective benchmarking systems across all types of ag production will enable producers to continually improve their performance.  Check with your state’s Extension Economists to learn more about performance benchmarking opportunities. 


    Abello, Francisco Pancho. “Benchmarking.” Southern Ag Today 3(16.3). April 19, 2023. Permalink